| Multiple Linear Regression - Estimated Regression Equation |
| Werkl[t] = + 151.897366875482 -0.450048120480986Infl[t] -0.0787500367219569M1[t] -0.120513226375434M2[t] -0.109860556364425M3[t] -0.177209811172649M4[t] -0.115558103571257M5[t] -0.162907358379490M6[t] -0.152254688368479M7[t] -0.112601055947849M8[t] -0.0939560852137956M9[t] -0.00130534002201750M10[t] -0.0176555572398707M11[t] + 0.0383482923986089t + e[t] |
| Multiple Linear Regression - Ordinary Least Squares | |||||
| Variable | Parameter | S.D. | T-STAT H0: parameter = 0 | 2-tail p-value | 1-tail p-value |
| (Intercept) | 151.897366875482 | 6.788831 | 22.3746 | 0 | 0 |
| Infl | -0.450048120480986 | 0.066701 | -6.7473 | 0 | 0 |
| M1 | -0.0787500367219569 | 0.191341 | -0.4116 | 0.682527 | 0.341263 |
| M2 | -0.120513226375434 | 0.200525 | -0.601 | 0.550735 | 0.275367 |
| M3 | -0.109860556364425 | 0.200315 | -0.5484 | 0.585986 | 0.292993 |
| M4 | -0.177209811172649 | 0.20001 | -0.886 | 0.380127 | 0.190063 |
| M5 | -0.115558103571257 | 0.199794 | -0.5784 | 0.565765 | 0.282882 |
| M6 | -0.162907358379490 | 0.19956 | -0.8163 | 0.418428 | 0.209214 |
| M7 | -0.152254688368479 | 0.199444 | -0.7634 | 0.449042 | 0.224521 |
| M8 | -0.112601055947849 | 0.199418 | -0.5646 | 0.574998 | 0.287499 |
| M9 | -0.0939560852137956 | 0.199101 | -0.4719 | 0.639181 | 0.319591 |
| M10 | -0.00130534002201750 | 0.199043 | -0.0066 | 0.994795 | 0.497398 |
| M11 | -0.0176555572398707 | 0.199055 | -0.0887 | 0.9297 | 0.46485 |
| t | 0.0383482923986089 | 0.002348 | 16.3305 | 0 | 0 |
| Multiple Linear Regression - Regression Statistics | |
| Multiple R | 0.931216785308686 |
| R-squared | 0.867164701240643 |
| Adjusted R-squared | 0.830423022860395 |
| F-TEST (value) | 23.6016627293442 |
| F-TEST (DF numerator) | 13 |
| F-TEST (DF denominator) | 47 |
| p-value | 2.22044604925031e-16 |
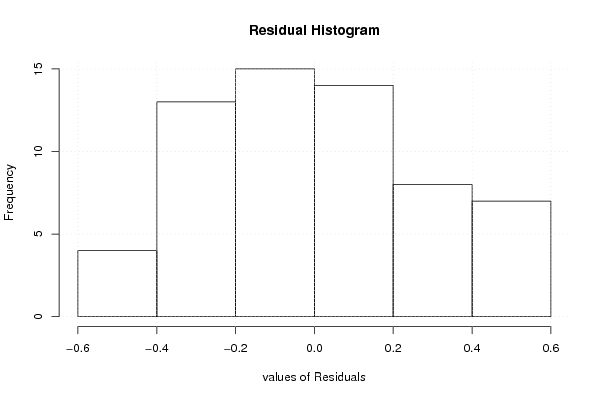
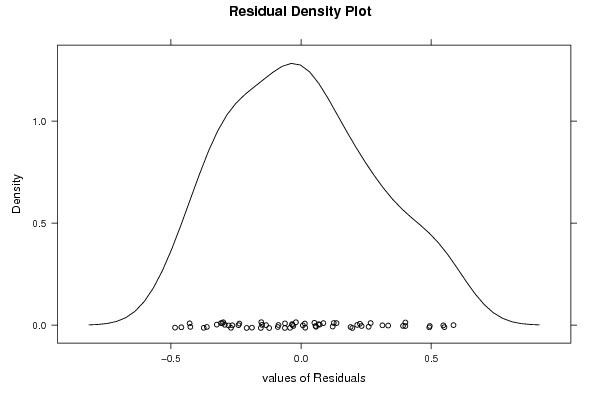
| Multiple Linear Regression - Residual Statistics | |
| Residual Standard Deviation | 0.3146140316187 |
| Sum Squared Residuals | 4.65215347789449 |
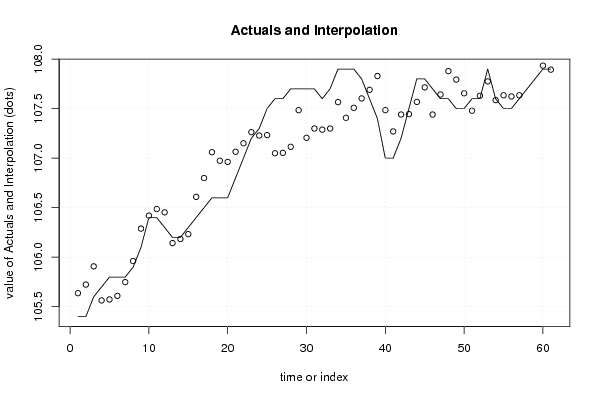
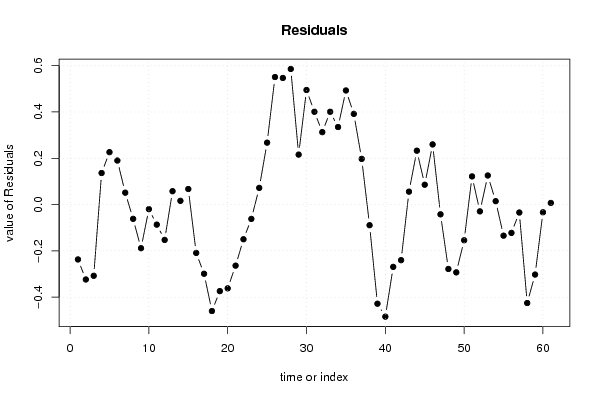
| Multiple Linear Regression - Actuals, Interpolation, and Residuals | |||
| Time or Index | Actuals | Interpolation Forecast | Residuals Prediction Error |
| 1 | 105.4 | 105.637023157761 | -0.237023157761039 |
| 2 | 105.4 | 105.723617884603 | -0.323617884602509 |
| 3 | 105.6 | 105.907633283156 | -0.307633283156431 |
| 4 | 105.7 | 105.56359863641 | 0.136401363589883 |
| 5 | 105.8 | 105.573589012314 | 0.226410987686070 |
| 6 | 105.8 | 105.609592861952 | 0.190407138047597 |
| 7 | 105.8 | 105.748603448458 | 0.0513965515417788 |
| 8 | 105.9 | 105.961619809422 | -0.0616198094217461 |
| 9 | 106.1 | 106.288641944843 | -0.188641944843008 |
| 10 | 106.4 | 106.419640982433 | -0.0196409824333840 |
| 11 | 106.4 | 106.486643869662 | -0.0866438696622418 |
| 12 | 106.3 | 106.452638095205 | -0.152638095204531 |
| 13 | 106.2 | 106.142207478593 | 0.0577925214074108 |
| 14 | 106.2 | 106.183797393386 | 0.0162026066141837 |
| 15 | 106.3 | 106.232798355795 | 0.0672016442045595 |
| 16 | 106.4 | 106.608840701819 | -0.208840701818706 |
| 17 | 106.5 | 106.798850325915 | -0.298850325914904 |
| 18 | 106.6 | 107.059878235794 | -0.459878235793881 |
| 19 | 106.6 | 106.973864762059 | -0.373864762059206 |
| 20 | 106.6 | 106.961857062782 | -0.361857062782248 |
| 21 | 106.8 | 107.063855137963 | -0.263855137963003 |
| 22 | 107 | 107.149849363505 | -0.149849363505291 |
| 23 | 107.2 | 107.261857062782 | -0.0618570627822418 |
| 24 | 107.3 | 107.227851288325 | 0.0721487116754713 |
| 25 | 107.5 | 107.232454356049 | 0.267545643950726 |
| 26 | 107.6 | 107.049020210602 | 0.550979789397979 |
| 27 | 107.6 | 107.053016360964 | 0.546983639036463 |
| 28 | 107.7 | 107.114025022650 | 0.585974977349888 |
| 29 | 107.7 | 107.484053894939 | 0.2159461050613 |
| 30 | 107.7 | 107.205024060240 | 0.494975939759512 |
| 31 | 107.7 | 107.299029834698 | 0.400970165301796 |
| 32 | 107.6 | 107.287022135421 | 0.312977864578741 |
| 33 | 107.7 | 107.299010586506 | 0.400989413494189 |
| 34 | 107.9 | 107.565024060240 | 0.334975939759511 |
| 35 | 107.9 | 107.407002887229 | 0.492997112771146 |
| 36 | 107.9 | 107.508011548915 | 0.39198845108457 |
| 37 | 107.8 | 107.602624240736 | 0.197375759263615 |
| 38 | 107.6 | 107.689218967578 | -0.0892189675777174 |
| 39 | 107.4 | 107.828229554084 | -0.428229554083523 |
| 40 | 107 | 107.484194907337 | -0.484194907337222 |
| 41 | 107 | 107.269161223001 | -0.269161223000531 |
| 42 | 107.2 | 107.440179508783 | -0.240179508783302 |
| 43 | 107.5 | 107.444175659145 | 0.0558243408551718 |
| 44 | 107.8 | 107.567182396012 | 0.232817603987833 |
| 45 | 107.8 | 107.714185283241 | 0.0858147167589736 |
| 46 | 107.7 | 107.440141012399 | 0.259858987601482 |
| 47 | 107.6 | 107.642158335772 | -0.0421583357716794 |
| 48 | 107.6 | 107.878181433603 | -0.278181433602549 |
| 49 | 107.5 | 107.792774877231 | -0.292774877231100 |
| 50 | 107.5 | 107.654345543832 | -0.154345543831937 |
| 51 | 107.6 | 107.478322446001 | 0.121677553998932 |
| 52 | 107.6 | 107.629340731784 | -0.0293407317838436 |
| 53 | 107.9 | 107.774345543832 | 0.125654456168065 |
| 54 | 107.6 | 107.58532533323 | 0.0146746667700741 |
| 55 | 107.5 | 107.634326295640 | -0.134326295639540 |
| 56 | 107.5 | 107.622318596363 | -0.122318596362581 |
| 57 | 107.6 | 107.634307047447 | -0.0343070474471519 |
| 58 | 107.7 | 108.125344581422 | -0.425344581422318 |
| 59 | 107.8 | 108.102337844555 | -0.302337844554983 |
| 60 | 107.9 | 107.933317633953 | -0.0333176339529607 |
| 61 | 107.9 | 107.892915889630 | 0.00708411037038624 |
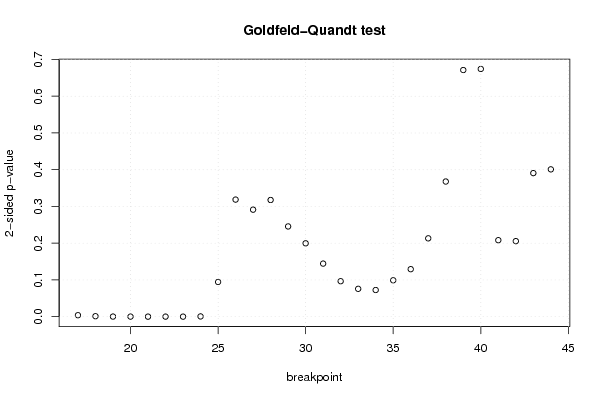
| Goldfeld-Quandt test for Heteroskedasticity | |||
| p-values | Alternative Hypothesis | ||
| breakpoint index | greater | 2-sided | less |
| 17 | 0.00198464167412897 | 0.00396928334825794 | 0.998015358325871 |
| 18 | 0.000617576502372092 | 0.00123515300474418 | 0.999382423497628 |
| 19 | 0.000125603039415103 | 0.000251206078830206 | 0.999874396960585 |
| 20 | 3.82999762714609e-05 | 7.65999525429218e-05 | 0.999961700023729 |
| 21 | 1.26262254317022e-05 | 2.52524508634043e-05 | 0.999987373774568 |
| 22 | 3.25860107899585e-05 | 6.5172021579917e-05 | 0.99996741398921 |
| 23 | 1.61640286269508e-05 | 3.23280572539016e-05 | 0.999983835971373 |
| 24 | 0.000330199504044706 | 0.000660399008089412 | 0.999669800495955 |
| 25 | 0.0472012981135954 | 0.0944025962271907 | 0.952798701886405 |
| 26 | 0.159315392088651 | 0.318630784177301 | 0.84068460791135 |
| 27 | 0.145592163332555 | 0.291184326665110 | 0.854407836667445 |
| 28 | 0.158773372309455 | 0.317546744618909 | 0.841226627690545 |
| 29 | 0.122792973376706 | 0.245585946753413 | 0.877207026623294 |
| 30 | 0.0998057929354175 | 0.199611585870835 | 0.900194207064583 |
| 31 | 0.0721978302314857 | 0.144395660462971 | 0.927802169768514 |
| 32 | 0.0482364357179943 | 0.0964728714359886 | 0.951763564282006 |
| 33 | 0.0378871303796307 | 0.0757742607592614 | 0.96211286962037 |
| 34 | 0.0362705351806109 | 0.0725410703612218 | 0.96372946481939 |
| 35 | 0.0495148974697172 | 0.0990297949394345 | 0.950485102530283 |
| 36 | 0.0646274518780178 | 0.129254903756036 | 0.935372548121982 |
| 37 | 0.10659273641053 | 0.21318547282106 | 0.89340726358947 |
| 38 | 0.183895202370519 | 0.367790404741037 | 0.816104797629482 |
| 39 | 0.335591986572272 | 0.671183973144544 | 0.664408013427728 |
| 40 | 0.662911044070256 | 0.674177911859489 | 0.337088955929744 |
| 41 | 0.895943402009735 | 0.208113195980529 | 0.104056597990265 |
| 42 | 0.897221859586557 | 0.205556280826886 | 0.102778140413443 |
| 43 | 0.804656957208286 | 0.390686085583429 | 0.195343042791714 |
| 44 | 0.799529133474307 | 0.400941733051386 | 0.200470866525693 |
| Meta Analysis of Goldfeld-Quandt test for Heteroskedasticity | |||
| Description | # significant tests | % significant tests | OK/NOK |
| 1% type I error level | 8 | 0.285714285714286 | NOK |
| 5% type I error level | 8 | 0.285714285714286 | NOK |
| 10% type I error level | 13 | 0.464285714285714 | NOK |