| Multiple Linear Regression - Estimated Regression Equation |
| Y[t] = + 1.93696698747801 + 0.657290696471075X[t] -0.198364069129669M1[t] -0.202353720376696M2[t] + 0.026854186070578M3[t] + 0.196624650729587M4[t] + 0.170895581082480M5[t] + 0.0925832557176857M6[t] + 0.125729069647108M7[t] + 0.277187208941323M8[t] + 0.468082790023802M9[t] + 0.652124185035703M10[t] + 0.578978371106282M11[t] + e[t] |
| Multiple Linear Regression - Ordinary Least Squares | |||||
| Variable | Parameter | S.D. | T-STAT H0: parameter = 0 | 2-tail p-value | 1-tail p-value |
| (Intercept) | 1.93696698747801 | 0.338009 | 5.7305 | 1e-06 | 0 |
| X | 0.657290696471075 | 0.035783 | 18.3689 | 0 | 0 |
| M1 | -0.198364069129669 | 0.151798 | -1.3068 | 0.19752 | 0.09876 |
| M2 | -0.202353720376696 | 0.158165 | -1.2794 | 0.206911 | 0.103456 |
| M3 | 0.026854186070578 | 0.157308 | 0.1707 | 0.865168 | 0.432584 |
| M4 | 0.196624650729587 | 0.157833 | 1.2458 | 0.218892 | 0.109446 |
| M5 | 0.170895581082480 | 0.157581 | 1.0845 | 0.283563 | 0.141781 |
| M6 | 0.0925832557176857 | 0.157332 | 0.5885 | 0.558984 | 0.279492 |
| M7 | 0.125729069647108 | 0.157347 | 0.7991 | 0.428193 | 0.214097 |
| M8 | 0.277187208941323 | 0.157672 | 1.758 | 0.085123 | 0.042561 |
| M9 | 0.468082790023802 | 0.158577 | 2.9518 | 0.004877 | 0.002438 |
| M10 | 0.652124185035703 | 0.160152 | 4.0719 | 0.000174 | 8.7e-05 |
| M11 | 0.578978371106282 | 0.160019 | 3.6182 | 0.000712 | 0.000356 |
| Multiple Linear Regression - Regression Statistics | |
| Multiple R | 0.93612045291971 |
| R-squared | 0.876321502374602 |
| Adjusted R-squared | 0.845401877968253 |
| F-TEST (value) | 28.3419193861440 |
| F-TEST (DF numerator) | 12 |
| F-TEST (DF denominator) | 48 |
| p-value | 0 |
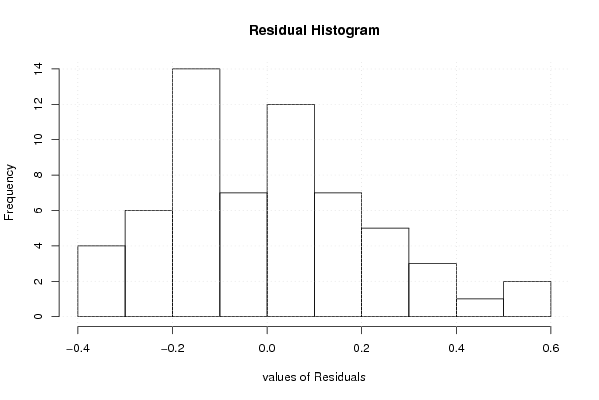
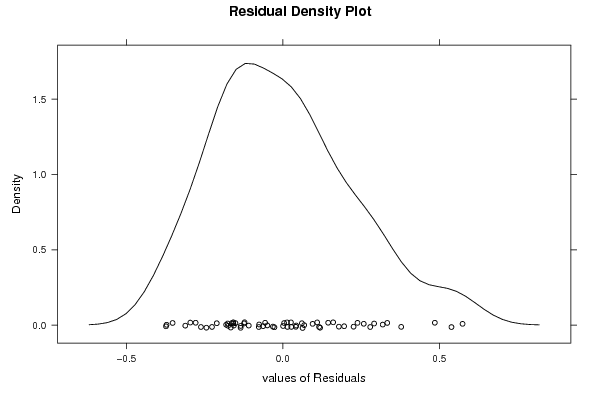
| Multiple Linear Regression - Residual Statistics | |
| Residual Standard Deviation | 0.248722542545239 |
| Sum Squared Residuals | 2.96941935216807 |
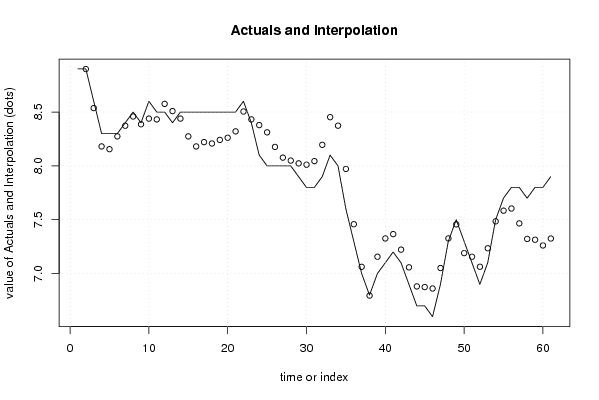
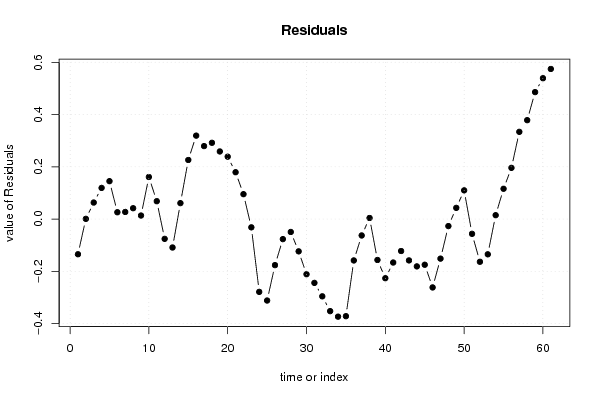
| Multiple Linear Regression - Actuals, Interpolation, and Residuals | |||
| Time or Index | Actuals | Interpolation Forecast | Residuals Prediction Error |
| 1 | 8.9 | 9.03452964917727 | -0.134529649177271 |
| 2 | 8.9 | 8.89908185863604 | 0.000918141363964084 |
| 3 | 8.6 | 8.53672813825934 | 0.0632718617406598 |
| 4 | 8.3 | 8.18066604574149 | 0.119333954258513 |
| 5 | 8.3 | 8.15493697609438 | 0.145063023905620 |
| 6 | 8.3 | 8.27381185967091 | 0.0261881403290909 |
| 7 | 8.4 | 8.37268674324744 | 0.0273132567525615 |
| 8 | 8.5 | 8.45841581289455 | 0.0415841871054534 |
| 9 | 8.4 | 8.3863951153886 | 0.0136048846114047 |
| 10 | 8.6 | 8.43897837110628 | 0.161021628893719 |
| 11 | 8.5 | 8.43156162682397 | 0.0684383731760322 |
| 12 | 8.5 | 8.57560302183587 | -0.0756030218358685 |
| 13 | 8.4 | 8.50869709200042 | -0.108697092000415 |
| 14 | 8.5 | 8.43897837110628 | 0.0610216288937193 |
| 15 | 8.5 | 8.27381185967091 | 0.226188140329091 |
| 16 | 8.5 | 8.18066604574149 | 0.319333954258512 |
| 17 | 8.5 | 8.22066604574149 | 0.279333954258511 |
| 18 | 8.5 | 8.2080827900238 | 0.291917209976198 |
| 19 | 8.5 | 8.24122860395322 | 0.258771396046776 |
| 20 | 8.5 | 8.26122860395322 | 0.238771396046776 |
| 21 | 8.5 | 8.32066604574149 | 0.179333954258512 |
| 22 | 8.6 | 8.50470744075339 | 0.0952925592466107 |
| 23 | 8.4 | 8.43156162682397 | -0.0315616268239674 |
| 24 | 8.1 | 8.37841581289455 | -0.278415812894547 |
| 25 | 8 | 8.3115098830591 | -0.311509883059092 |
| 26 | 8 | 8.17606209251785 | -0.176062092517852 |
| 27 | 8 | 8.07662465072959 | -0.0766246507295872 |
| 28 | 8 | 8.04920790644727 | -0.0492079064472736 |
| 29 | 7.9 | 8.02347883680017 | -0.123478836800165 |
| 30 | 7.8 | 8.01089558108248 | -0.210895581082479 |
| 31 | 7.8 | 8.0440413950119 | -0.244041395011901 |
| 32 | 7.9 | 8.19549953430612 | -0.295499534306116 |
| 33 | 8.1 | 8.4521241850357 | -0.352124185035703 |
| 34 | 8 | 8.37324930145918 | -0.373249301459175 |
| 35 | 7.6 | 7.97145813929422 | -0.371458139294216 |
| 36 | 7.3 | 7.45820883783504 | -0.158208837835041 |
| 37 | 7 | 7.06265755976405 | -0.062657559764049 |
| 38 | 6.8 | 6.79575162992859 | 0.0042483700714069 |
| 39 | 7 | 7.15641767567008 | -0.156417675670082 |
| 40 | 7.1 | 7.32618814032909 | -0.226188140329091 |
| 41 | 7.2 | 7.36618814032909 | -0.166188140329090 |
| 42 | 7.1 | 7.22214674531719 | -0.122146745317190 |
| 43 | 6.9 | 7.05810535030529 | -0.158105350305288 |
| 44 | 6.7 | 6.88091814136397 | -0.180918141363965 |
| 45 | 6.7 | 6.87462651350512 | -0.174626513505122 |
| 46 | 6.6 | 6.8614806995757 | -0.261480699575701 |
| 47 | 6.9 | 7.05125116423471 | -0.151251164234709 |
| 48 | 7.3 | 7.32675069854082 | -0.0267506985408253 |
| 49 | 7.5 | 7.4570319776467 | 0.0429680223533061 |
| 50 | 7.3 | 7.19012604781124 | 0.109873952188761 |
| 51 | 7.1 | 7.15641767567008 | -0.056417675670082 |
| 52 | 6.9 | 7.06327186174066 | -0.16327186174066 |
| 53 | 7.1 | 7.23473000103488 | -0.134730001034876 |
| 54 | 7.5 | 7.48506302390562 | 0.0149369760943803 |
| 55 | 7.7 | 7.58393790748215 | 0.116062092517851 |
| 56 | 7.8 | 7.60393790748215 | 0.196062092517852 |
| 57 | 7.8 | 7.46618814032909 | 0.333811859670909 |
| 58 | 7.7 | 7.32158418710545 | 0.378415812894547 |
| 59 | 7.8 | 7.31416744282314 | 0.48583255717686 |
| 60 | 7.8 | 7.26102162889372 | 0.538978371106282 |
| 61 | 7.9 | 7.32557383835248 | 0.574426161647521 |
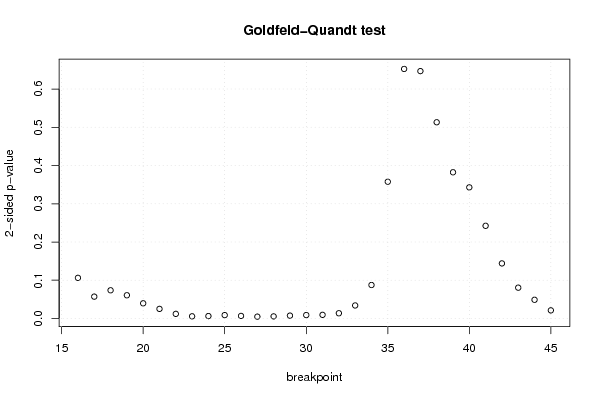
| Goldfeld-Quandt test for Heteroskedasticity | |||
| p-values | Alternative Hypothesis | ||
| breakpoint index | greater | 2-sided | less |
| 16 | 0.0531170011327804 | 0.106234002265561 | 0.94688299886722 |
| 17 | 0.0285600670852211 | 0.0571201341704421 | 0.971439932914779 |
| 18 | 0.0368668186732730 | 0.0737336373465459 | 0.963133181326727 |
| 19 | 0.0303728049845187 | 0.0607456099690373 | 0.969627195015481 |
| 20 | 0.0198468891846181 | 0.0396937783692362 | 0.980153110815382 |
| 21 | 0.0125646747047455 | 0.0251293494094911 | 0.987435325295254 |
| 22 | 0.00605042536159747 | 0.0121008507231949 | 0.993949574638402 |
| 23 | 0.00283386047369268 | 0.00566772094738537 | 0.997166139526307 |
| 24 | 0.00316367125579150 | 0.00632734251158299 | 0.996836328744209 |
| 25 | 0.00443100701124474 | 0.00886201402248947 | 0.995568992988755 |
| 26 | 0.00332869236471632 | 0.00665738472943263 | 0.996671307635284 |
| 27 | 0.00240081182182157 | 0.00480162364364315 | 0.997599188178178 |
| 28 | 0.00275037054404603 | 0.00550074108809206 | 0.997249629455954 |
| 29 | 0.00372723571865105 | 0.00745447143730209 | 0.99627276428135 |
| 30 | 0.00448213928387817 | 0.00896427856775634 | 0.995517860716122 |
| 31 | 0.00477081299065301 | 0.00954162598130602 | 0.995229187009347 |
| 32 | 0.00685295175248257 | 0.0137059035049651 | 0.993147048247517 |
| 33 | 0.0170353204696957 | 0.0340706409393913 | 0.982964679530304 |
| 34 | 0.0437523981382714 | 0.0875047962765429 | 0.956247601861729 |
| 35 | 0.178794881020581 | 0.357589762041161 | 0.82120511897942 |
| 36 | 0.326236447420482 | 0.652472894840963 | 0.673763552579518 |
| 37 | 0.323405886229708 | 0.646811772459416 | 0.676594113770292 |
| 38 | 0.256542822012115 | 0.513085644024231 | 0.743457177987885 |
| 39 | 0.191154783942183 | 0.382309567884367 | 0.808845216057817 |
| 40 | 0.171412731783793 | 0.342825463567586 | 0.828587268216207 |
| 41 | 0.121168400409862 | 0.242336800819724 | 0.878831599590138 |
| 42 | 0.0720232551954663 | 0.144046510390933 | 0.927976744804534 |
| 43 | 0.040294524072307 | 0.080589048144614 | 0.959705475927693 |
| 44 | 0.0244396651579274 | 0.0488793303158547 | 0.975560334842073 |
| 45 | 0.0106259472711783 | 0.0212518945423566 | 0.989374052728822 |
| Meta Analysis of Goldfeld-Quandt test for Heteroskedasticity | |||
| Description | # significant tests | % significant tests | OK/NOK |
| 1% type I error level | 9 | 0.3 | NOK |
| 5% type I error level | 16 | 0.533333333333333 | NOK |
| 10% type I error level | 21 | 0.7 | NOK |