| Multiple Linear Regression - Estimated Regression Equation |
| Y[t] = + 3580.46697505064 + 0.0879589903051959X[t] -3363.86695716855M1[t] -3052.59898369868M2[t] -2739.25415281523M3[t] -2542.97232292653M4[t] -2291.51219027590M5[t] -2063.65837622777M6[t] -1721.72140851618M7[t] -1390.73302941988M8[t] -1051.99640047540M9[t] -725.289657296368M10[t] -382.029542527825M11[t] + e[t] |
| Multiple Linear Regression - Ordinary Least Squares | |||||
| Variable | Parameter | S.D. | T-STAT H0: parameter = 0 | 2-tail p-value | 1-tail p-value |
| (Intercept) | 3580.46697505064 | 84.024248 | 42.6123 | 0 | 0 |
| X | 0.0879589903051959 | 0.026002 | 3.3828 | 0.001454 | 0.000727 |
| M1 | -3363.86695716855 | 109.974273 | -30.5878 | 0 | 0 |
| M2 | -3052.59898369868 | 110.289953 | -27.6779 | 0 | 0 |
| M3 | -2739.25415281523 | 110.714779 | -24.7415 | 0 | 0 |
| M4 | -2542.97232292653 | 110.282907 | -23.0586 | 0 | 0 |
| M5 | -2291.51219027590 | 113.531376 | -20.184 | 0 | 0 |
| M6 | -2063.65837622777 | 119.809846 | -17.2244 | 0 | 0 |
| M7 | -1721.72140851618 | 115.326853 | -14.9291 | 0 | 0 |
| M8 | -1390.73302941988 | 112.778531 | -12.3315 | 0 | 0 |
| M9 | -1051.99640047540 | 111.072832 | -9.4712 | 0 | 0 |
| M10 | -725.289657296368 | 110.471349 | -6.5654 | 0 | 0 |
| M11 | -382.029542527825 | 109.885915 | -3.4766 | 0.001104 | 0.000552 |
| Multiple Linear Regression - Regression Statistics | |
| Multiple R | 0.989585570274023 |
| R-squared | 0.979279600894564 |
| Adjusted R-squared | 0.973989286229346 |
| F-TEST (value) | 185.108006397625 |
| F-TEST (DF numerator) | 12 |
| F-TEST (DF denominator) | 47 |
| p-value | 0 |
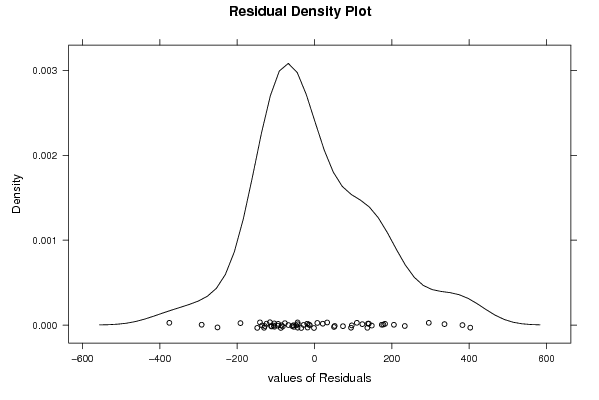
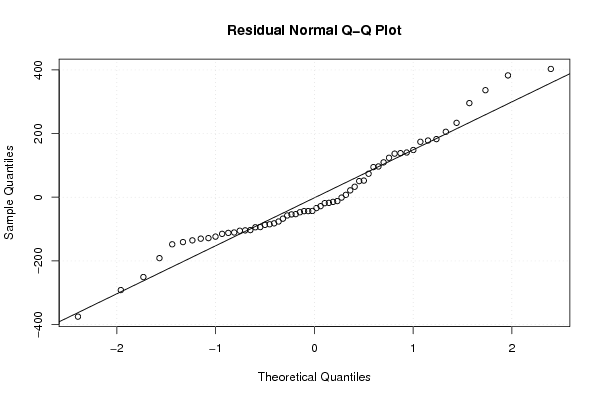
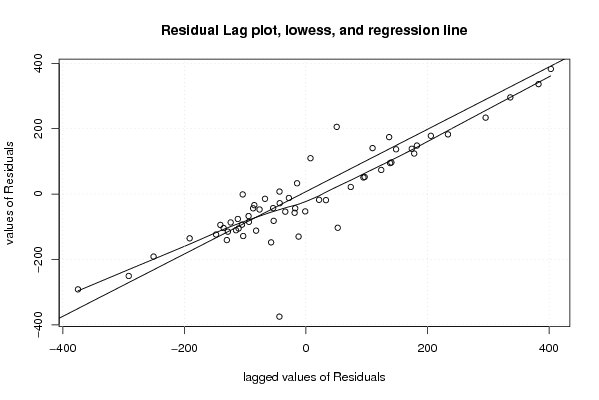
| Multiple Linear Regression - Residual Statistics | |
| Residual Standard Deviation | 173.428308377894 |
| Sum Squared Residuals | 1413636.77290044 |
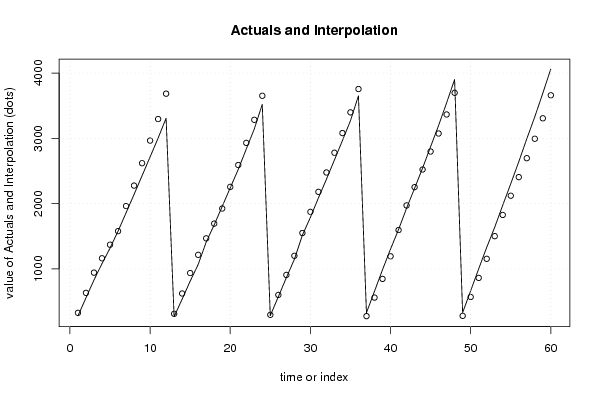
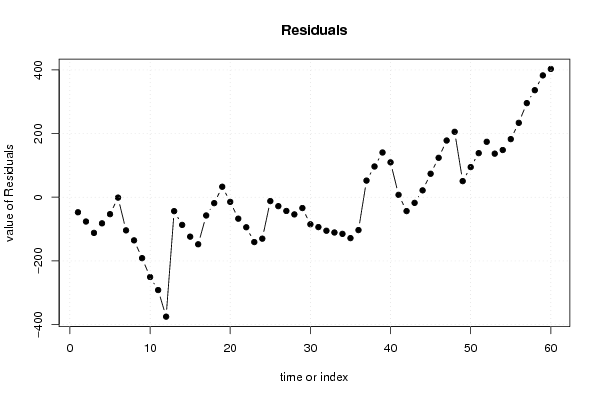
| Multiple Linear Regression - Actuals, Interpolation, and Residuals | |||
| Time or Index | Actuals | Interpolation Forecast | Residuals Prediction Error |
| 1 | 280 | 327.252427686036 | -47.2524276860357 |
| 2 | 557 | 633.330820727895 | -76.3308207278947 |
| 3 | 831 | 943.069333008828 | -112.069333008828 |
| 4 | 1081 | 1163.01213128962 | -82.0121312896247 |
| 5 | 1318 | 1371.1084817198 | -53.1084817198011 |
| 6 | 1578 | 1579.17152294925 | -1.17152294925396 |
| 7 | 1859 | 1963.06492903642 | -104.064929036423 |
| 8 | 2141 | 2276.46151007168 | -135.461510071683 |
| 9 | 2428 | 2619.33221156051 | -191.332211560512 |
| 10 | 2715 | 2965.74176856790 | -250.741768567903 |
| 11 | 3004 | 3295.63211681006 | -291.632116810059 |
| 12 | 3309 | 3684.17062462047 | -375.170624620467 |
| 13 | 269 | 312.651235295365 | -43.6512352953646 |
| 14 | 537 | 623.919208765239 | -86.9192087652394 |
| 15 | 813 | 936.82424469716 | -123.824244697159 |
| 16 | 1068 | 1215.87548446305 | -147.875484463049 |
| 17 | 1411 | 1468.30316600704 | -57.3031660070411 |
| 18 | 1675 | 1693.60616933631 | -18.6061693363131 |
| 19 | 1958 | 1925.06664522458 | 32.9333547754197 |
| 20 | 2242 | 2256.58277826271 | -14.5827782627088 |
| 21 | 2524 | 2591.36125264346 | -67.3612526434598 |
| 22 | 2836 | 2930.38225446522 | -94.3822544652162 |
| 23 | 3143 | 3283.84561210916 | -140.845612109162 |
| 24 | 3522 | 3652.15355214938 | -130.153552149377 |
| 25 | 285 | 297.082494011345 | -12.0824940113451 |
| 26 | 574 | 602.017420179246 | -28.0174201792459 |
| 27 | 865 | 908.149613857665 | -43.1496138576647 |
| 28 | 1147 | 1200.92245611117 | -53.9224561111655 |
| 29 | 1516 | 1550.01706800057 | -34.0170680005679 |
| 30 | 1789 | 1874.01005845227 | -85.0100584522696 |
| 31 | 2087 | 2180.76343004178 | -93.7634300417844 |
| 32 | 2372 | 2477.27188493845 | -105.271884938445 |
| 33 | 2669 | 2779.76940987719 | -110.769409877189 |
| 34 | 2966 | 3081.05600485802 | -115.056004858017 |
| 35 | 3270 | 3398.45617647683 | -128.456176476832 |
| 36 | 3652 | 3755.24148878707 | -103.241488787066 |
| 37 | 329 | 276.676008260540 | 52.3239917394605 |
| 38 | 658 | 561.380366658245 | 96.6196333417547 |
| 39 | 988 | 847.45791054708 | 140.54208945292 |
| 40 | 1303 | 1193.35798294492 | 109.642017055082 |
| 41 | 1603 | 1595.49186598835 | 7.50813401164582 |
| 42 | 1929 | 1972.52412759409 | -43.5241275940891 |
| 43 | 2235 | 2252.71388411143 | -17.7138841114348 |
| 44 | 2544 | 2522.39484696501 | 21.6051530349895 |
| 45 | 2872 | 2798.24079784128 | 73.7592021587195 |
| 46 | 3198 | 3074.10724462391 | 123.892755376094 |
| 47 | 3544 | 3365.82339107360 | 178.176608926396 |
| 48 | 3903 | 3697.45243215655 | 205.547567843448 |
| 49 | 332 | 281.337834746715 | 50.662165253285 |
| 50 | 665 | 570.352183669375 | 94.6478163306251 |
| 51 | 1001 | 862.498897889269 | 138.501102110731 |
| 52 | 1329 | 1154.83194519124 | 174.168054808757 |
| 53 | 1639 | 1502.07941828424 | 136.920581715764 |
| 54 | 1975 | 1826.68812166807 | 148.311878331926 |
| 55 | 2304 | 2121.39111158578 | 182.608888414223 |
| 56 | 2640 | 2406.28897976215 | 233.711020237847 |
| 57 | 2992 | 2696.29632807756 | 295.703671922442 |
| 58 | 3330 | 2993.71272748496 | 336.287272515043 |
| 59 | 3690 | 3307.24270353034 | 382.757296469656 |
| 60 | 4063 | 3659.98190228654 | 403.018097713461 |
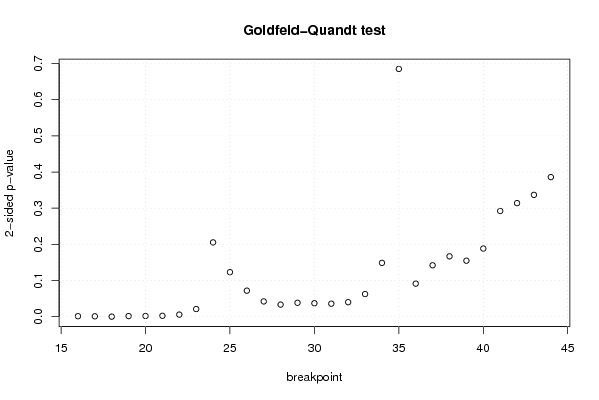
| Goldfeld-Quandt test for Heteroskedasticity | |||
| p-values | Alternative Hypothesis | ||
| breakpoint index | greater | 2-sided | less |
| 16 | 0.000691237451845648 | 0.00138247490369130 | 0.999308762548154 |
| 17 | 0.000534159291129249 | 0.00106831858225850 | 0.99946584070887 |
| 18 | 6.29723796259271e-05 | 0.000125944759251854 | 0.999937027620374 |
| 19 | 0.000835645735451927 | 0.00167129147090385 | 0.999164354264548 |
| 20 | 0.00102646015224099 | 0.00205292030448197 | 0.99897353984776 |
| 21 | 0.00123935926432910 | 0.00247871852865820 | 0.99876064073567 |
| 22 | 0.00290586007059366 | 0.00581172014118733 | 0.997094139929406 |
| 23 | 0.0105938190795929 | 0.0211876381591858 | 0.989406180920407 |
| 24 | 0.102734680565659 | 0.205469361131317 | 0.897265319434341 |
| 25 | 0.061596910629788 | 0.123193821259576 | 0.938403089370212 |
| 26 | 0.035982915486402 | 0.071965830972804 | 0.964017084513598 |
| 27 | 0.0211380832705190 | 0.0422761665410379 | 0.97886191672948 |
| 28 | 0.0167281591123491 | 0.0334563182246982 | 0.98327184088765 |
| 29 | 0.0192556506932093 | 0.0385113013864186 | 0.98074434930679 |
| 30 | 0.0186140516727357 | 0.0372281033454714 | 0.981385948327264 |
| 31 | 0.0179607369253205 | 0.0359214738506410 | 0.98203926307468 |
| 32 | 0.0200589111066934 | 0.0401178222133867 | 0.979941088893307 |
| 33 | 0.0313340386381979 | 0.0626680772763958 | 0.968665961361802 |
| 34 | 0.0744344726366698 | 0.148868945273340 | 0.92556552736333 |
| 35 | 0.342573110310403 | 0.685146220620805 | 0.657426889689597 |
| 36 | 0.95424628746962 | 0.0915074250607585 | 0.0457537125303792 |
| 37 | 0.928900269434735 | 0.142199461130530 | 0.0710997305652651 |
| 38 | 0.916509331813383 | 0.166981336373235 | 0.0834906681866174 |
| 39 | 0.922567163833026 | 0.154865672333949 | 0.0774328361669743 |
| 40 | 0.905770296930453 | 0.188459406139095 | 0.0942297030695473 |
| 41 | 0.853847370026087 | 0.292305259947826 | 0.146152629973913 |
| 42 | 0.842956609685492 | 0.314086780629017 | 0.157043390314508 |
| 43 | 0.831563952040514 | 0.336872095918972 | 0.168436047959486 |
| 44 | 0.806960183101005 | 0.38607963379799 | 0.193039816898995 |
| Meta Analysis of Goldfeld-Quandt test for Heteroskedasticity | |||
| Description | # significant tests | % significant tests | OK/NOK |
| 1% type I error level | 7 | 0.241379310344828 | NOK |
| 5% type I error level | 14 | 0.482758620689655 | NOK |
| 10% type I error level | 17 | 0.586206896551724 | NOK |