| Multiple Linear Regression - Estimated Regression Equation |
| WLVrouw[t] = + 0.757256418655039 + 1.14003880168309WLMan[t] + e[t] |
| Multiple Linear Regression - Ordinary Least Squares | |||||
| Variable | Parameter | S.D. | T-STAT H0: parameter = 0 | 2-tail p-value | 1-tail p-value |
| (Intercept) | 0.757256418655039 | 0.877241 | 0.8632 | 0.391569 | 0.195785 |
| WLMan | 1.14003880168309 | 0.122392 | 9.3147 | 0 | 0 |
| Multiple Linear Regression - Regression Statistics | |
| Multiple R | 0.77417457022882 |
| R-squared | 0.599346265188978 |
| Adjusted R-squared | 0.592438442174995 |
| F-TEST (value) | 86.7634078023935 |
| F-TEST (DF numerator) | 1 |
| F-TEST (DF denominator) | 58 |
| p-value | 4.02788913334007e-13 |
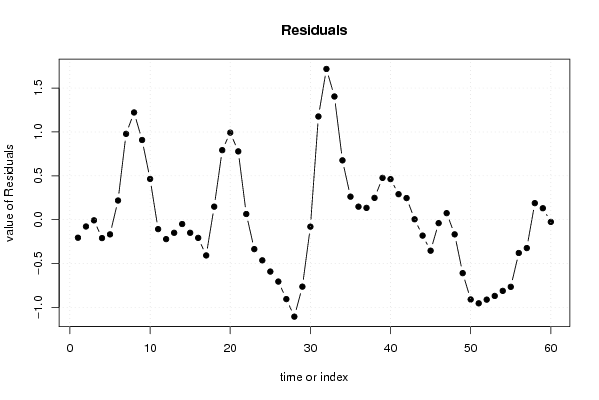
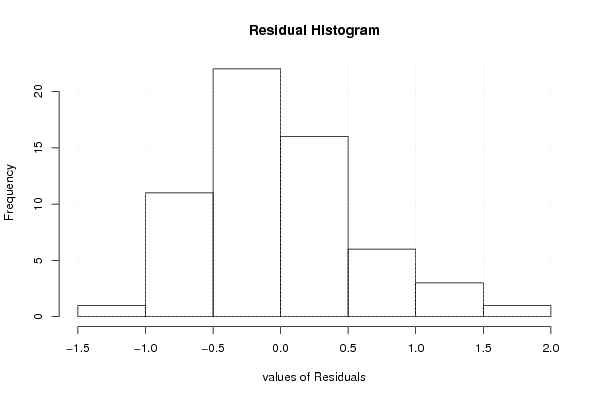
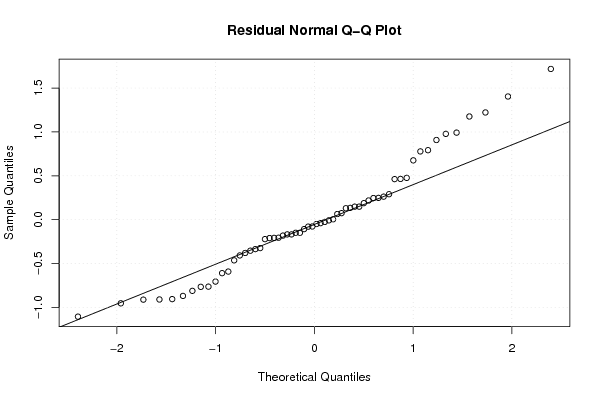
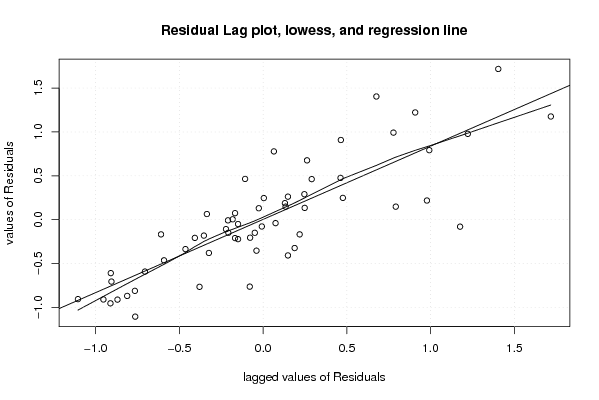
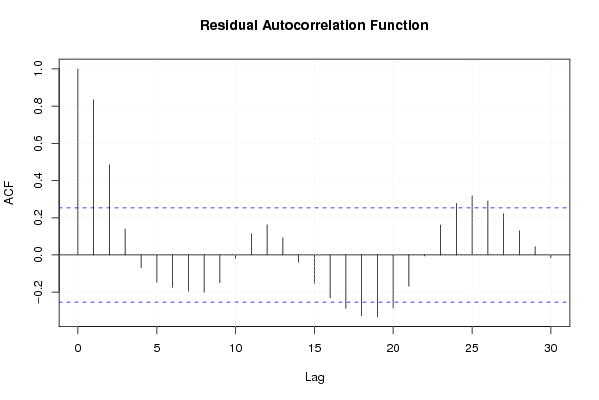
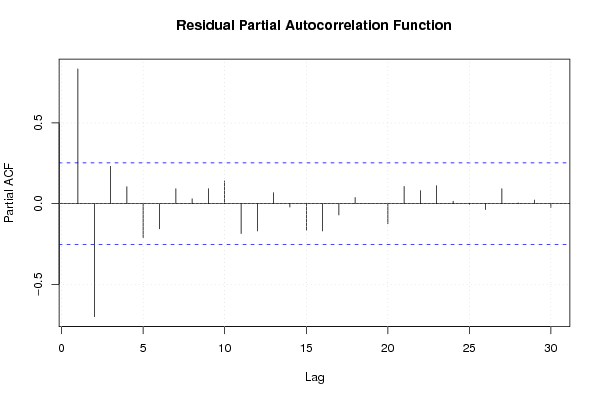
| Multiple Linear Regression - Residual Statistics | |
| Residual Standard Deviation | 0.629565297392559 |
| Sum Squared Residuals | 22.9884428934969 |
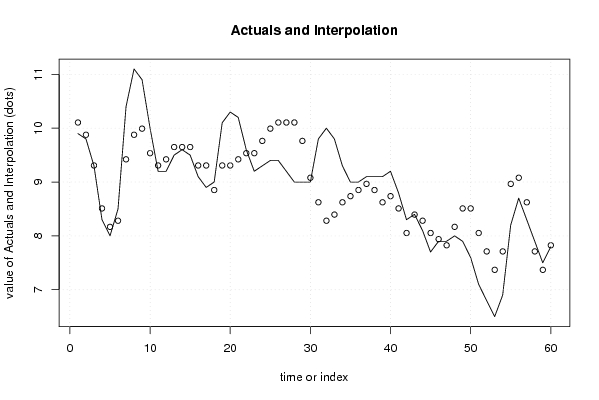
| Multiple Linear Regression - Actuals, Interpolation, and Residuals | |||
| Time or Index | Actuals | Interpolation Forecast | Residuals Prediction Error |
| 1 | 9.9 | 10.1055745924563 | -0.205574592456331 |
| 2 | 9.8 | 9.87756683211973 | -0.0775668321197314 |
| 3 | 9.3 | 9.30754743127819 | -0.00754743127818791 |
| 4 | 8.3 | 8.50952027010003 | -0.209520270100027 |
| 5 | 8 | 8.1675086295951 | -0.167508629595102 |
| 6 | 8.5 | 8.28151250976341 | 0.21848749023659 |
| 7 | 10.4 | 9.4215513114465 | 0.978448688553503 |
| 8 | 11.1 | 9.87756683211973 | 1.22243316788027 |
| 9 | 10.9 | 9.99157071228804 | 0.90842928771196 |
| 10 | 10 | 9.5355551916148 | 0.464444808385194 |
| 11 | 9.2 | 9.30754743127819 | -0.107547431278189 |
| 12 | 9.2 | 9.4215513114465 | -0.221551311446498 |
| 13 | 9.5 | 9.64955907178311 | -0.149559071783114 |
| 14 | 9.6 | 9.64955907178311 | -0.0495590717831148 |
| 15 | 9.5 | 9.64955907178311 | -0.149559071783114 |
| 16 | 9.1 | 9.30754743127819 | -0.207547431278189 |
| 17 | 8.9 | 9.30754743127819 | -0.407547431278188 |
| 18 | 9 | 8.85153191060495 | 0.148468089395046 |
| 19 | 10.1 | 9.30754743127819 | 0.79245256872181 |
| 20 | 10.3 | 9.30754743127819 | 0.992452568721812 |
| 21 | 10.2 | 9.4215513114465 | 0.778448688553502 |
| 22 | 9.6 | 9.5355551916148 | 0.0644448083851935 |
| 23 | 9.2 | 9.5355551916148 | -0.335555191614807 |
| 24 | 9.3 | 9.76356295195142 | -0.463562951951423 |
| 25 | 9.4 | 9.99157071228804 | -0.59157071228804 |
| 26 | 9.4 | 10.1055745924563 | -0.705574592456348 |
| 27 | 9.2 | 10.1055745924563 | -0.90557459245635 |
| 28 | 9 | 10.1055745924563 | -1.10557459245635 |
| 29 | 9 | 9.76356295195142 | -0.763562951951424 |
| 30 | 9 | 9.07953967094157 | -0.079539670941571 |
| 31 | 9.8 | 8.62352415026834 | 1.17647584973166 |
| 32 | 10 | 8.28151250976341 | 1.71848749023659 |
| 33 | 9.8 | 8.39551638993172 | 1.40448361006828 |
| 34 | 9.3 | 8.62352415026834 | 0.676475849731664 |
| 35 | 9 | 8.73752803043664 | 0.262471969563355 |
| 36 | 9 | 8.85153191060495 | 0.148468089395046 |
| 37 | 9.1 | 8.96553579077326 | 0.134464209226737 |
| 38 | 9.1 | 8.85153191060495 | 0.248468089395046 |
| 39 | 9.1 | 8.62352415026834 | 0.476475849731663 |
| 40 | 9.2 | 8.73752803043664 | 0.462471969563354 |
| 41 | 8.8 | 8.50952027010003 | 0.290479729899973 |
| 42 | 8.3 | 8.0535047494268 | 0.246495250573207 |
| 43 | 8.4 | 8.39551638993172 | 0.00448361006828094 |
| 44 | 8.1 | 8.28151250976341 | -0.181512509763411 |
| 45 | 7.7 | 8.0535047494268 | -0.353504749426793 |
| 46 | 7.9 | 7.93950086925848 | -0.0395008692584838 |
| 47 | 7.9 | 7.82549698909018 | 0.0745030109098244 |
| 48 | 8 | 8.1675086295951 | -0.167508629595102 |
| 49 | 7.9 | 8.50952027010003 | -0.609520270100027 |
| 50 | 7.6 | 8.50952027010003 | -0.909520270100028 |
| 51 | 7.1 | 8.0535047494268 | -0.953504749426794 |
| 52 | 6.8 | 7.71149310892187 | -0.911493108921867 |
| 53 | 6.5 | 7.36948146841694 | -0.869481468416941 |
| 54 | 6.9 | 7.71149310892187 | -0.811493108921866 |
| 55 | 8.2 | 8.96553579077326 | -0.765535790773264 |
| 56 | 8.7 | 9.07953967094157 | -0.379539670941572 |
| 57 | 8.3 | 8.62352415026834 | -0.323524150268336 |
| 58 | 7.9 | 7.71149310892187 | 0.188506891078134 |
| 59 | 7.5 | 7.36948146841694 | 0.130518531583059 |
| 60 | 7.8 | 7.82549698909018 | -0.0254969890901761 |
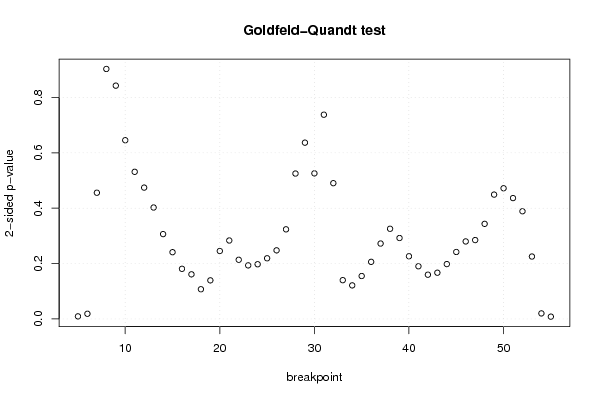
| Goldfeld-Quandt test for Heteroskedasticity | |||
| p-values | Alternative Hypothesis | ||
| breakpoint index | greater | 2-sided | less |
| 5 | 0.00465075781167010 | 0.00930151562334021 | 0.99534924218833 |
| 6 | 0.00934018358019272 | 0.0186803671603854 | 0.990659816419807 |
| 7 | 0.227955057512367 | 0.455910115024733 | 0.772044942487633 |
| 8 | 0.451528593939032 | 0.903057187878063 | 0.548471406060968 |
| 9 | 0.421348306970608 | 0.842696613941215 | 0.578651693029392 |
| 10 | 0.322823651906066 | 0.645647303812131 | 0.677176348093934 |
| 11 | 0.265738467150519 | 0.531476934301039 | 0.73426153284948 |
| 12 | 0.237202810385708 | 0.474405620771416 | 0.762797189614292 |
| 13 | 0.201256647477508 | 0.402513294955016 | 0.798743352522492 |
| 14 | 0.153235029908178 | 0.306470059816356 | 0.846764970091822 |
| 15 | 0.120542127868378 | 0.241084255736756 | 0.879457872131622 |
| 16 | 0.0905155242451258 | 0.181031048490252 | 0.909484475754874 |
| 17 | 0.0805809465452186 | 0.161161893090437 | 0.919419053454781 |
| 18 | 0.0536239253888581 | 0.107247850777716 | 0.946376074611142 |
| 19 | 0.0696635411743914 | 0.139327082348783 | 0.930336458825609 |
| 20 | 0.122690387975791 | 0.245380775951583 | 0.877309612024209 |
| 21 | 0.141688378327632 | 0.283376756655263 | 0.858311621672368 |
| 22 | 0.106812980350975 | 0.213625960701951 | 0.893187019649025 |
| 23 | 0.096726565846077 | 0.193453131692154 | 0.903273434153923 |
| 24 | 0.0987577979707936 | 0.197515595941587 | 0.901242202029206 |
| 25 | 0.109542620716524 | 0.219085241433048 | 0.890457379283476 |
| 26 | 0.123911390308241 | 0.247822780616482 | 0.87608860969176 |
| 27 | 0.161854973477761 | 0.323709946955521 | 0.83814502652224 |
| 28 | 0.262598967517865 | 0.525197935035730 | 0.737401032482135 |
| 29 | 0.318393635278371 | 0.636787270556742 | 0.681606364721629 |
| 30 | 0.262921995754271 | 0.525843991508543 | 0.737078004245729 |
| 31 | 0.368879306084432 | 0.737758612168863 | 0.631120693915568 |
| 32 | 0.754791057724568 | 0.490417884550864 | 0.245208942275432 |
| 33 | 0.92997451733204 | 0.140050965335919 | 0.0700254826679595 |
| 34 | 0.93938529028265 | 0.121229419434701 | 0.0606147097173503 |
| 35 | 0.922490953850443 | 0.155018092299115 | 0.0775090461495574 |
| 36 | 0.896870423859167 | 0.206259152281666 | 0.103129576140833 |
| 37 | 0.86383488688215 | 0.2723302262357 | 0.13616511311785 |
| 38 | 0.83716579205301 | 0.32566841589398 | 0.16283420794699 |
| 39 | 0.853853971577844 | 0.292292056844313 | 0.146146028422156 |
| 40 | 0.886803720660501 | 0.226392558678997 | 0.113196279339499 |
| 41 | 0.904885857040587 | 0.190228285918827 | 0.0951141429594134 |
| 42 | 0.920120381820176 | 0.159759236359649 | 0.0798796181798243 |
| 43 | 0.91653495313061 | 0.166930093738778 | 0.0834650468693892 |
| 44 | 0.90093467111299 | 0.198130657774022 | 0.0990653288870108 |
| 45 | 0.879042385654834 | 0.241915228690332 | 0.120957614345166 |
| 46 | 0.86003950230578 | 0.27992099538844 | 0.13996049769422 |
| 47 | 0.857546217310632 | 0.284907565378736 | 0.142453782689368 |
| 48 | 0.828250930407895 | 0.34349813918421 | 0.171749069592105 |
| 49 | 0.775426438267226 | 0.449147123465547 | 0.224573561732773 |
| 50 | 0.763966309419469 | 0.472067381161062 | 0.236033690580531 |
| 51 | 0.781694144013219 | 0.436611711973562 | 0.218305855986781 |
| 52 | 0.805517984251325 | 0.38896403149735 | 0.194482015748675 |
| 53 | 0.887291866079329 | 0.225416267841343 | 0.112708133920672 |
| 54 | 0.989987915539383 | 0.0200241689212336 | 0.0100120844606168 |
| 55 | 0.99588512034877 | 0.00822975930246136 | 0.00411487965123068 |
| Meta Analysis of Goldfeld-Quandt test for Heteroskedasticity | |||
| Description | # significant tests | % significant tests | OK/NOK |
| 1% type I error level | 2 | 0.0392156862745098 | NOK |
| 5% type I error level | 4 | 0.0784313725490196 | NOK |
| 10% type I error level | 4 | 0.0784313725490196 | OK |