| Multiple Linear Regression - Estimated Regression Equation |
| Y[t] = + 6.08577545459943 + 0.0937233198980662X[t] + 0.353117280750058Y1[t] + 0.297388312914167Y2[t] + 0.390002938543844Y3[t] -0.412813823279897Y4[t] + 1.32708847505859M1[t] -0.690848167073465M2[t] -2.44667437247958M3[t] -1.21771370872316M4[t] -0.853217792826271M5[t] + 1.39824803727689M6[t] -1.35047284337896M7[t] -1.46577081148973M8[t] -0.108516967765969M9[t] -1.34277021223409M10[t] -2.37859652074837M11[t] + 0.0403527438512034t + e[t] |
| Multiple Linear Regression - Ordinary Least Squares | |||||
| Variable | Parameter | S.D. | T-STAT H0: parameter = 0 | 2-tail p-value | 1-tail p-value |
| (Intercept) | 6.08577545459943 | 1.845808 | 3.2971 | 0.001784 | 0.000892 |
| X | 0.0937233198980662 | 0.038234 | 2.4513 | 0.017699 | 0.00885 |
| Y1 | 0.353117280750058 | 0.133995 | 2.6353 | 0.011107 | 0.005554 |
| Y2 | 0.297388312914167 | 0.131808 | 2.2562 | 0.028373 | 0.014186 |
| Y3 | 0.390002938543844 | 0.124509 | 3.1323 | 0.002872 | 0.001436 |
| Y4 | -0.412813823279897 | 0.137136 | -3.0102 | 0.004052 | 0.002026 |
| M1 | 1.32708847505859 | 0.762706 | 1.74 | 0.087895 | 0.043948 |
| M2 | -0.690848167073465 | 0.889778 | -0.7764 | 0.441083 | 0.220541 |
| M3 | -2.44667437247958 | 0.790693 | -3.0943 | 0.003199 | 0.001599 |
| M4 | -1.21771370872316 | 0.641573 | -1.898 | 0.063361 | 0.03168 |
| M5 | -0.853217792826271 | 0.656872 | -1.2989 | 0.199817 | 0.099909 |
| M6 | 1.39824803727689 | 0.673195 | 2.077 | 0.042854 | 0.021427 |
| M7 | -1.35047284337896 | 0.809549 | -1.6682 | 0.101409 | 0.050705 |
| M8 | -1.46577081148973 | 0.797244 | -1.8385 | 0.071808 | 0.035904 |
| M9 | -0.108516967765969 | 0.639952 | -0.1696 | 0.866019 | 0.433009 |
| M10 | -1.34277021223409 | 0.78138 | -1.7185 | 0.091779 | 0.045889 |
| M11 | -2.37859652074837 | 0.742783 | -3.2023 | 0.00235 | 0.001175 |
| t | 0.0403527438512034 | 0.017783 | 2.2692 | 0.027519 | 0.013759 |
| Multiple Linear Regression - Regression Statistics | |
| Multiple R | 0.940286933379321 |
| R-squared | 0.884139517083888 |
| Adjusted R-squared | 0.84551935611185 |
| F-TEST (value) | 22.8932115980574 |
| F-TEST (DF numerator) | 17 |
| F-TEST (DF denominator) | 51 |
| p-value | 0 |
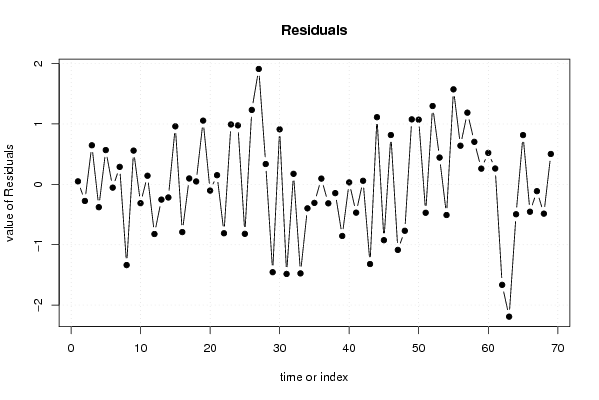
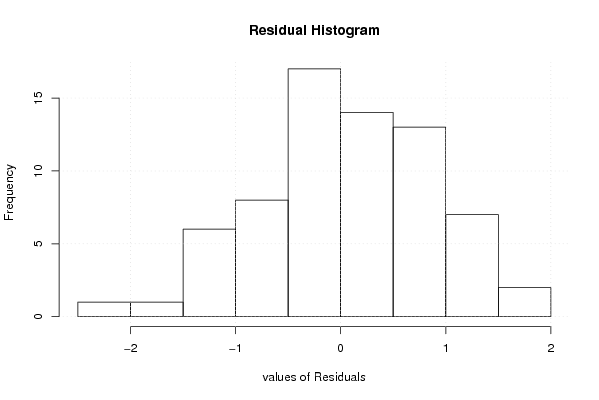
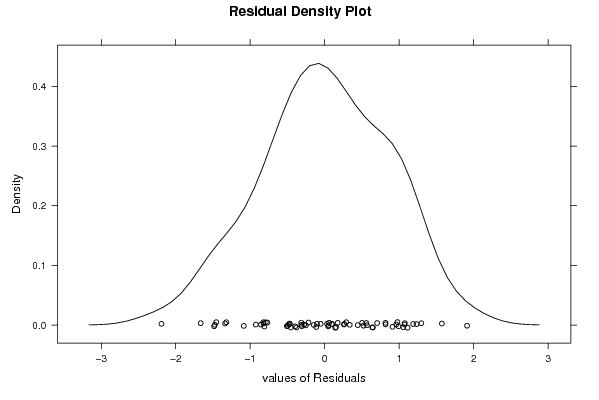
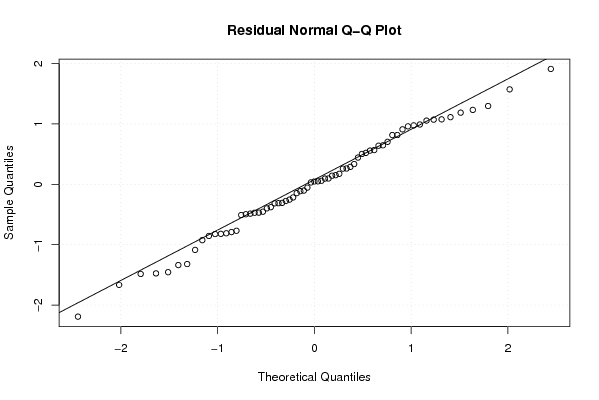
| Multiple Linear Regression - Residual Statistics | |
| Residual Standard Deviation | 0.983511283994648 |
| Sum Squared Residuals | 49.3320167329849 |
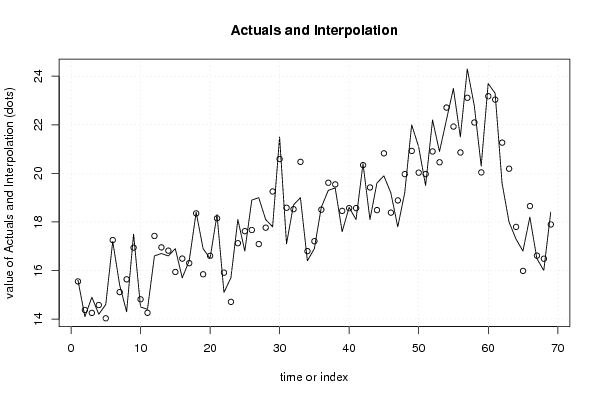
| Multiple Linear Regression - Actuals, Interpolation, and Residuals | |||
| Time or Index | Actuals | Interpolation Forecast | Residuals Prediction Error |
| 1 | 15.6 | 15.550733275906 | 0.049266724093985 |
| 2 | 14.1 | 14.3754354138896 | -0.275435413889626 |
| 3 | 14.9 | 14.2536523793177 | 0.646347620682323 |
| 4 | 14.2 | 14.5785487659034 | -0.378548765903390 |
| 5 | 14.6 | 14.0325417403010 | 0.567458259699044 |
| 6 | 17.2 | 17.254264817199 | -0.0542648171989887 |
| 7 | 15.4 | 15.1109164677628 | 0.289083532237153 |
| 8 | 14.3 | 15.6372852674231 | -1.33728526742308 |
| 9 | 17.5 | 16.9413013298499 | 0.558698670150091 |
| 10 | 14.5 | 14.8124170814802 | -0.312417081480165 |
| 11 | 14.4 | 14.257604225143 | 0.142395774856993 |
| 12 | 16.6 | 17.4230644359038 | -0.82306443590384 |
| 13 | 16.7 | 16.9528884711471 | -0.252888471147079 |
| 14 | 16.6 | 16.8174501053887 | -0.217450105388667 |
| 15 | 16.9 | 15.9394576022358 | 0.960542397764226 |
| 16 | 15.7 | 16.4907559013341 | -0.790755901334058 |
| 17 | 16.4 | 16.3027243340676 | 0.0972756659323625 |
| 18 | 18.4 | 18.3525990012572 | 0.0474009987428246 |
| 19 | 16.9 | 15.8449492558885 | 1.0550507441115 |
| 20 | 16.5 | 16.6034833812487 | -0.103483381248741 |
| 21 | 18.3 | 18.1484774196792 | 0.151522580320833 |
| 22 | 15.1 | 15.9106433330342 | -0.810643333034218 |
| 23 | 15.7 | 14.7087343368003 | 0.991265663199682 |
| 24 | 18.1 | 17.1238295393582 | 0.976170460641827 |
| 25 | 16.8 | 17.6198342544706 | -0.81983425447056 |
| 26 | 18.9 | 17.6674994755962 | 1.23250052440384 |
| 27 | 19 | 17.0890095752633 | 1.91099042473669 |
| 28 | 18.1 | 17.7640738038219 | 0.335926196178095 |
| 29 | 17.8 | 19.2552645473719 | -1.45526454737192 |
| 30 | 21.5 | 20.5892703521801 | 0.910729647819914 |
| 31 | 17.1 | 18.5840953173915 | -1.48409531739147 |
| 32 | 18.7 | 18.5258660107684 | 0.174133989231630 |
| 33 | 19 | 20.4750090626129 | -1.47500906261290 |
| 34 | 16.4 | 16.7975152789615 | -0.397515278961452 |
| 35 | 16.9 | 17.2073474985484 | -0.307347498548432 |
| 36 | 18.6 | 18.5048892182411 | 0.0951107817588718 |
| 37 | 19.3 | 19.6146848315424 | -0.314684831542436 |
| 38 | 19.4 | 19.5456925876627 | -0.145692587662684 |
| 39 | 17.6 | 18.4553221011888 | -0.855322101188823 |
| 40 | 18.6 | 18.5681414762751 | 0.0318585237248646 |
| 41 | 18.1 | 18.5689560670557 | -0.468956067055667 |
| 42 | 20.4 | 20.3414132937301 | 0.0585867062698637 |
| 43 | 18.1 | 19.4202162346514 | -1.32021623465139 |
| 44 | 19.6 | 18.4874387759500 | 1.11256122405004 |
| 45 | 19.9 | 20.8247695032484 | -0.924769503248421 |
| 46 | 19.2 | 18.3832697639822 | 0.816730236017805 |
| 47 | 17.8 | 18.8861471138953 | -1.08614711389535 |
| 48 | 19.2 | 19.9691278651909 | -0.769127865190936 |
| 49 | 22 | 20.9240201152083 | 1.07597988479175 |
| 50 | 21.1 | 20.0288674795133 | 1.07113252048670 |
| 51 | 19.5 | 19.9709638719758 | -0.470963871975847 |
| 52 | 22.2 | 20.9029643601119 | 1.29703563988808 |
| 53 | 20.9 | 20.4566013351557 | 0.443398664844337 |
| 54 | 22.2 | 22.7086309804277 | -0.508630980427662 |
| 55 | 23.5 | 21.926805532973 | 1.57319446702701 |
| 56 | 21.5 | 20.8603528017486 | 0.639647198251358 |
| 57 | 24.3 | 23.1132040728401 | 1.18679592715994 |
| 58 | 22.8 | 22.0961545425420 | 0.70384545745803 |
| 59 | 20.3 | 20.0401668256129 | 0.259833174387105 |
| 60 | 23.7 | 23.1790889413059 | 0.520911058694078 |
| 61 | 23.3 | 23.0378390517257 | 0.262160948274342 |
| 62 | 19.6 | 21.2650549379496 | -1.66505493794956 |
| 63 | 18 | 20.1915944700186 | -2.19159447001858 |
| 64 | 17.3 | 17.7955156925536 | -0.49551569255359 |
| 65 | 16.8 | 15.9839119760482 | 0.816088023951838 |
| 66 | 18.2 | 18.6538215552059 | -0.453821555205949 |
| 67 | 16.5 | 16.6130171913328 | -0.113017191332803 |
| 68 | 16 | 16.4855737628612 | -0.485573762861198 |
| 69 | 18.4 | 17.8972386117695 | 0.502761388230456 |
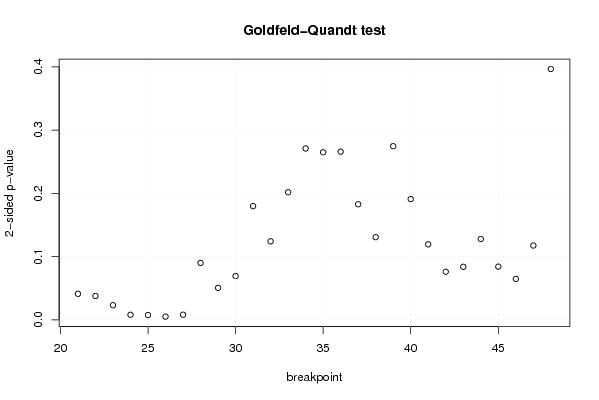
| Goldfeld-Quandt test for Heteroskedasticity | |||
| p-values | Alternative Hypothesis | ||
| breakpoint index | greater | 2-sided | less |
| 21 | 0.0205545532715187 | 0.0411091065430375 | 0.979445446728481 |
| 22 | 0.0188525825624731 | 0.0377051651249463 | 0.981147417437527 |
| 23 | 0.0115296806927879 | 0.0230593613855759 | 0.988470319307212 |
| 24 | 0.00397383561800473 | 0.00794767123600946 | 0.996026164381995 |
| 25 | 0.00373476083644249 | 0.00746952167288498 | 0.996265239163558 |
| 26 | 0.00248530267255816 | 0.00497060534511631 | 0.997514697327442 |
| 27 | 0.00402869863864868 | 0.00805739727729735 | 0.995971301361351 |
| 28 | 0.0449732337856437 | 0.0899464675712875 | 0.955026766214356 |
| 29 | 0.0252428348537729 | 0.0504856697075458 | 0.974757165146227 |
| 30 | 0.0346128421232181 | 0.0692256842464362 | 0.965387157876782 |
| 31 | 0.0898724820973575 | 0.179744964194715 | 0.910127517902642 |
| 32 | 0.0620669644663609 | 0.124133928932722 | 0.93793303553364 |
| 33 | 0.100849822652059 | 0.201699645304119 | 0.89915017734794 |
| 34 | 0.135540760485540 | 0.271081520971079 | 0.86445923951446 |
| 35 | 0.132485614292485 | 0.264971228584969 | 0.867514385707515 |
| 36 | 0.132970729020964 | 0.265941458041928 | 0.867029270979036 |
| 37 | 0.0913660894561851 | 0.182732178912370 | 0.908633910543815 |
| 38 | 0.0653520186624892 | 0.130704037324978 | 0.934647981337511 |
| 39 | 0.137286602871377 | 0.274573205742753 | 0.862713397128623 |
| 40 | 0.0954483498774054 | 0.190896699754811 | 0.904551650122595 |
| 41 | 0.0596748486197279 | 0.119349697239456 | 0.940325151380272 |
| 42 | 0.0379651767714782 | 0.0759303535429564 | 0.962034823228522 |
| 43 | 0.0419086275906883 | 0.0838172551813766 | 0.958091372409312 |
| 44 | 0.0639365680816004 | 0.127873136163201 | 0.9360634319184 |
| 45 | 0.0420249522836188 | 0.0840499045672376 | 0.957975047716381 |
| 46 | 0.032346635587291 | 0.064693271174582 | 0.967653364412709 |
| 47 | 0.0587358336450867 | 0.117471667290173 | 0.941264166354913 |
| 48 | 0.198406603688857 | 0.396813207377714 | 0.801593396311143 |
| Meta Analysis of Goldfeld-Quandt test for Heteroskedasticity | |||
| Description | # significant tests | % significant tests | OK/NOK |
| 1% type I error level | 4 | 0.142857142857143 | NOK |
| 5% type I error level | 7 | 0.25 | NOK |
| 10% type I error level | 14 | 0.5 | NOK |