| Multiple Linear Regression - Estimated Regression Equation |
| TotaleIndustrieleProductie[t] = + 105.371428571429 -2.79365079365078X[t] + e[t] |
| Multiple Linear Regression - Ordinary Least Squares | |||||
| Variable | Parameter | S.D. | T-STAT H0: parameter = 0 | 2-tail p-value | 1-tail p-value |
| (Intercept) | 105.371428571429 | 1.48447 | 70.9825 | 0 | 0 |
| X | -2.79365079365078 | 2.71026 | -1.0308 | 0.306929 | 0.153464 |
| Multiple Linear Regression - Regression Statistics | |
| Multiple R | 0.134123649770878 |
| R-squared | 0.0179891534278611 |
| Adjusted R-squared | 0.00105793193523807 |
| F-TEST (value) | 1.06248408809128 |
| F-TEST (DF numerator) | 1 |
| F-TEST (DF denominator) | 58 |
| p-value | 0.306928587854473 |
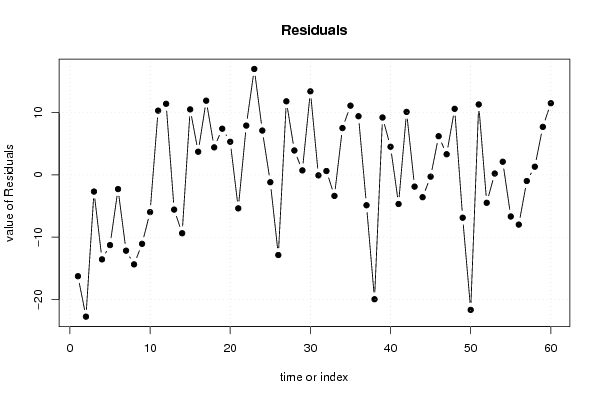
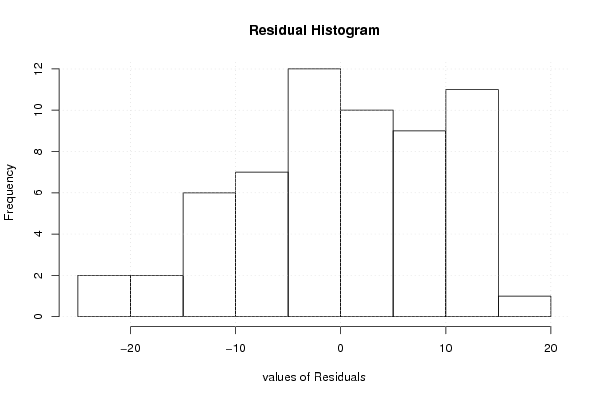
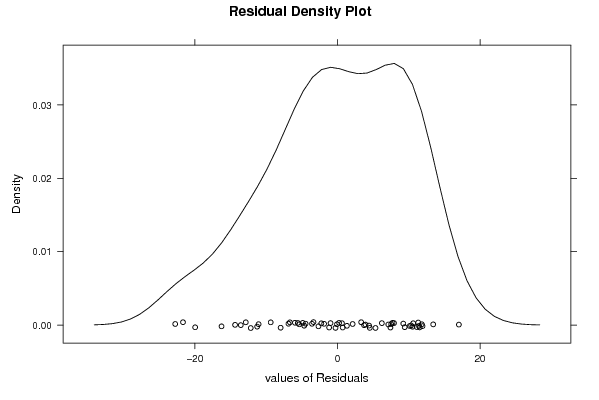
| Multiple Linear Regression - Residual Statistics | |
| Residual Standard Deviation | 9.6204674284218 |
| Sum Squared Residuals | 5368.09682539684 |
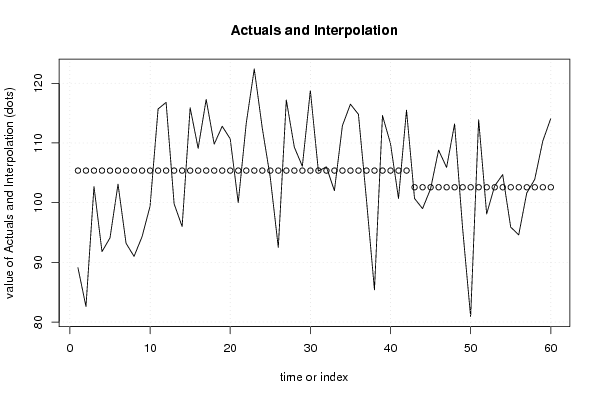
| Multiple Linear Regression - Actuals, Interpolation, and Residuals | |||
| Time or Index | Actuals | Interpolation Forecast | Residuals Prediction Error |
| 1 | 89.1 | 105.371428571429 | -16.2714285714289 |
| 2 | 82.6 | 105.371428571429 | -22.7714285714286 |
| 3 | 102.7 | 105.371428571429 | -2.67142857142856 |
| 4 | 91.8 | 105.371428571429 | -13.5714285714286 |
| 5 | 94.1 | 105.371428571429 | -11.2714285714286 |
| 6 | 103.1 | 105.371428571429 | -2.27142857142857 |
| 7 | 93.2 | 105.371428571429 | -12.1714285714286 |
| 8 | 91 | 105.371428571429 | -14.3714285714286 |
| 9 | 94.3 | 105.371428571429 | -11.0714285714286 |
| 10 | 99.4 | 105.371428571429 | -5.97142857142856 |
| 11 | 115.7 | 105.371428571429 | 10.3285714285714 |
| 12 | 116.8 | 105.371428571429 | 11.4285714285714 |
| 13 | 99.8 | 105.371428571429 | -5.57142857142856 |
| 14 | 96 | 105.371428571429 | -9.37142857142856 |
| 15 | 115.9 | 105.371428571429 | 10.5285714285714 |
| 16 | 109.1 | 105.371428571429 | 3.72857142857143 |
| 17 | 117.3 | 105.371428571429 | 11.9285714285714 |
| 18 | 109.8 | 105.371428571429 | 4.42857142857144 |
| 19 | 112.8 | 105.371428571429 | 7.42857142857144 |
| 20 | 110.7 | 105.371428571429 | 5.32857142857144 |
| 21 | 100 | 105.371428571429 | -5.37142857142856 |
| 22 | 113.3 | 105.371428571429 | 7.92857142857144 |
| 23 | 122.4 | 105.371428571429 | 17.0285714285714 |
| 24 | 112.5 | 105.371428571429 | 7.12857142857144 |
| 25 | 104.2 | 105.371428571429 | -1.17142857142856 |
| 26 | 92.5 | 105.371428571429 | -12.8714285714286 |
| 27 | 117.2 | 105.371428571429 | 11.8285714285714 |
| 28 | 109.3 | 105.371428571429 | 3.92857142857144 |
| 29 | 106.1 | 105.371428571429 | 0.728571428571433 |
| 30 | 118.8 | 105.371428571429 | 13.4285714285714 |
| 31 | 105.3 | 105.371428571429 | -0.0714285714285638 |
| 32 | 106 | 105.371428571429 | 0.628571428571439 |
| 33 | 102 | 105.371428571429 | -3.37142857142856 |
| 34 | 112.9 | 105.371428571429 | 7.52857142857144 |
| 35 | 116.5 | 105.371428571429 | 11.1285714285714 |
| 36 | 114.8 | 105.371428571429 | 9.42857142857144 |
| 37 | 100.5 | 105.371428571429 | -4.87142857142856 |
| 38 | 85.4 | 105.371428571429 | -19.9714285714286 |
| 39 | 114.6 | 105.371428571429 | 9.22857142857143 |
| 40 | 109.9 | 105.371428571429 | 4.52857142857144 |
| 41 | 100.7 | 105.371428571429 | -4.67142857142856 |
| 42 | 115.5 | 105.371428571429 | 10.1285714285714 |
| 43 | 100.7 | 102.577777777778 | -1.87777777777777 |
| 44 | 99 | 102.577777777778 | -3.57777777777778 |
| 45 | 102.3 | 102.577777777778 | -0.277777777777781 |
| 46 | 108.8 | 102.577777777778 | 6.22222222222222 |
| 47 | 105.9 | 102.577777777778 | 3.32222222222223 |
| 48 | 113.2 | 102.577777777778 | 10.6222222222222 |
| 49 | 95.7 | 102.577777777778 | -6.87777777777777 |
| 50 | 80.9 | 102.577777777778 | -21.6777777777778 |
| 51 | 113.9 | 102.577777777778 | 11.3222222222222 |
| 52 | 98.1 | 102.577777777778 | -4.47777777777778 |
| 53 | 102.8 | 102.577777777778 | 0.222222222222219 |
| 54 | 104.7 | 102.577777777778 | 2.12222222222222 |
| 55 | 95.9 | 102.577777777778 | -6.67777777777777 |
| 56 | 94.6 | 102.577777777778 | -7.97777777777778 |
| 57 | 101.6 | 102.577777777778 | -0.977777777777784 |
| 58 | 103.9 | 102.577777777778 | 1.32222222222223 |
| 59 | 110.3 | 102.577777777778 | 7.72222222222222 |
| 60 | 114.1 | 102.577777777778 | 11.5222222222222 |
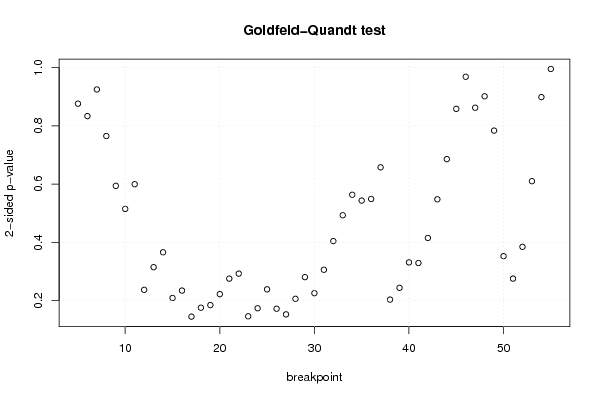
| Goldfeld-Quandt test for Heteroskedasticity | |||
| p-values | Alternative Hypothesis | ||
| breakpoint index | greater | 2-sided | less |
| 5 | 0.561901519407667 | 0.876196961184665 | 0.438098480592333 |
| 6 | 0.58329479627284 | 0.833410407454319 | 0.416705203727159 |
| 7 | 0.462511286580751 | 0.925022573161502 | 0.537488713419249 |
| 8 | 0.382483184937962 | 0.764966369875924 | 0.617516815062038 |
| 9 | 0.296910158257785 | 0.593820316515571 | 0.703089841742214 |
| 10 | 0.257340915368894 | 0.514681830737788 | 0.742659084631106 |
| 11 | 0.700262327422885 | 0.59947534515423 | 0.299737672577115 |
| 12 | 0.881675528934525 | 0.236648942130949 | 0.118324471065475 |
| 13 | 0.84280817105334 | 0.314383657893321 | 0.157191828946661 |
| 14 | 0.817235835526786 | 0.365528328946427 | 0.182764164473214 |
| 15 | 0.895715932514559 | 0.208568134970882 | 0.104284067485441 |
| 16 | 0.882992895688787 | 0.234014208622425 | 0.117007104311213 |
| 17 | 0.927775467034802 | 0.144449065930397 | 0.0722245329651986 |
| 18 | 0.91240573671284 | 0.175188526574319 | 0.0875942632871597 |
| 19 | 0.90792306815967 | 0.18415386368066 | 0.09207693184033 |
| 20 | 0.889083243334919 | 0.221833513330162 | 0.110916756665081 |
| 21 | 0.862498610159961 | 0.275002779680077 | 0.137501389840039 |
| 22 | 0.853847034724158 | 0.292305930551685 | 0.146152965275842 |
| 23 | 0.927179054238842 | 0.145641891522317 | 0.0728209457611584 |
| 24 | 0.913364432384614 | 0.173271135230773 | 0.0866355676153863 |
| 25 | 0.88082699407911 | 0.238346011841779 | 0.119173005920890 |
| 26 | 0.914161686826558 | 0.171676626346884 | 0.085838313173442 |
| 27 | 0.92382460284808 | 0.152350794303841 | 0.0761753971519206 |
| 28 | 0.897076595901155 | 0.20584680819769 | 0.102923404098845 |
| 29 | 0.859855672057919 | 0.280288655884162 | 0.140144327942081 |
| 30 | 0.88745711595181 | 0.225085768096379 | 0.112542884048190 |
| 31 | 0.847213192452242 | 0.305573615095516 | 0.152786807547758 |
| 32 | 0.797974616820931 | 0.404050766358138 | 0.202025383179069 |
| 33 | 0.753537894513923 | 0.492924210972154 | 0.246462105486077 |
| 34 | 0.718415276179155 | 0.563169447641691 | 0.281584723820845 |
| 35 | 0.728400153582833 | 0.543199692834334 | 0.271599846417167 |
| 36 | 0.725593477356854 | 0.548813045286292 | 0.274406522643146 |
| 37 | 0.671251858154618 | 0.657496283690763 | 0.328748141845382 |
| 38 | 0.898460350433269 | 0.203079299133462 | 0.101539649566731 |
| 39 | 0.878249899176306 | 0.243500201647387 | 0.121750100823694 |
| 40 | 0.834541291548775 | 0.33091741690245 | 0.165458708451225 |
| 41 | 0.835622424598799 | 0.328755150802402 | 0.164377575401201 |
| 42 | 0.79258247162964 | 0.414835056740721 | 0.207417528370360 |
| 43 | 0.726186284852414 | 0.547627430295173 | 0.273813715147586 |
| 44 | 0.657198396114554 | 0.685603207770892 | 0.342801603885446 |
| 45 | 0.570794661859996 | 0.858410676280008 | 0.429205338140004 |
| 46 | 0.515675554791535 | 0.968648890416931 | 0.484324445208465 |
| 47 | 0.431131000785578 | 0.862262001571156 | 0.568868999214422 |
| 48 | 0.450776251476783 | 0.901552502953566 | 0.549223748523217 |
| 49 | 0.391813150026088 | 0.783626300052176 | 0.608186849973912 |
| 50 | 0.823842449372578 | 0.352315101254844 | 0.176157550627422 |
| 51 | 0.862401981176716 | 0.275196037646567 | 0.137598018823284 |
| 52 | 0.80780749683412 | 0.38438500633176 | 0.19219250316588 |
| 53 | 0.695035213699574 | 0.609929572600852 | 0.304964786300426 |
| 54 | 0.550633306698725 | 0.89873338660255 | 0.449366693301275 |
| 55 | 0.497744030132347 | 0.995488060264695 | 0.502255969867653 |
| Meta Analysis of Goldfeld-Quandt test for Heteroskedasticity | |||
| Description | # significant tests | % significant tests | OK/NOK |
| 1% type I error level | 0 | 0 | OK |
| 5% type I error level | 0 | 0 | OK |
| 10% type I error level | 0 | 0 | OK |