| Multiple Linear Regression - Estimated Regression Equation |
| Y[t] = + 0.201644028496708 + 0.211282850119338X[t] + 1.07442780328295Y1[t] -0.360757733933598Y2[t] + 0.0825009869871107M1[t] + 0.123583145368402M2[t] + 0.204738091758070M3[t] + 0.132843919065565M4[t] + 0.12649724446896M5[t] + 0.179670038959494M6[t] + 0.238304649778517M7[t] + 0.281164917599927M8[t] + 0.222128886451194M9[t] + 0.0713170887252957M10[t] + 0.00836663797171274M11[t] + 0.00202552882501797t + e[t] |
| Multiple Linear Regression - Ordinary Least Squares | |||||
| Variable | Parameter | S.D. | T-STAT H0: parameter = 0 | 2-tail p-value | 1-tail p-value |
| (Intercept) | 0.201644028496708 | 0.515655 | 0.391 | 0.697695 | 0.348848 |
| X | 0.211282850119338 | 0.06856 | 3.0817 | 0.003584 | 0.001792 |
| Y1 | 1.07442780328295 | 0.159756 | 6.7254 | 0 | 0 |
| Y2 | -0.360757733933598 | 0.13376 | -2.697 | 0.00995 | 0.004975 |
| M1 | 0.0825009869871107 | 0.10194 | 0.8093 | 0.422794 | 0.211397 |
| M2 | 0.123583145368402 | 0.108378 | 1.1403 | 0.260474 | 0.130237 |
| M3 | 0.204738091758070 | 0.103707 | 1.9742 | 0.054805 | 0.027402 |
| M4 | 0.132843919065565 | 0.103238 | 1.2868 | 0.205056 | 0.102528 |
| M5 | 0.12649724446896 | 0.103685 | 1.22 | 0.229107 | 0.114554 |
| M6 | 0.179670038959494 | 0.107244 | 1.6753 | 0.101125 | 0.050562 |
| M7 | 0.238304649778517 | 0.114831 | 2.0753 | 0.043979 | 0.021989 |
| M8 | 0.281164917599927 | 0.125354 | 2.243 | 0.030107 | 0.015053 |
| M9 | 0.222128886451194 | 0.123218 | 1.8027 | 0.078442 | 0.039221 |
| M10 | 0.0713170887252957 | 0.100561 | 0.7092 | 0.482032 | 0.241016 |
| M11 | 0.00836663797171274 | 0.100645 | 0.0831 | 0.934134 | 0.467067 |
| t | 0.00202552882501797 | 0.002383 | 0.85 | 0.400037 | 0.200018 |
| Multiple Linear Regression - Regression Statistics | |
| Multiple R | 0.978038480327254 |
| R-squared | 0.956559269000845 |
| Adjusted R-squared | 0.941405525629047 |
| F-TEST (value) | 63.1236286329784 |
| F-TEST (DF numerator) | 15 |
| F-TEST (DF denominator) | 43 |
| p-value | 0 |
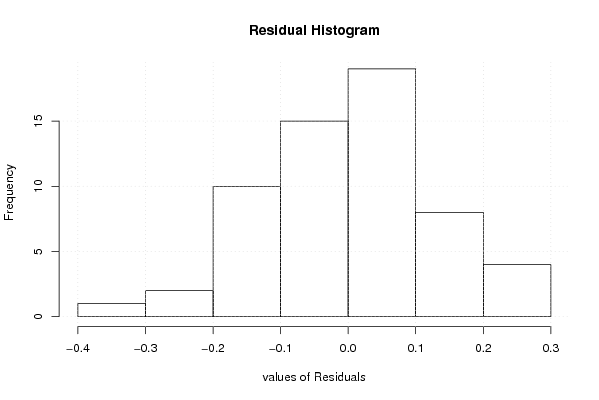
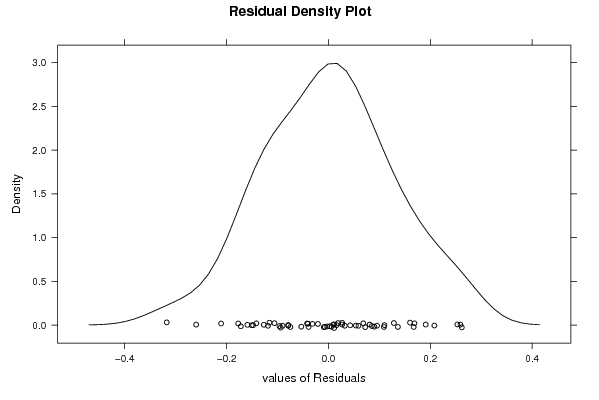
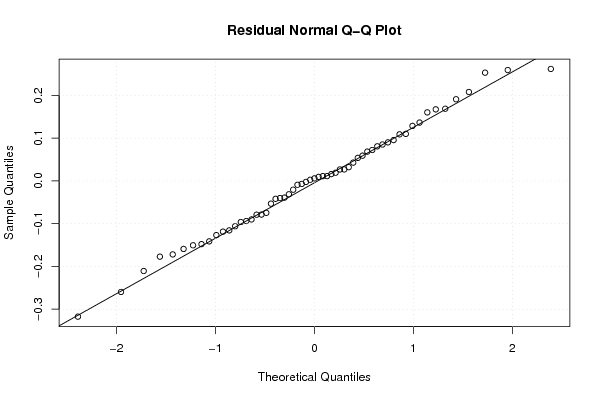
| Multiple Linear Regression - Residual Statistics | |
| Residual Standard Deviation | 0.148271373550655 |
| Sum Squared Residuals | 0.945329209227708 |
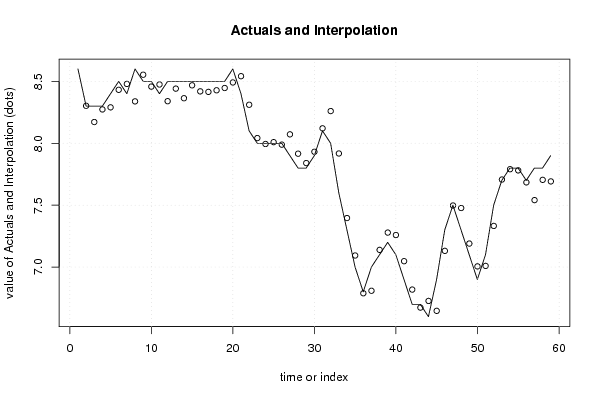
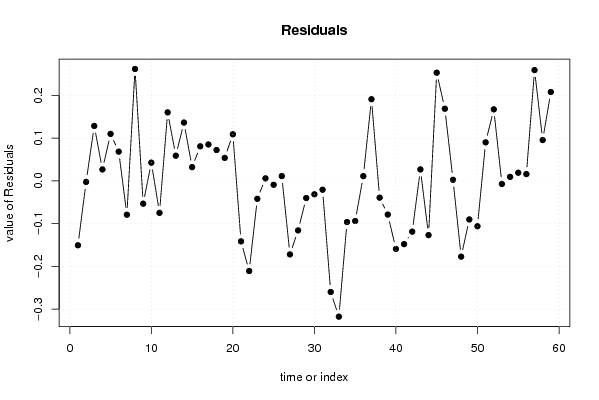
| Multiple Linear Regression - Actuals, Interpolation, and Residuals | |||
| Time or Index | Actuals | Interpolation Forecast | Residuals Prediction Error |
| 1 | 8.6 | 8.75066266271143 | -0.150662662711430 |
| 2 | 8.3 | 8.30241572883739 | -0.00241572883738628 |
| 3 | 8.3 | 8.17149518324727 | 0.128504816752731 |
| 4 | 8.3 | 8.27323871459566 | 0.0267612854043373 |
| 5 | 8.4 | 8.29004585383601 | 0.10995414616399 |
| 6 | 8.5 | 8.43155867246792 | 0.0684413275320767 |
| 7 | 8.4 | 8.47907267899916 | -0.0790726789991636 |
| 8 | 8.6 | 8.33818335190007 | 0.26181664809993 |
| 9 | 8.5 | 8.55326246863824 | -0.0532624686382377 |
| 10 | 8.5 | 8.45729300775361 | 0.0427069922463853 |
| 11 | 8.4 | 8.47470042924228 | -0.0747004292422772 |
| 12 | 8.5 | 8.33978825475535 | 0.160211745244646 |
| 13 | 8.5 | 8.44106361421753 | 0.058936385782466 |
| 14 | 8.5 | 8.36358238798275 | 0.136417612017252 |
| 15 | 8.5 | 8.46789114820937 | 0.032108851790632 |
| 16 | 8.5 | 8.41915078935381 | 0.0808492106461849 |
| 17 | 8.5 | 8.41482964358223 | 0.085170356417772 |
| 18 | 8.5 | 8.42777139687391 | 0.0722286031260873 |
| 19 | 8.5 | 8.44617496649409 | 0.053825033505914 |
| 20 | 8.6 | 8.49106076314051 | 0.108939236859486 |
| 21 | 8.4 | 8.5414930411451 | -0.141493041145093 |
| 22 | 8.1 | 8.31077171828973 | -0.210771718289735 |
| 23 | 8 | 8.04192657218687 | -0.0419265721868712 |
| 24 | 8 | 7.9941134328681 | 0.00588656713190568 |
| 25 | 8 | 8.00907429701391 | -0.00907429701391372 |
| 26 | 8 | 7.98879712918442 | 0.0112028708155788 |
| 27 | 7.9 | 8.07197760439911 | -0.171977604399106 |
| 28 | 7.8 | 7.91579446521526 | -0.115794465215259 |
| 29 | 7.8 | 7.84010631250874 | -0.0401063125087369 |
| 30 | 7.9 | 7.93138040921765 | -0.0313804092176488 |
| 31 | 8.1 | 8.12061161420192 | -0.0206116142019195 |
| 32 | 8 | 8.25979405806384 | -0.259794058063841 |
| 33 | 7.6 | 7.91754780356544 | -0.317547803565444 |
| 34 | 7.3 | 7.39619447175668 | -0.0961944717566763 |
| 35 | 7 | 7.09385944738086 | -0.0938594473808646 |
| 36 | 6.8 | 6.78890417738163 | 0.0110958226183700 |
| 37 | 7 | 6.80902902274112 | 0.190970977258884 |
| 38 | 7.1 | 7.13917381739073 | -0.0391738173907347 |
| 39 | 7.2 | 7.27877381115893 | -0.0787738111589281 |
| 40 | 7.1 | 7.25914388921444 | -0.159143889214444 |
| 41 | 6.9 | 7.0479193346854 | -0.147919334685400 |
| 42 | 6.7 | 6.81866644567805 | -0.118666445678054 |
| 43 | 6.7 | 6.67320771641642 | 0.026792283583577 |
| 44 | 6.6 | 6.72686020481377 | -0.126860204813769 |
| 45 | 6.9 | 6.6469200622095 | 0.253079937790506 |
| 46 | 7.3 | 7.131205612842 | 0.168794387158002 |
| 47 | 7.5 | 7.4974659171062 | 0.00253408289379855 |
| 48 | 7.3 | 7.47719413499492 | -0.177194134994923 |
| 49 | 7.1 | 7.190170403316 | -0.0901704033160069 |
| 50 | 6.9 | 7.00603093660471 | -0.106030936604710 |
| 51 | 7.1 | 7.00986225298533 | 0.090137747014672 |
| 52 | 7.5 | 7.33267214162082 | 0.167327858379181 |
| 53 | 7.7 | 7.70709885538763 | -0.00709885538762563 |
| 54 | 7.8 | 7.79062307576246 | 0.0093769242375388 |
| 55 | 7.8 | 7.78093302388841 | 0.0190669761115921 |
| 56 | 7.7 | 7.6841016220818 | 0.0158983779181940 |
| 57 | 7.8 | 7.54077662444173 | 0.259223375558269 |
| 58 | 7.8 | 7.70453518935798 | 0.0954648106420248 |
| 59 | 7.9 | 7.69204763408379 | 0.207952365916215 |
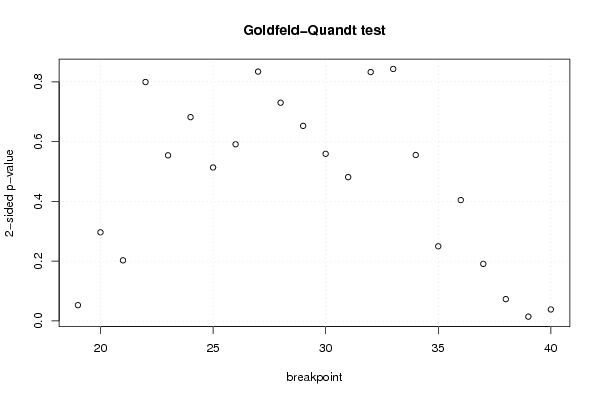
| Goldfeld-Quandt test for Heteroskedasticity | |||
| p-values | Alternative Hypothesis | ||
| breakpoint index | greater | 2-sided | less |
| 19 | 0.0263931641773778 | 0.0527863283547556 | 0.973606835822622 |
| 20 | 0.148271753401231 | 0.296543506802463 | 0.851728246598769 |
| 21 | 0.101417661472877 | 0.202835322945754 | 0.898582338527123 |
| 22 | 0.399673673115649 | 0.799347346231298 | 0.600326326884351 |
| 23 | 0.277025970375291 | 0.554051940750581 | 0.72297402962471 |
| 24 | 0.340870320513647 | 0.681740641027294 | 0.659129679486353 |
| 25 | 0.256686319972698 | 0.513372639945397 | 0.743313680027302 |
| 26 | 0.295508752058801 | 0.591017504117603 | 0.704491247941199 |
| 27 | 0.417087829559607 | 0.834175659119214 | 0.582912170440393 |
| 28 | 0.365006847268078 | 0.730013694536155 | 0.634993152731922 |
| 29 | 0.326289983459356 | 0.652579966918711 | 0.673710016540644 |
| 30 | 0.279557744586632 | 0.559115489173264 | 0.720442255413368 |
| 31 | 0.240559954899215 | 0.481119909798429 | 0.759440045100785 |
| 32 | 0.416296812405157 | 0.832593624810315 | 0.583703187594843 |
| 33 | 0.578501184076847 | 0.842997631846305 | 0.421498815923152 |
| 34 | 0.722430620438666 | 0.555138759122669 | 0.277569379561334 |
| 35 | 0.875117404829653 | 0.249765190340694 | 0.124882595170347 |
| 36 | 0.7978204810275 | 0.404359037945002 | 0.202179518972501 |
| 37 | 0.904564074857248 | 0.190871850285504 | 0.0954359251427522 |
| 38 | 0.963526129967549 | 0.0729477400649024 | 0.0364738700324512 |
| 39 | 0.9928106108946 | 0.0143787782108004 | 0.00718938910540022 |
| 40 | 0.980736449712495 | 0.038527100575011 | 0.0192635502875055 |
| Meta Analysis of Goldfeld-Quandt test for Heteroskedasticity | |||
| Description | # significant tests | % significant tests | OK/NOK |
| 1% type I error level | 0 | 0 | OK |
| 5% type I error level | 2 | 0.090909090909091 | NOK |
| 10% type I error level | 4 | 0.181818181818182 | NOK |