| Multiple Linear Regression - Estimated Regression Equation |
| Y[t] = + 4.07580781441513 -0.0165836837962970X[t] + 1.37883885721972Y1[t] -0.67582544891961Y2[t] -0.0963430856947516M1[t] -0.0639092820674027M2[t] + 0.0374513471373744M3[t] + 0.0151821678867695M4[t] -0.1580414784M5[t] -0.0227755674317749M6[t] -0.0688470670504502M7[t] -0.154153022084673M8[t] + 0.0124870320512885M9[t] + 0.10368881377741M10[t] -0.481693411399994M11[t] -0.00500950379451003t + e[t] |
| Multiple Linear Regression - Ordinary Least Squares | |||||
| Variable | Parameter | S.D. | T-STAT H0: parameter = 0 | 2-tail p-value | 1-tail p-value |
| (Intercept) | 4.07580781441513 | 1.004399 | 4.058 | 0.000211 | 0.000105 |
| X | -0.0165836837962970 | 0.005499 | -3.0157 | 0.004338 | 0.002169 |
| Y1 | 1.37883885721972 | 0.112875 | 12.2156 | 0 | 0 |
| Y2 | -0.67582544891961 | 0.120155 | -5.6246 | 1e-06 | 1e-06 |
| M1 | -0.0963430856947516 | 0.145639 | -0.6615 | 0.511891 | 0.255946 |
| M2 | -0.0639092820674027 | 0.151328 | -0.4223 | 0.674943 | 0.337471 |
| M3 | 0.0374513471373744 | 0.16916 | 0.2214 | 0.825857 | 0.412929 |
| M4 | 0.0151821678867695 | 0.170499 | 0.089 | 0.929469 | 0.464735 |
| M5 | -0.1580414784 | 0.16587 | -0.9528 | 0.346141 | 0.173071 |
| M6 | -0.0227755674317749 | 0.149099 | -0.1528 | 0.879323 | 0.439661 |
| M7 | -0.0688470670504502 | 0.153843 | -0.4475 | 0.656804 | 0.328402 |
| M8 | -0.154153022084673 | 0.154904 | -0.9952 | 0.325361 | 0.162681 |
| M9 | 0.0124870320512885 | 0.147277 | 0.0848 | 0.932834 | 0.466417 |
| M10 | 0.10368881377741 | 0.207027 | 0.5008 | 0.619094 | 0.309547 |
| M11 | -0.481693411399994 | 0.1816 | -2.6525 | 0.011227 | 0.005614 |
| t | -0.00500950379451003 | 0.002393 | -2.0934 | 0.042392 | 0.021196 |
| Multiple Linear Regression - Regression Statistics | |
| Multiple R | 0.957899251774148 |
| R-squared | 0.917570976549472 |
| Adjusted R-squared | 0.888132039602854 |
| F-TEST (value) | 31.168617882274 |
| F-TEST (DF numerator) | 15 |
| F-TEST (DF denominator) | 42 |
| p-value | 0 |
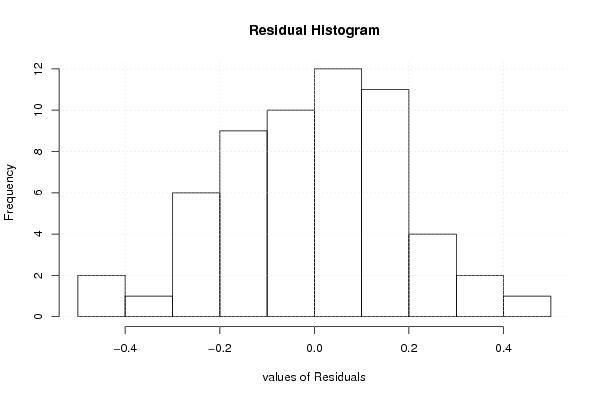
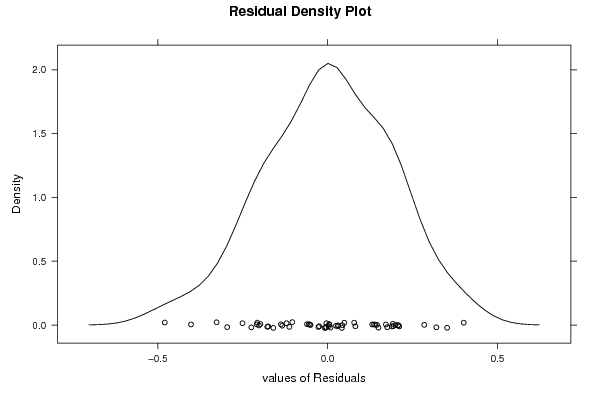
| Multiple Linear Regression - Residual Statistics | |
| Residual Standard Deviation | 0.216671744732013 |
| Sum Squared Residuals | 1.97175908853902 |
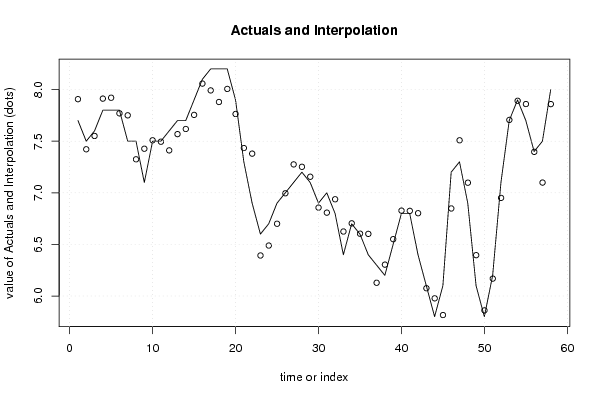
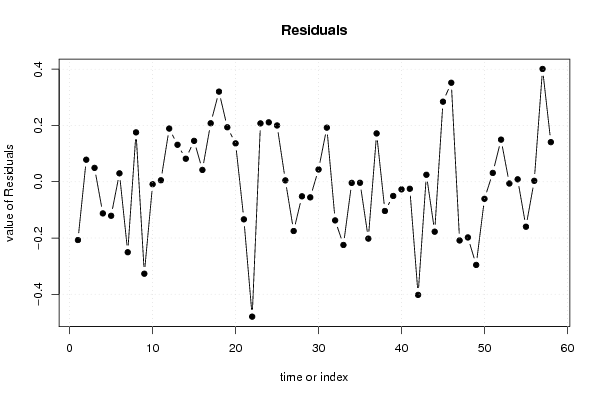
| Multiple Linear Regression - Actuals, Interpolation, and Residuals | |||
| Time or Index | Actuals | Interpolation Forecast | Residuals Prediction Error |
| 1 | 7.7 | 7.9072660543172 | -0.2072660543172 |
| 2 | 7.5 | 7.42170784266648 | 0.0782921573335173 |
| 3 | 7.6 | 7.55076384893213 | 0.0492361510678705 |
| 4 | 7.8 | 7.91261992796699 | -0.112619927966989 |
| 5 | 7.8 | 7.92101321550251 | -0.121013215502508 |
| 6 | 7.8 | 7.77016811548489 | 0.0298318845151131 |
| 7 | 7.5 | 7.75059611128467 | -0.250596111284665 |
| 8 | 7.5 | 7.32457230913261 | 0.175427690867388 |
| 9 | 7.1 | 7.42692829016845 | -0.326928290168453 |
| 10 | 7.5 | 7.50884659048998 | -0.00884659048997798 |
| 11 | 7.5 | 7.4948820637886 | 0.00511793621139902 |
| 12 | 7.6 | 7.41102132539104 | 0.188978674608957 |
| 13 | 7.7 | 7.56861351333672 | 0.131386486663279 |
| 14 | 7.7 | 7.61824647099031 | 0.0817535290096892 |
| 15 | 7.9 | 7.75480899618455 | 0.145191003815453 |
| 16 | 8.1 | 8.05802424111116 | 0.041975758888842 |
| 17 | 8.2 | 7.9922015102362 | 0.207798489763805 |
| 18 | 8.2 | 7.87973819316276 | 0.320261806837236 |
| 19 | 8.2 | 8.00651316504281 | 0.193486834957186 |
| 20 | 7.9 | 7.76362781528815 | 0.136372184711853 |
| 21 | 7.3 | 7.43366339462109 | -0.133663394621088 |
| 22 | 6.9 | 7.37954355974862 | -0.479543559748621 |
| 23 | 6.6 | 6.3926979319165 | 0.2073020680835 |
| 24 | 6.7 | 6.48891368363686 | 0.211086316363139 |
| 25 | 6.9 | 6.70000035209175 | 0.199999647908249 |
| 26 | 7 | 6.99531114014324 | 0.00468885985675709 |
| 27 | 7.1 | 7.2751432148712 | -0.175143214871198 |
| 28 | 7.2 | 7.25183113747091 | -0.0518311374709055 |
| 29 | 7.1 | 7.15550790687705 | -0.0555079068770469 |
| 30 | 6.9 | 6.85641815218682 | 0.0435818478131835 |
| 31 | 7 | 6.80776470643462 | 0.192235293565378 |
| 32 | 6.8 | 6.93743043496363 | -0.137430434963631 |
| 33 | 6.4 | 6.62469956697843 | -0.224699566978430 |
| 34 | 6.7 | 6.70413838157461 | -0.00413838157461365 |
| 35 | 6.6 | 6.60369938891978 | -0.00369938891978386 |
| 36 | 6.4 | 6.60210720061815 | -0.202107200618146 |
| 37 | 6.3 | 6.12839091499356 | 0.171609085006438 |
| 38 | 6.2 | 6.30400794143465 | -0.104007941434652 |
| 39 | 6.5 | 6.55062072050566 | -0.05062072050566 |
| 40 | 6.8 | 6.82713082289804 | -0.0271308228980438 |
| 41 | 6.8 | 6.82497595933457 | -0.0249759593345744 |
| 42 | 6.4 | 6.8022357832213 | -0.402235783221297 |
| 43 | 6.1 | 6.075241608448 | 0.0247583915520039 |
| 44 | 5.8 | 5.97759087915082 | -0.177590879150825 |
| 45 | 6.1 | 5.81554835718742 | 0.284451642812577 |
| 46 | 7.2 | 6.84815523450715 | 0.351844765492855 |
| 47 | 7.3 | 7.50872061537512 | -0.208720615375115 |
| 48 | 6.9 | 7.09795779035395 | -0.197957790353950 |
| 49 | 6.1 | 6.39572916526077 | -0.295729165260766 |
| 50 | 5.8 | 5.86072660476531 | -0.0607266047653117 |
| 51 | 6.2 | 6.16866321950647 | 0.0313367804935349 |
| 52 | 7.1 | 6.9503938705529 | 0.149606129447097 |
| 53 | 7.7 | 7.70630140804968 | -0.00630140804967544 |
| 54 | 7.9 | 7.89143975594424 | 0.0085602440557647 |
| 55 | 7.7 | 7.8598844087899 | -0.159884408789902 |
| 56 | 7.4 | 7.39677856146479 | 0.00322143853521490 |
| 57 | 7.5 | 7.0991603910446 | 0.400839608955395 |
| 58 | 8 | 7.85931623367964 | 0.140683766320358 |
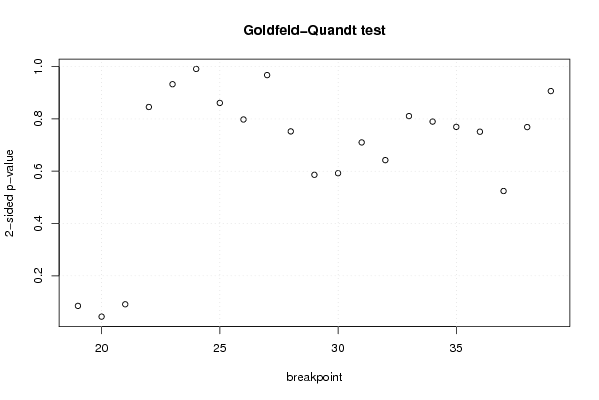
| Goldfeld-Quandt test for Heteroskedasticity | |||
| p-values | Alternative Hypothesis | ||
| breakpoint index | greater | 2-sided | less |
| 19 | 0.0424755472764217 | 0.0849510945528435 | 0.957524452723578 |
| 20 | 0.0219340250221237 | 0.0438680500442474 | 0.978065974977876 |
| 21 | 0.0455672978408001 | 0.0911345956816001 | 0.9544327021592 |
| 22 | 0.577244839484812 | 0.845510321030375 | 0.422755160515188 |
| 23 | 0.533683814102491 | 0.932632371795019 | 0.466316185897509 |
| 24 | 0.495500108273779 | 0.991000216547559 | 0.50449989172622 |
| 25 | 0.430509381573113 | 0.861018763146225 | 0.569490618426887 |
| 26 | 0.398872056180462 | 0.797744112360923 | 0.601127943819538 |
| 27 | 0.483755945161994 | 0.967511890323987 | 0.516244054838006 |
| 28 | 0.376110260487611 | 0.752220520975222 | 0.623889739512389 |
| 29 | 0.29315326143582 | 0.58630652287164 | 0.70684673856418 |
| 30 | 0.296210666717372 | 0.592421333434745 | 0.703789333282628 |
| 31 | 0.355043625524472 | 0.710087251048945 | 0.644956374475528 |
| 32 | 0.321178918837646 | 0.642357837675292 | 0.678821081162354 |
| 33 | 0.405420146281623 | 0.810840292563247 | 0.594579853718377 |
| 34 | 0.394869308148510 | 0.789738616297019 | 0.605130691851490 |
| 35 | 0.384746075411139 | 0.769492150822277 | 0.615253924588861 |
| 36 | 0.375468091705598 | 0.750936183411197 | 0.624531908294402 |
| 37 | 0.737898998386726 | 0.524202003226547 | 0.262101001613274 |
| 38 | 0.61562251239832 | 0.76875497520336 | 0.38437748760168 |
| 39 | 0.546782161056871 | 0.906435677886259 | 0.453217838943129 |
| Meta Analysis of Goldfeld-Quandt test for Heteroskedasticity | |||
| Description | # significant tests | % significant tests | OK/NOK |
| 1% type I error level | 0 | 0 | OK |
| 5% type I error level | 1 | 0.0476190476190476 | OK |
| 10% type I error level | 3 | 0.142857142857143 | NOK |