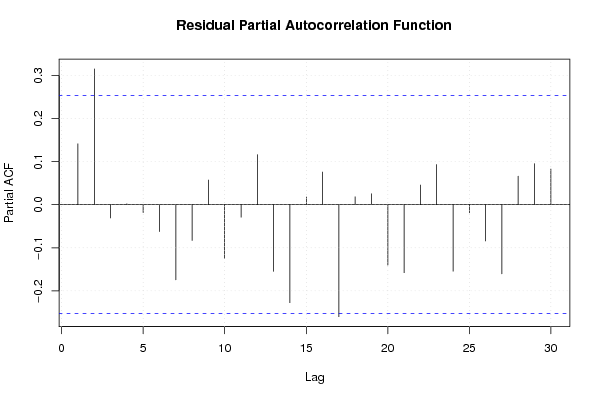
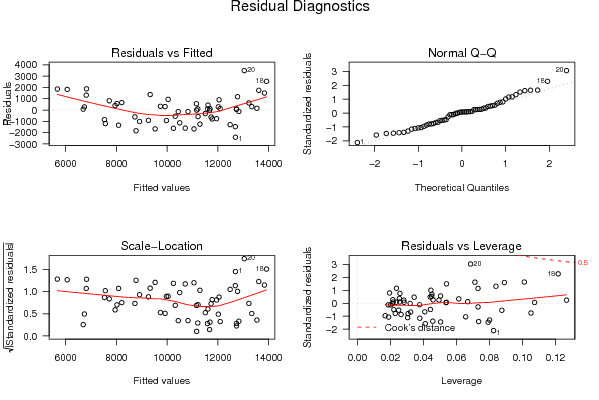
| Multiple Linear Regression - Estimated Regression Equation |
| Invoer/inflatie[t] = + 14821.9835564809 + 3533.54666618665`Uitvoer/inflatie`[t] -4143.3985152365Inflatie[t] + e[t] |
| Multiple Linear Regression - Ordinary Least Squares | |||||
| Variable | Parameter | S.D. | T-STAT H0: parameter = 0 | 2-tail p-value | 1-tail p-value |
| (Intercept) | 14821.9835564809 | 3900.87748 | 3.7997 | 0.000354 | 0.000177 |
| `Uitvoer/inflatie` | 3533.54666618665 | 4263.023216 | 0.8289 | 0.410628 | 0.205314 |
| Inflatie | -4143.3985152365 | 350.717647 | -11.8141 | 0 | 0 |
| Multiple Linear Regression - Regression Statistics | |
| Multiple R | 0.882273496726411 |
| R-squared | 0.778406523025849 |
| Adjusted R-squared | 0.770631313307458 |
| F-TEST (value) | 100.113894186626 |
| F-TEST (DF numerator) | 2 |
| F-TEST (DF denominator) | 57 |
| p-value | 0 |
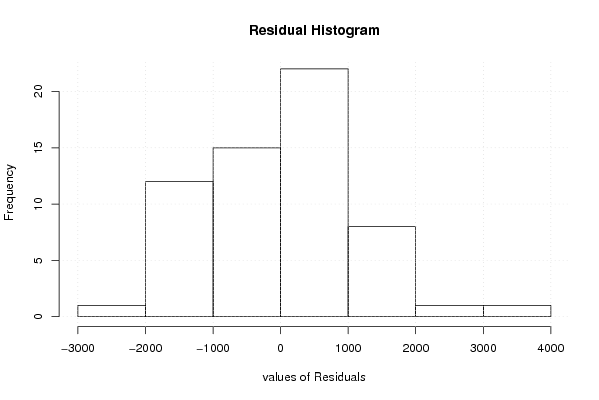
| Multiple Linear Regression - Residual Statistics | |
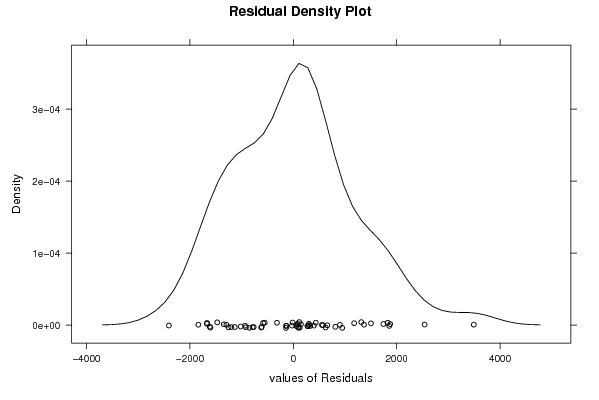
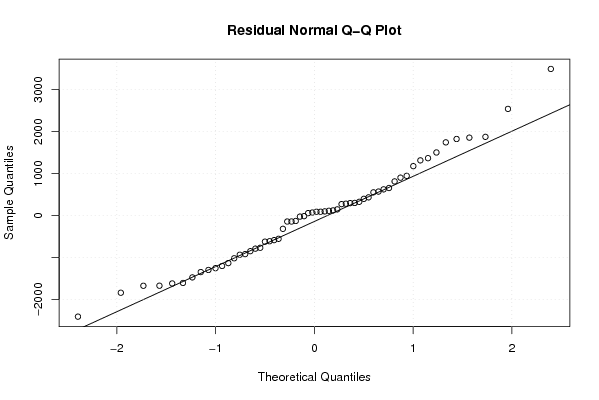
| Residual Standard Deviation | 1184.69780364966 |
| Sum Squared Residuals | 80000006.5004223 |
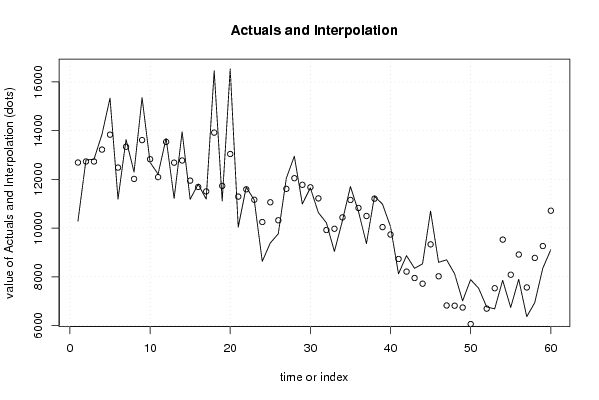
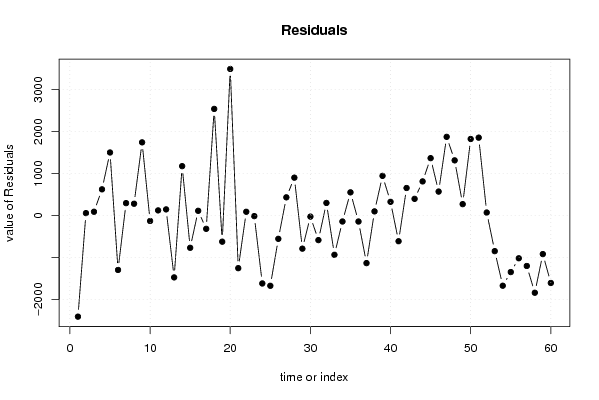
| Multiple Linear Regression - Actuals, Interpolation, and Residuals | |||
| Time or Index | Actuals | Interpolation Forecast | Residuals Prediction Error |
| 1 | 10284.5 | 12690.2888406881 | -2405.78884068811 |
| 2 | 12792 | 12732.4744407282 | 59.5255592717623 |
| 3 | 12823.61538 | 12731.5981847589 | 92.0171952411318 |
| 4 | 13845.66667 | 13220.0444356176 | 625.622234382379 |
| 5 | 15335.63636 | 13832.6526400444 | 1502.98371995564 |
| 6 | 11188.5 | 12482.4494102115 | -1293.94941021150 |
| 7 | 13633.25 | 13335.7871806879 | 297.462819312128 |
| 8 | 12298.46667 | 12015.5614371031 | 282.905232896909 |
| 9 | 15353.63636 | 13609.6722483204 | 1743.96411167959 |
| 10 | 12696.15385 | 12824.4801337744 | -128.326283774408 |
| 11 | 12213.93333 | 12089.9382728987 | 123.995057101252 |
| 12 | 13683.72727 | 13535.6789825489 | 148.048287451079 |
| 13 | 11214.14286 | 12685.0376475881 | -1470.89478758814 |
| 14 | 13950.23077 | 12772.8009360497 | 1177.42983395031 |
| 15 | 11179.13333 | 11945.7404312925 | -766.607101292522 |
| 16 | 11801.875 | 11687.758722936 | 114.116277063995 |
| 17 | 11188.82353 | 11503.8420820192 | -315.018552019241 |
| 18 | 16456.27273 | 13916.0911785274 | 2540.18155147257 |
| 19 | 11110.0625 | 11730.9295819819 | -620.867081981874 |
| 20 | 16530.69231 | 13039.1210620818 | 3491.57124791821 |
| 21 | 10038.41176 | 11290.2057268949 | -1251.79396689487 |
| 22 | 11681.25 | 11589.8548761972 | 91.3951238028015 |
| 23 | 11148.88235 | 11161.3993149243 | -12.5169649243203 |
| 24 | 8631 | 10246.6306801802 | -1615.63068018024 |
| 25 | 9386.444444 | 11057.0251380707 | -1670.58069407067 |
| 26 | 9764.736842 | 10317.5838414097 | -552.846999409744 |
| 27 | 12043.75 | 11608.7160437134 | 435.033956286644 |
| 28 | 12948.06667 | 12045.0005627818 | 903.066107218241 |
| 29 | 10987.125 | 11774.1752709455 | -787.050270945493 |
| 30 | 11648.3125 | 11672.5223276603 | -24.2098276603152 |
| 31 | 10633.35294 | 11217.1271055437 | -583.774165543736 |
| 32 | 10219.3 | 9917.796237524 | 301.503762475989 |
| 33 | 9037.6 | 9970.03119500193 | -932.431195001927 |
| 34 | 10296.31579 | 10436.7091800326 | -140.393390032600 |
| 35 | 11705.41176 | 11151.5222640114 | 553.889495988579 |
| 36 | 10681.94444 | 10823.1623943402 | -141.217954340199 |
| 37 | 9362.947368 | 10493.8716860042 | -1130.92431800425 |
| 38 | 11306.35294 | 11206.0331152932 | 100.319824706810 |
| 39 | 10984.45 | 10038.2611366209 | 946.188863379075 |
| 40 | 10062.61905 | 9734.28344212218 | 328.335607877823 |
| 41 | 8118.583333 | 8729.04392818293 | -610.460595182927 |
| 42 | 8867.48 | 8210.36675450854 | 657.113245491456 |
| 43 | 8346.72 | 7947.39688654352 | 399.32311345648 |
| 44 | 8529.307692 | 7715.24506509635 | 814.062626903653 |
| 45 | 10697.18182 | 9329.57643103423 | 1367.60538896577 |
| 46 | 8591.84 | 8019.56612139174 | 572.273878608257 |
| 47 | 8695.607143 | 6820.31098043501 | 1875.29616256499 |
| 48 | 8125.571429 | 6810.61639127131 | 1314.95503772869 |
| 49 | 7009.758621 | 6736.8821381928 | 272.876482807193 |
| 50 | 7883.466667 | 6059.26913086023 | 1824.19753613977 |
| 51 | 7527.645161 | 5671.54510476251 | 1856.10005623749 |
| 52 | 6763.758621 | 6690.74772535993 | 73.0108956400724 |
| 53 | 6682.333333 | 7528.49608864802 | -846.162755648021 |
| 54 | 7855.681818 | 9524.76891636953 | -1669.08709836953 |
| 55 | 6738.88 | 8083.21275970032 | -1344.33275970032 |
| 56 | 7895.434783 | 8911.51609762512 | -1016.08131462512 |
| 57 | 6361.884615 | 7561.01679545063 | -1199.13218045063 |
| 58 | 6935.956522 | 8772.48147440752 | -1836.52495240752 |
| 59 | 8344.454545 | 9260.5166607155 | -916.062115715505 |
| 60 | 9107.944444 | 10711.648481313 | -1603.704037313 |
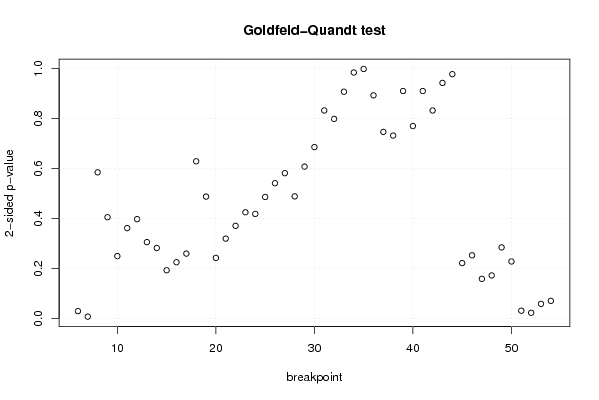
| Goldfeld-Quandt test for Heteroskedasticity | |||
| p-values | Alternative Hypothesis | ||
| breakpoint index | greater | 2-sided | less |
| 6 | 0.0147578160240361 | 0.0295156320480721 | 0.985242183975964 |
| 7 | 0.00370492173994261 | 0.00740984347988523 | 0.996295078260057 |
| 8 | 0.292412323096834 | 0.584824646193667 | 0.707587676903166 |
| 9 | 0.202605022563928 | 0.405210045127856 | 0.797394977436072 |
| 10 | 0.124847972066184 | 0.249695944132368 | 0.875152027933816 |
| 11 | 0.180824310682644 | 0.361648621365287 | 0.819175689317356 |
| 12 | 0.198783931355004 | 0.397567862710008 | 0.801216068644996 |
| 13 | 0.152822719122403 | 0.305645438244805 | 0.847177280877597 |
| 14 | 0.141039507477884 | 0.282079014955768 | 0.858960492522116 |
| 15 | 0.0964588024576054 | 0.192917604915211 | 0.903541197542395 |
| 16 | 0.112541274675112 | 0.225082549350224 | 0.887458725324888 |
| 17 | 0.129860346320053 | 0.259720692640106 | 0.870139653679947 |
| 18 | 0.314499865084808 | 0.628999730169616 | 0.685500134915192 |
| 19 | 0.243879439217359 | 0.487758878434718 | 0.756120560782641 |
| 20 | 0.878638492991819 | 0.242723014016362 | 0.121361507008181 |
| 21 | 0.84019079681006 | 0.319618406379881 | 0.159809203189941 |
| 22 | 0.814619298673089 | 0.370761402653822 | 0.185380701326911 |
| 23 | 0.78754779768207 | 0.424904404635861 | 0.212452202317930 |
| 24 | 0.790810972338374 | 0.418378055323252 | 0.209189027661626 |
| 25 | 0.75688981502237 | 0.48622036995526 | 0.24311018497763 |
| 26 | 0.729357081832116 | 0.541285836335768 | 0.270642918167884 |
| 27 | 0.709291126925903 | 0.581417746148194 | 0.290708873074097 |
| 28 | 0.755699870566599 | 0.488600258866802 | 0.244300129433401 |
| 29 | 0.696184270452485 | 0.60763145909503 | 0.303815729547515 |
| 30 | 0.657190385967748 | 0.685619228064504 | 0.342809614032252 |
| 31 | 0.583830019958369 | 0.832339960083263 | 0.416169980041631 |
| 32 | 0.600714205989983 | 0.798571588020033 | 0.399285794010017 |
| 33 | 0.546339049095368 | 0.907321901809264 | 0.453660950904632 |
| 34 | 0.492029470858186 | 0.984058941716373 | 0.507970529141814 |
| 35 | 0.499203039530228 | 0.998406079060455 | 0.500796960469772 |
| 36 | 0.446462139258082 | 0.892924278516164 | 0.553537860741918 |
| 37 | 0.373297906236627 | 0.746595812473253 | 0.626702093763373 |
| 38 | 0.365924080203314 | 0.731848160406628 | 0.634075919796686 |
| 39 | 0.544969807410384 | 0.910060385179231 | 0.455030192589616 |
| 40 | 0.615019375719077 | 0.769961248561846 | 0.384980624280923 |
| 41 | 0.545005125034492 | 0.909989749931016 | 0.454994874965508 |
| 42 | 0.583909467703874 | 0.832181064592252 | 0.416090532296126 |
| 43 | 0.528750953603785 | 0.94249809279243 | 0.471249046396215 |
| 44 | 0.511259012864017 | 0.977481974271967 | 0.488740987135983 |
| 45 | 0.889169719051245 | 0.22166056189751 | 0.110830280948755 |
| 46 | 0.873572523313501 | 0.252854953372998 | 0.126427476686499 |
| 47 | 0.920640539372197 | 0.158718921255606 | 0.079359460627803 |
| 48 | 0.913861765893373 | 0.172276468213255 | 0.0861382341066273 |
| 49 | 0.857771146451746 | 0.284457707096508 | 0.142228853548254 |
| 50 | 0.885893588572809 | 0.228212822854383 | 0.114106411427191 |
| 51 | 0.984396681281442 | 0.031206637437117 | 0.0156033187185585 |
| 52 | 0.988536957529628 | 0.0229260849407439 | 0.0114630424703719 |
| 53 | 0.970733800396987 | 0.058532399206025 | 0.0292661996030125 |
| 54 | 0.964664183791546 | 0.0706716324169074 | 0.0353358162084537 |
| Meta Analysis of Goldfeld-Quandt test for Heteroskedasticity | |||
| Description | # significant tests | % significant tests | OK/NOK |
| 1% type I error level | 1 | 0.0204081632653061 | NOK |
| 5% type I error level | 4 | 0.0816326530612245 | NOK |
| 10% type I error level | 6 | 0.122448979591837 | NOK |