| Multiple Linear Regression - Estimated Regression Equation |
| WlhBe[t] = + 563.25 -24.7115384615384X[t] + e[t] |
| Multiple Linear Regression - Ordinary Least Squares | |||||
| Variable | Parameter | S.D. | T-STAT H0: parameter = 0 | 2-tail p-value | 1-tail p-value |
| (Intercept) | 563.25 | 5.937654 | 94.8607 | 0 | 0 |
| X | -24.7115384615384 | 12.861988 | -1.9213 | 0.059531 | 0.029766 |
| Multiple Linear Regression - Regression Statistics | |
| Multiple R | 0.242654261833831 |
| R-squared | 0.0588810907861214 |
| Adjusted R-squared | 0.0429299228333438 |
| F-TEST (value) | 3.69133413681274 |
| F-TEST (DF numerator) | 1 |
| F-TEST (DF denominator) | 59 |
| p-value | 0.0595310492716236 |
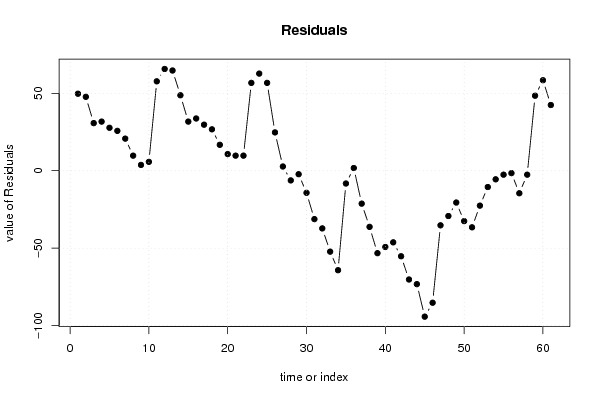
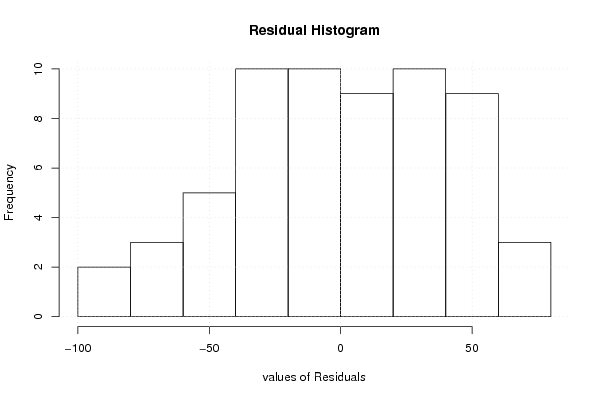
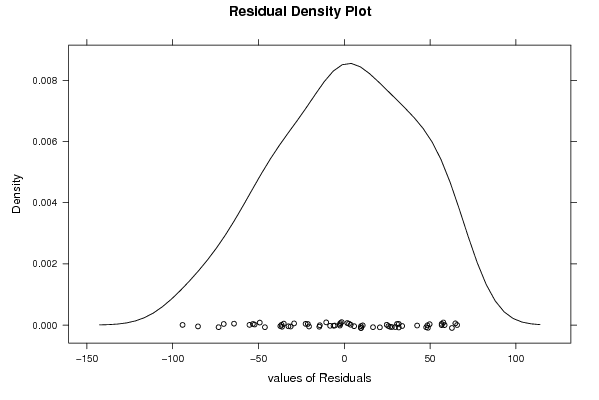
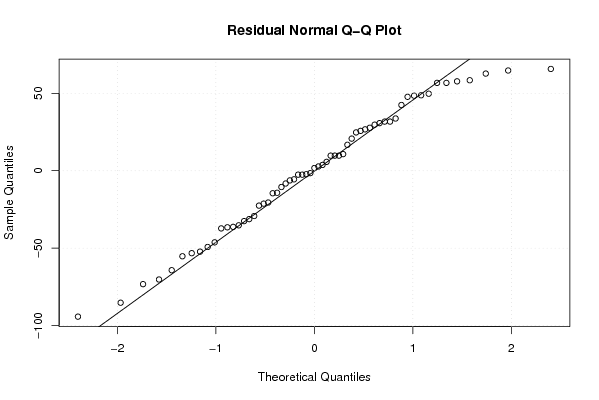
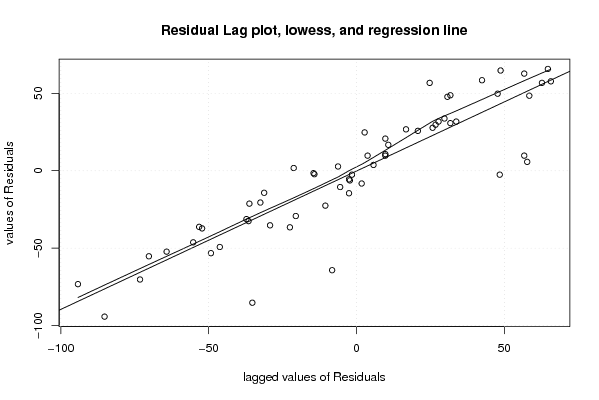
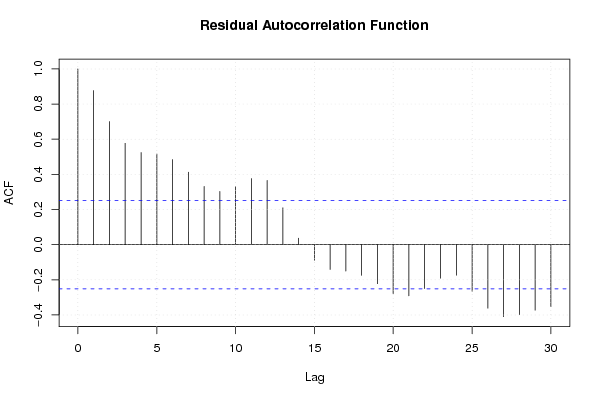
| Multiple Linear Regression - Residual Statistics | |
| Residual Standard Deviation | 41.1372713944857 |
| Sum Squared Residuals | 99844.2307692306 |
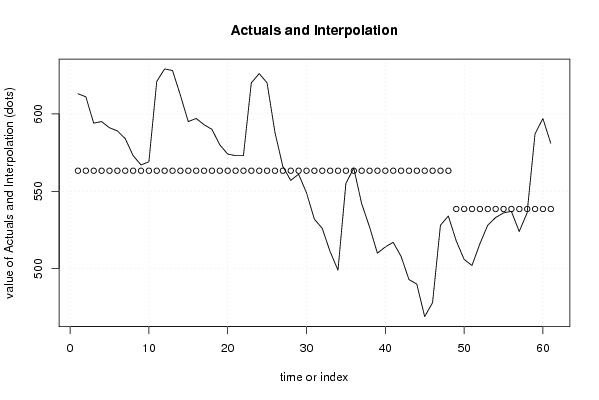
| Multiple Linear Regression - Actuals, Interpolation, and Residuals | |||
| Time or Index | Actuals | Interpolation Forecast | Residuals Prediction Error |
| 1 | 613 | 563.250000000001 | 49.7499999999988 |
| 2 | 611 | 563.25 | 47.75 |
| 3 | 594 | 563.25 | 30.75 |
| 4 | 595 | 563.25 | 31.75 |
| 5 | 591 | 563.25 | 27.75 |
| 6 | 589 | 563.25 | 25.7500000000000 |
| 7 | 584 | 563.25 | 20.7500000000000 |
| 8 | 573 | 563.25 | 9.75000000000002 |
| 9 | 567 | 563.25 | 3.75000000000002 |
| 10 | 569 | 563.25 | 5.75000000000002 |
| 11 | 621 | 563.25 | 57.75 |
| 12 | 629 | 563.25 | 65.75 |
| 13 | 628 | 563.25 | 64.75 |
| 14 | 612 | 563.25 | 48.75 |
| 15 | 595 | 563.25 | 31.75 |
| 16 | 597 | 563.25 | 33.75 |
| 17 | 593 | 563.25 | 29.75 |
| 18 | 590 | 563.25 | 26.7500000000000 |
| 19 | 580 | 563.25 | 16.7500000000000 |
| 20 | 574 | 563.25 | 10.7500000000000 |
| 21 | 573 | 563.25 | 9.75000000000002 |
| 22 | 573 | 563.25 | 9.75000000000002 |
| 23 | 620 | 563.25 | 56.75 |
| 24 | 626 | 563.25 | 62.75 |
| 25 | 620 | 563.25 | 56.75 |
| 26 | 588 | 563.25 | 24.7500000000000 |
| 27 | 566 | 563.25 | 2.75000000000002 |
| 28 | 557 | 563.25 | -6.24999999999998 |
| 29 | 561 | 563.25 | -2.24999999999998 |
| 30 | 549 | 563.25 | -14.2500000000000 |
| 31 | 532 | 563.25 | -31.25 |
| 32 | 526 | 563.25 | -37.25 |
| 33 | 511 | 563.25 | -52.25 |
| 34 | 499 | 563.25 | -64.25 |
| 35 | 555 | 563.25 | -8.24999999999997 |
| 36 | 565 | 563.25 | 1.75000000000002 |
| 37 | 542 | 563.25 | -21.2500000000000 |
| 38 | 527 | 563.25 | -36.25 |
| 39 | 510 | 563.25 | -53.25 |
| 40 | 514 | 563.25 | -49.25 |
| 41 | 517 | 563.25 | -46.25 |
| 42 | 508 | 563.25 | -55.25 |
| 43 | 493 | 563.25 | -70.25 |
| 44 | 490 | 563.25 | -73.25 |
| 45 | 469 | 563.25 | -94.25 |
| 46 | 478 | 563.25 | -85.25 |
| 47 | 528 | 563.25 | -35.25 |
| 48 | 534 | 563.25 | -29.25 |
| 49 | 518 | 538.538461538462 | -20.5384615384615 |
| 50 | 506 | 538.538461538462 | -32.5384615384615 |
| 51 | 502 | 538.538461538462 | -36.5384615384615 |
| 52 | 516 | 538.538461538462 | -22.5384615384615 |
| 53 | 528 | 538.538461538462 | -10.5384615384615 |
| 54 | 533 | 538.538461538462 | -5.53846153846154 |
| 55 | 536 | 538.538461538462 | -2.53846153846154 |
| 56 | 537 | 538.538461538462 | -1.53846153846154 |
| 57 | 524 | 538.538461538462 | -14.5384615384615 |
| 58 | 536 | 538.538461538462 | -2.53846153846154 |
| 59 | 587 | 538.538461538462 | 48.4615384615385 |
| 60 | 597 | 538.538461538462 | 58.4615384615385 |
| 61 | 581 | 538.538461538462 | 42.4615384615385 |
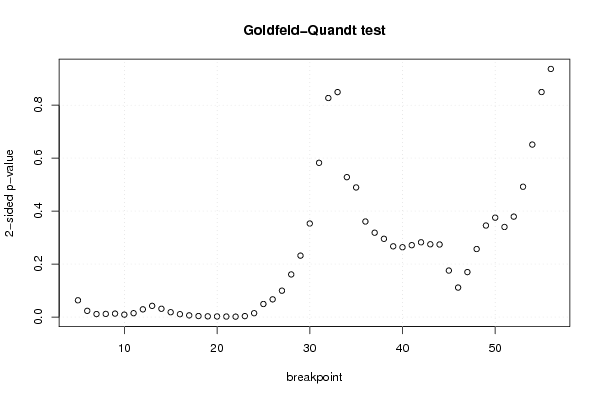
| Goldfeld-Quandt test for Heteroskedasticity | |||
| p-values | Alternative Hypothesis | ||
| breakpoint index | greater | 2-sided | less |
| 5 | 0.0316833487290806 | 0.0633666974581613 | 0.96831665127092 |
| 6 | 0.0117627595630540 | 0.0235255191261080 | 0.988237240436946 |
| 7 | 0.00567091316733492 | 0.0113418263346698 | 0.994329086832665 |
| 8 | 0.00592629432576366 | 0.0118525886515273 | 0.994073705674236 |
| 9 | 0.00654637321190572 | 0.0130927464238114 | 0.993453626788094 |
| 10 | 0.00459734350698005 | 0.0091946870139601 | 0.99540265649302 |
| 11 | 0.00735113685197553 | 0.0147022737039511 | 0.992648863148024 |
| 12 | 0.0146369227475277 | 0.0292738454950554 | 0.985363077252472 |
| 13 | 0.0211731261136838 | 0.0423462522273675 | 0.978826873886316 |
| 14 | 0.015665322140257 | 0.031330644280514 | 0.984334677859743 |
| 15 | 0.00919952842183509 | 0.0183990568436702 | 0.990800471578165 |
| 16 | 0.00545468198719831 | 0.0109093639743966 | 0.994545318012802 |
| 17 | 0.00323427919931338 | 0.00646855839862675 | 0.996765720800687 |
| 18 | 0.00195863097223663 | 0.00391726194447327 | 0.998041369027763 |
| 19 | 0.00139678057979272 | 0.00279356115958544 | 0.998603219420207 |
| 20 | 0.00117197040639105 | 0.0023439408127821 | 0.99882802959361 |
| 21 | 0.000981087642470499 | 0.00196217528494100 | 0.99901891235753 |
| 22 | 0.000798159481168932 | 0.00159631896233786 | 0.999201840518831 |
| 23 | 0.00180879997623531 | 0.00361759995247063 | 0.998191200023765 |
| 24 | 0.00729005791370595 | 0.0145801158274119 | 0.992709942086294 |
| 25 | 0.0246346036519067 | 0.0492692073038135 | 0.975365396348093 |
| 26 | 0.0334674883858569 | 0.0669349767717138 | 0.966532511614143 |
| 27 | 0.0498065959529522 | 0.0996131919059045 | 0.950193404047048 |
| 28 | 0.0804925919798834 | 0.160985183959767 | 0.919507408020117 |
| 29 | 0.115947130971383 | 0.231894261942767 | 0.884052869028617 |
| 30 | 0.176561678864449 | 0.353123357728898 | 0.82343832113555 |
| 31 | 0.291113090518402 | 0.582226181036803 | 0.708886909481598 |
| 32 | 0.413422723709822 | 0.826845447419644 | 0.586577276290178 |
| 33 | 0.575397726503296 | 0.849204546993407 | 0.424602273496704 |
| 34 | 0.735943842513563 | 0.528112314972874 | 0.264056157486437 |
| 35 | 0.755325112345167 | 0.489349775309665 | 0.244674887654833 |
| 36 | 0.819656297468832 | 0.360687405062336 | 0.180343702531168 |
| 37 | 0.84076553333204 | 0.318468933335918 | 0.159234466667959 |
| 38 | 0.85229241208247 | 0.29541517583506 | 0.14770758791753 |
| 39 | 0.866461231596592 | 0.267077536806816 | 0.133538768403408 |
| 40 | 0.868197873747586 | 0.263604252504829 | 0.131802126252414 |
| 41 | 0.864295794101125 | 0.271408411797749 | 0.135704205898875 |
| 42 | 0.858854921249682 | 0.282290157500637 | 0.141145078750318 |
| 43 | 0.8626053986837 | 0.2747892026326 | 0.1373946013163 |
| 44 | 0.863003532510605 | 0.273992934978790 | 0.136996467489395 |
| 45 | 0.912200907086094 | 0.175598185827812 | 0.0877990929139062 |
| 46 | 0.944311433495764 | 0.111377133008471 | 0.0556885665042356 |
| 47 | 0.915095839439229 | 0.169808321121542 | 0.0849041605607708 |
| 48 | 0.871593498785471 | 0.256813002429058 | 0.128406501214529 |
| 49 | 0.827227593662715 | 0.345544812674571 | 0.172772406337285 |
| 50 | 0.81236377428029 | 0.375272451439422 | 0.187636225719711 |
| 51 | 0.829951645442686 | 0.340096709114629 | 0.170048354557315 |
| 52 | 0.810436690231945 | 0.379126619536109 | 0.189563309768055 |
| 53 | 0.753999282013059 | 0.492001435973883 | 0.246000717986941 |
| 54 | 0.67442509018805 | 0.651149819623899 | 0.325574909811949 |
| 55 | 0.575281477036942 | 0.849437045926117 | 0.424718522963058 |
| 56 | 0.468311151816271 | 0.936622303632542 | 0.531688848183729 |
| Meta Analysis of Goldfeld-Quandt test for Heteroskedasticity | |||
| Description | # significant tests | % significant tests | OK/NOK |
| 1% type I error level | 8 | 0.153846153846154 | NOK |
| 5% type I error level | 20 | 0.384615384615385 | NOK |
| 10% type I error level | 23 | 0.442307692307692 | NOK |