| Multiple Linear Regression - Estimated Regression Equation |
| Y[t] = -0.914964807471034 + 0.00829634792425807X[t] + e[t] |
| Multiple Linear Regression - Ordinary Least Squares | |||||
| Variable | Parameter | S.D. | T-STAT H0: parameter = 0 | 2-tail p-value | 1-tail p-value |
| (Intercept) | -0.914964807471034 | 5.783698 | -0.1582 | 0.874842 | 0.437421 |
| X | 0.00829634792425807 | 0.002399 | 3.458 | 0.001016 | 0.000508 |
| Multiple Linear Regression - Regression Statistics | |
| Multiple R | 0.410515307946277 |
| R-squared | 0.168522818058227 |
| Adjusted R-squared | 0.154429984465994 |
| F-TEST (value) | 11.9580506613730 |
| F-TEST (DF numerator) | 1 |
| F-TEST (DF denominator) | 59 |
| p-value | 0.00101605926118986 |
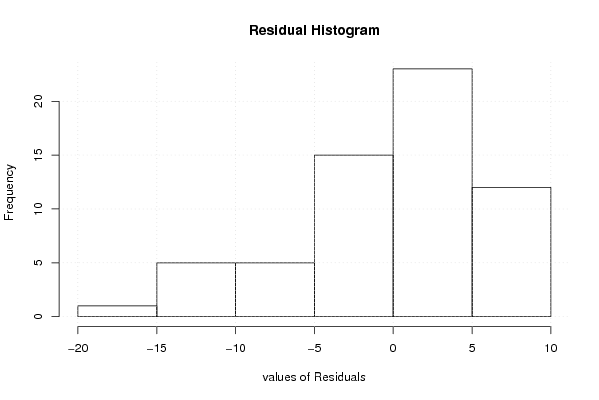
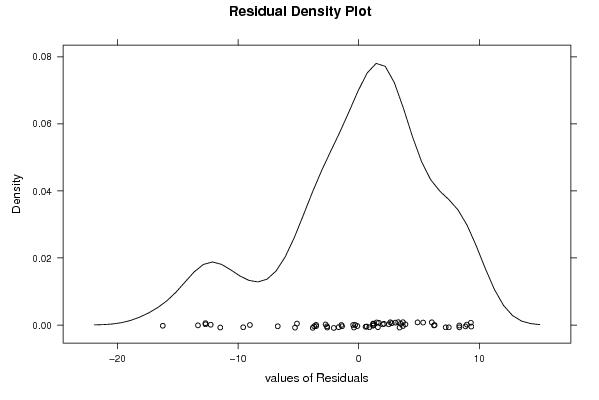
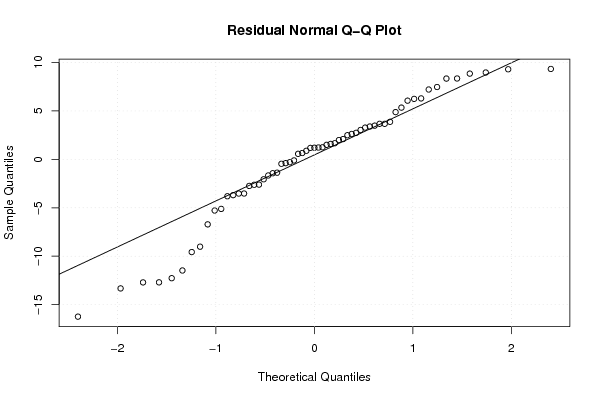
| Multiple Linear Regression - Residual Statistics | |
| Residual Standard Deviation | 6.21530259080776 |
| Sum Squared Residuals | 2279.1691914228 |
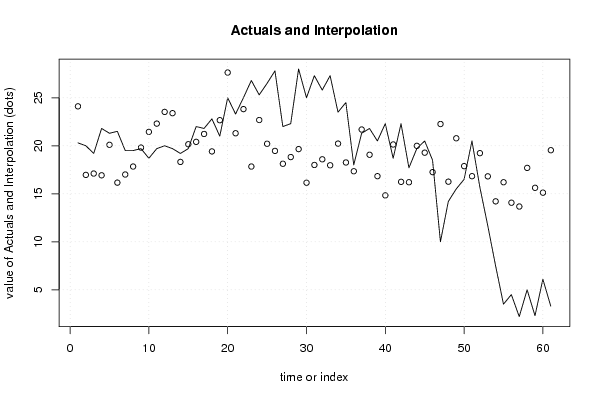
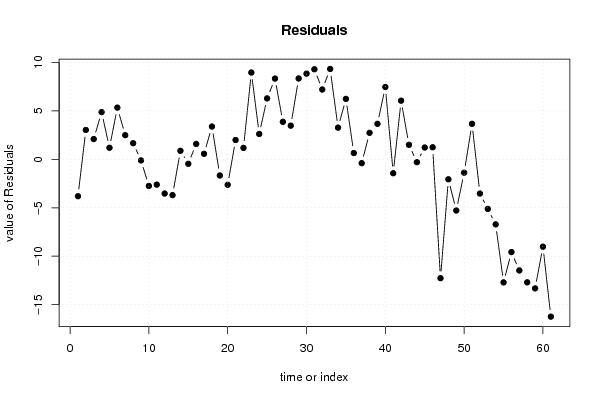
| Multiple Linear Regression - Actuals, Interpolation, and Residuals | |||
| Time or Index | Actuals | Interpolation Forecast | Residuals Prediction Error |
| 1 | 20.3 | 24.1068205320913 | -3.80682053209132 |
| 2 | 20 | 16.9636649693051 | 3.0363350306949 |
| 3 | 19.2 | 17.1047028840175 | 2.09529711598251 |
| 4 | 21.8 | 16.9221832296838 | 4.87781677031619 |
| 5 | 21.3 | 20.0996844846747 | 1.20031551532535 |
| 6 | 21.5 | 16.1589192206521 | 5.34108077934793 |
| 7 | 19.5 | 17.0051467089264 | 2.49485329107361 |
| 8 | 19.5 | 17.8347815013522 | 1.6652184986478 |
| 9 | 19.7 | 19.8093123073256 | -0.109312307325620 |
| 10 | 18.7 | 21.4436928484045 | -2.74369284840446 |
| 11 | 19.7 | 22.3065130325273 | -2.6065130325273 |
| 12 | 20 | 23.5260761773932 | -3.52607617739323 |
| 13 | 19.7 | 23.3933346106051 | -3.69333461060510 |
| 14 | 19.2 | 18.3159696809592 | 0.884030319040832 |
| 15 | 19.7 | 20.1577589201445 | -0.457758920144459 |
| 16 | 22 | 20.4066493578722 | 1.5933506421278 |
| 17 | 21.8 | 21.2279878023737 | 0.572012197626253 |
| 18 | 22.8 | 19.4110876069612 | 3.38891239303877 |
| 19 | 21 | 22.6632559932704 | -1.66325599327039 |
| 20 | 25 | 27.6244720519767 | -2.62447205197672 |
| 21 | 23.3 | 21.3026549336921 | 1.99734506630793 |
| 22 | 25 | 23.8164483547423 | 1.18355164525773 |
| 23 | 26.8 | 17.8347815013522 | 8.9652184986478 |
| 24 | 25.3 | 22.6798486891189 | 2.62015131088109 |
| 25 | 26.5 | 20.20753700769 | 6.29246299231 |
| 26 | 27.8 | 19.4608656945068 | 8.33913430549322 |
| 27 | 22 | 18.1251536787012 | 3.87484632129877 |
| 28 | 22.3 | 18.8220469043389 | 3.47795309566109 |
| 29 | 28 | 19.6516816967647 | 8.34831830323528 |
| 30 | 25 | 16.1506228727278 | 8.84937712727219 |
| 31 | 27.3 | 18.0007084598374 | 9.29929154016264 |
| 32 | 25.8 | 18.5897491624597 | 7.21025083754032 |
| 33 | 27.3 | 17.9675230681403 | 9.33247693185967 |
| 34 | 23.5 | 20.2241297035385 | 3.27587029646148 |
| 35 | 24.5 | 18.2578952454894 | 6.24210475451064 |
| 36 | 18 | 17.3452969738210 | 0.654703026179027 |
| 37 | 21.3 | 21.6925832861322 | -0.392583286132199 |
| 38 | 21.8 | 19.0626409941424 | 2.73735900585761 |
| 39 | 20.5 | 16.8309234025170 | 3.66907659748303 |
| 40 | 22.3 | 14.8315035527708 | 7.46849644722922 |
| 41 | 18.7 | 20.1328698763717 | -1.43286987637168 |
| 42 | 22.3 | 16.2418826998946 | 6.05811730010535 |
| 43 | 17.7 | 16.2004009602734 | 1.49959903972664 |
| 44 | 19.7 | 19.9918319616593 | -0.291831961659297 |
| 45 | 20.5 | 19.2783460401731 | 1.22165395982690 |
| 46 | 18.5 | 17.2540371466541 | 1.24596285334587 |
| 47 | 10 | 22.265031292906 | -12.265031292906 |
| 48 | 14.2 | 16.2584753957432 | -2.05847539574317 |
| 49 | 15.5 | 20.7799850144638 | -5.27998501446381 |
| 50 | 16.5 | 17.8762632409735 | -1.37626324097349 |
| 51 | 20.5 | 16.8309234025170 | 3.66907659748303 |
| 52 | 15.7 | 19.2285679526276 | -3.52856795262756 |
| 53 | 11.7 | 16.8143307066685 | -5.11433070666846 |
| 54 | 7.5 | 14.2092774584514 | -6.70927745845142 |
| 55 | 3.5 | 16.2004009602734 | -12.7004009602734 |
| 56 | 4.5 | 14.0682395437390 | -9.56823954373904 |
| 57 | 2.2 | 13.6700148433747 | -11.4700148433747 |
| 58 | 5 | 17.6937435866398 | -12.6937435866398 |
| 59 | 2.3 | 15.6196566055753 | -13.3196566055753 |
| 60 | 6.1 | 15.1135793821956 | -9.01357938219555 |
| 61 | 3.3 | 19.5355328258251 | -16.2355328258251 |
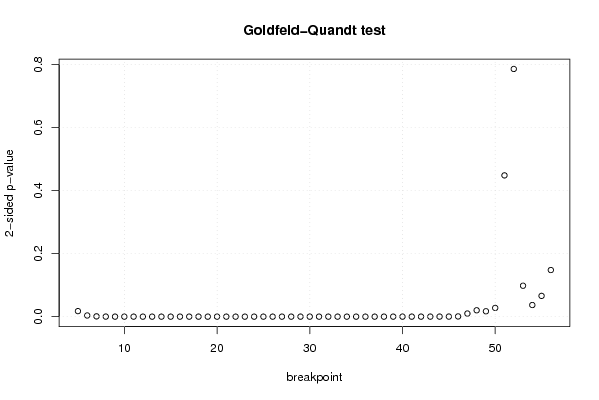
| Goldfeld-Quandt test for Heteroskedasticity | |||
| p-values | Alternative Hypothesis | ||
| breakpoint index | greater | 2-sided | less |
| 5 | 0.00880928334294045 | 0.0176185666858809 | 0.99119071665706 |
| 6 | 0.00185473775357007 | 0.00370947550714014 | 0.99814526224643 |
| 7 | 0.000473390976321406 | 0.000946781952642813 | 0.999526609023679 |
| 8 | 0.000105132441693263 | 0.000210264883386525 | 0.999894867558307 |
| 9 | 1.87607107876090e-05 | 3.75214215752181e-05 | 0.999981239289212 |
| 10 | 6.46613999866556e-06 | 1.29322799973311e-05 | 0.999993533860001 |
| 11 | 9.8153595338792e-07 | 1.96307190677584e-06 | 0.999999018464047 |
| 12 | 1.48054916711037e-07 | 2.96109833422074e-07 | 0.999999851945083 |
| 13 | 2.10102184699763e-08 | 4.20204369399526e-08 | 0.999999978989782 |
| 14 | 4.49372942748672e-09 | 8.98745885497344e-09 | 0.99999999550627 |
| 15 | 5.9334679804073e-10 | 1.18669359608146e-09 | 0.999999999406653 |
| 16 | 6.41691379529816e-10 | 1.28338275905963e-09 | 0.999999999358309 |
| 17 | 3.28254277083597e-10 | 6.56508554167193e-10 | 0.999999999671746 |
| 18 | 5.22539550251869e-10 | 1.04507910050374e-09 | 0.99999999947746 |
| 19 | 1.02416591235419e-10 | 2.04833182470839e-10 | 0.999999999897583 |
| 20 | 1.13341266330693e-09 | 2.26682532661386e-09 | 0.999999998866587 |
| 21 | 7.74224814876636e-10 | 1.54844962975327e-09 | 0.999999999225775 |
| 22 | 1.32239721454959e-09 | 2.64479442909918e-09 | 0.999999998677603 |
| 23 | 6.94816641754401e-08 | 1.38963328350880e-07 | 0.999999930518336 |
| 24 | 6.4676955866259e-08 | 1.29353911732518e-07 | 0.999999935323044 |
| 25 | 1.78302607052521e-07 | 3.56605214105043e-07 | 0.999999821697393 |
| 26 | 1.04242257791299e-06 | 2.08484515582598e-06 | 0.999998957577422 |
| 27 | 4.07606994916913e-07 | 8.15213989833827e-07 | 0.999999592393005 |
| 28 | 1.53677220653656e-07 | 3.07354441307312e-07 | 0.99999984632278 |
| 29 | 6.9182539761623e-07 | 1.38365079523246e-06 | 0.999999308174602 |
| 30 | 9.42257576969512e-07 | 1.88451515393902e-06 | 0.999999057742423 |
| 31 | 2.87569644578297e-06 | 5.75139289156593e-06 | 0.999997124303554 |
| 32 | 3.55577968963664e-06 | 7.11155937927328e-06 | 0.99999644422031 |
| 33 | 1.14065061133831e-05 | 2.28130122267662e-05 | 0.999988593493887 |
| 34 | 6.57935294114009e-06 | 1.31587058822802e-05 | 0.999993420647059 |
| 35 | 7.30904203868173e-06 | 1.46180840773635e-05 | 0.999992690957961 |
| 36 | 8.16804947261175e-06 | 1.63360989452235e-05 | 0.999991831950527 |
| 37 | 3.9274016224499e-06 | 7.8548032448998e-06 | 0.999996072598378 |
| 38 | 2.71155341295024e-06 | 5.42310682590047e-06 | 0.999997288446587 |
| 39 | 2.67726621820012e-06 | 5.35453243640025e-06 | 0.999997322733782 |
| 40 | 8.62304707871745e-06 | 1.72460941574349e-05 | 0.999991376952921 |
| 41 | 6.8202773792931e-06 | 1.36405547585862e-05 | 0.99999317972262 |
| 42 | 2.63216648596377e-05 | 5.26433297192754e-05 | 0.99997367833514 |
| 43 | 6.57405180868515e-05 | 0.000131481036173703 | 0.999934259481913 |
| 44 | 6.24436876123391e-05 | 0.000124887375224678 | 0.999937556312388 |
| 45 | 0.000106497286306838 | 0.000212994572613676 | 0.999893502713693 |
| 46 | 0.000347650777915085 | 0.00069530155583017 | 0.999652349222085 |
| 47 | 0.0048987172630841 | 0.0097974345261682 | 0.995101282736916 |
| 48 | 0.0100933692293441 | 0.0201867384586882 | 0.989906630770656 |
| 49 | 0.00855415257341547 | 0.0171083051468309 | 0.991445847426585 |
| 50 | 0.0138323517407480 | 0.0276647034814959 | 0.986167648259252 |
| 51 | 0.224153928676077 | 0.448307857352153 | 0.775846071323923 |
| 52 | 0.606989866576637 | 0.786020266846725 | 0.393010133423363 |
| 53 | 0.950920297524096 | 0.0981594049518084 | 0.0490797024759042 |
| 54 | 0.981561200434105 | 0.0368775991317899 | 0.0184387995658950 |
| 55 | 0.9670204475874 | 0.0659591048251993 | 0.0329795524125996 |
| 56 | 0.926026738624093 | 0.147946522751815 | 0.0739732613759075 |
| Meta Analysis of Goldfeld-Quandt test for Heteroskedasticity | |||
| Description | # significant tests | % significant tests | OK/NOK |
| 1% type I error level | 42 | 0.807692307692308 | NOK |
| 5% type I error level | 47 | 0.903846153846154 | NOK |
| 10% type I error level | 49 | 0.942307692307692 | NOK |