Free Statistics

of Irreproducible Research!

Author's title

Author*The author of this computation has been verified*
R Software Modulerwasp_multipleregression.wasp
Title produced by softwareMultiple Regression
Date of computationFri, 20 Nov 2009 07:01:59 -0700
Cite this page as followsStatistical Computations at FreeStatistics.org, Office for Research Development and Education, URL https://freestatistics.org/blog/index.php?v=date/2009/Nov/20/t125872576935ckqfpspxu8l5k.htm/, Retrieved Sat, 20 Apr 2024 02:27:51 +0000
Statistical Computations at FreeStatistics.org, Office for Research Development and Education, URL https://freestatistics.org/blog/index.php?pk=58170, Retrieved Sat, 20 Apr 2024 02:27:51 +0000
QR Codes:

Original text written by user:
IsPrivate?No (this computation is public)
User-defined keywordsshwws7
Estimated Impact106
Family? (F = Feedback message, R = changed R code, M = changed R Module, P = changed Parameters, D = changed Data)
-     [Multiple Regression] [Q1 The Seatbeltlaw] [2007-11-14 19:27:43] [8cd6641b921d30ebe00b648d1481bba0]
- RMPD  [Multiple Regression] [Seatbelt] [2009-11-12 13:54:52] [b98453cac15ba1066b407e146608df68]
-   PD      [Multiple Regression] [] [2009-11-20 14:01:59] [efdfe680cd785c4af09f858b30f777ec] [Current]
-   P         [Multiple Regression] [] [2009-11-20 14:13:54] [5482608004c1d7bbf873930172393a2d]
-    D        [Multiple Regression] [] [2009-11-20 14:22:29] [5482608004c1d7bbf873930172393a2d]
Feedback Forum

Post a new message
Dataseries X:
6539	2605
6699	2682
6962	2755
6981	2760
7024	2735
6940	2659
6774	2654
6671	2670
6965	2785
6969	2845
6822	2723
6878	2746
6691	2767
6837	2940
7018	2977
7167	2993
7076	2892
7171	2824
7093	2771
6971	2686
7142	2738
7047	2723
6999	2731
6650	2632
6475	2606
6437	2605
6639	2646
6422	2627
6272	2535
6232	2456
6003	2404
5673	2319
6050	2519
5977	2504
5796	2382
5752	2394
5609	2381
5839	2501
6069	2532
6006	2515
5809	2429
5797	2389
5502	2261
5568	2272
5864	2439
5764	2373
5615	2327
5615	2364
5681	2388
5915	2553
6334	2663
6494	2694
6620	2679
6578	2611
6495	2580
6538	2627
6737	2732
6651	2707
6530	2633
6563	2683


Summary of computational transaction
Raw Inputview raw input (R code)
Raw Outputview raw output of R engine
Computing time4 seconds
R Server'Gwilym Jenkins' @ 72.249.127.135

\begin{tabular}{lllllllll}
\hline
Summary of computational transaction \tabularnewline
Raw Input & view raw input (R code)  \tabularnewline
Raw Output & view raw output of R engine  \tabularnewline
Computing time & 4 seconds \tabularnewline
R Server & 'Gwilym Jenkins' @ 72.249.127.135 \tabularnewline
\hline
\end{tabular}
%Source: https://freestatistics.org/blog/index.php?pk=58170&T=0

[TABLE]
[ROW][C]Summary of computational transaction[/C][/ROW]
[ROW][C]Raw Input[/C][C]view raw input (R code) [/C][/ROW]
[ROW][C]Raw Output[/C][C]view raw output of R engine [/C][/ROW]
[ROW][C]Computing time[/C][C]4 seconds[/C][/ROW]
[ROW][C]R Server[/C][C]'Gwilym Jenkins' @ 72.249.127.135[/C][/ROW]
[/TABLE]
Source: https://freestatistics.org/blog/index.php?pk=58170&T=0

Globally Unique Identifier (entire table): ba.freestatistics.org/blog/index.php?pk=58170&T=0

As an alternative you can also use a QR Code:  

The GUIDs for individual cells are displayed in the table below:

Summary of computational transaction
Raw Inputview raw input (R code)
Raw Outputview raw output of R engine
Computing time4 seconds
R Server'Gwilym Jenkins' @ 72.249.127.135


Multiple Linear Regression - Estimated Regression Equation
Voeding-Mannen[t] = -405.961252705834 + 2.67275759582622`Landbouw-Mannen`[t] -101.428995792543M1[t] -236.177988374742M2[t] -128.965513318953M3[t] -123.616818973557M4[t] -2.59336570780475M5[t] + 162.044705787931M6[t] + 139.940583095422M7[t] + 106.359047587325M8[t] + 36.4821454927739M9[t] + 3.39130681389371M10[t] + 68.7931662887606M11[t] -4.30151865203991t + e[t]

\begin{tabular}{lllllllll}
\hline
Multiple Linear Regression - Estimated Regression Equation \tabularnewline
Voeding-Mannen[t] =  -405.961252705834 +  2.67275759582622`Landbouw-Mannen`[t] -101.428995792543M1[t] -236.177988374742M2[t] -128.965513318953M3[t] -123.616818973557M4[t] -2.59336570780475M5[t] +  162.044705787931M6[t] +  139.940583095422M7[t] +  106.359047587325M8[t] +  36.4821454927739M9[t] +  3.39130681389371M10[t] +  68.7931662887606M11[t] -4.30151865203991t  + e[t] \tabularnewline
\hline
\end{tabular}
%Source: https://freestatistics.org/blog/index.php?pk=58170&T=1

[TABLE]
[ROW][C]Multiple Linear Regression - Estimated Regression Equation[/C][/ROW]
[ROW][C]Voeding-Mannen[t] =  -405.961252705834 +  2.67275759582622`Landbouw-Mannen`[t] -101.428995792543M1[t] -236.177988374742M2[t] -128.965513318953M3[t] -123.616818973557M4[t] -2.59336570780475M5[t] +  162.044705787931M6[t] +  139.940583095422M7[t] +  106.359047587325M8[t] +  36.4821454927739M9[t] +  3.39130681389371M10[t] +  68.7931662887606M11[t] -4.30151865203991t  + e[t][/C][/ROW]
[/TABLE]
Source: https://freestatistics.org/blog/index.php?pk=58170&T=1

Globally Unique Identifier (entire table): ba.freestatistics.org/blog/index.php?pk=58170&T=1

As an alternative you can also use a QR Code:  

The GUIDs for individual cells are displayed in the table below:

Multiple Linear Regression - Estimated Regression Equation
Voeding-Mannen[t] = -405.961252705834 + 2.67275759582622`Landbouw-Mannen`[t] -101.428995792543M1[t] -236.177988374742M2[t] -128.965513318953M3[t] -123.616818973557M4[t] -2.59336570780475M5[t] + 162.044705787931M6[t] + 139.940583095422M7[t] + 106.359047587325M8[t] + 36.4821454927739M9[t] + 3.39130681389371M10[t] + 68.7931662887606M11[t] -4.30151865203991t + e[t]


Multiple Linear Regression - Ordinary Least Squares
VariableParameterS.D.T-STATH0: parameter = 02-tail p-value1-tail p-value
(Intercept)-405.961252705834396.851738-1.0230.3116790.15584
`Landbouw-Mannen`2.672757595826220.14194618.829400
M1-101.42899579254396.857076-1.04720.3004780.150239
M2-236.17798837474296.428293-2.44930.0181830.009092
M3-128.96551331895397.289058-1.32560.1915210.095761
M4-123.61681897355797.359274-1.26970.2105780.105289
M5-2.5933657078047596.208323-0.0270.9786120.489306
M6162.04470578793195.7923791.69160.0974830.048741
M7139.94058309542296.0223571.45740.1518060.075903
M8106.35904758732596.1447661.10620.2743750.137188
M936.482145492773996.0358920.37990.7057830.352891
M103.3913068138937195.9085360.03540.9719460.485973
M1168.793166288760695.5573460.71990.475220.23761
t-4.301518652039911.341897-3.20560.0024520.001226

\begin{tabular}{lllllllll}
\hline
Multiple Linear Regression - Ordinary Least Squares \tabularnewline
Variable & Parameter & S.D. & T-STATH0: parameter = 0 & 2-tail p-value & 1-tail p-value \tabularnewline
(Intercept) & -405.961252705834 & 396.851738 & -1.023 & 0.311679 & 0.15584 \tabularnewline
`Landbouw-Mannen` & 2.67275759582622 & 0.141946 & 18.8294 & 0 & 0 \tabularnewline
M1 & -101.428995792543 & 96.857076 & -1.0472 & 0.300478 & 0.150239 \tabularnewline
M2 & -236.177988374742 & 96.428293 & -2.4493 & 0.018183 & 0.009092 \tabularnewline
M3 & -128.965513318953 & 97.289058 & -1.3256 & 0.191521 & 0.095761 \tabularnewline
M4 & -123.616818973557 & 97.359274 & -1.2697 & 0.210578 & 0.105289 \tabularnewline
M5 & -2.59336570780475 & 96.208323 & -0.027 & 0.978612 & 0.489306 \tabularnewline
M6 & 162.044705787931 & 95.792379 & 1.6916 & 0.097483 & 0.048741 \tabularnewline
M7 & 139.940583095422 & 96.022357 & 1.4574 & 0.151806 & 0.075903 \tabularnewline
M8 & 106.359047587325 & 96.144766 & 1.1062 & 0.274375 & 0.137188 \tabularnewline
M9 & 36.4821454927739 & 96.035892 & 0.3799 & 0.705783 & 0.352891 \tabularnewline
M10 & 3.39130681389371 & 95.908536 & 0.0354 & 0.971946 & 0.485973 \tabularnewline
M11 & 68.7931662887606 & 95.557346 & 0.7199 & 0.47522 & 0.23761 \tabularnewline
t & -4.30151865203991 & 1.341897 & -3.2056 & 0.002452 & 0.001226 \tabularnewline
\hline
\end{tabular}
%Source: https://freestatistics.org/blog/index.php?pk=58170&T=2

[TABLE]
[ROW][C]Multiple Linear Regression - Ordinary Least Squares[/C][/ROW]
[ROW][C]Variable[/C][C]Parameter[/C][C]S.D.[/C][C]T-STATH0: parameter = 0[/C][C]2-tail p-value[/C][C]1-tail p-value[/C][/ROW]
[ROW][C](Intercept)[/C][C]-405.961252705834[/C][C]396.851738[/C][C]-1.023[/C][C]0.311679[/C][C]0.15584[/C][/ROW]
[ROW][C]`Landbouw-Mannen`[/C][C]2.67275759582622[/C][C]0.141946[/C][C]18.8294[/C][C]0[/C][C]0[/C][/ROW]
[ROW][C]M1[/C][C]-101.428995792543[/C][C]96.857076[/C][C]-1.0472[/C][C]0.300478[/C][C]0.150239[/C][/ROW]
[ROW][C]M2[/C][C]-236.177988374742[/C][C]96.428293[/C][C]-2.4493[/C][C]0.018183[/C][C]0.009092[/C][/ROW]
[ROW][C]M3[/C][C]-128.965513318953[/C][C]97.289058[/C][C]-1.3256[/C][C]0.191521[/C][C]0.095761[/C][/ROW]
[ROW][C]M4[/C][C]-123.616818973557[/C][C]97.359274[/C][C]-1.2697[/C][C]0.210578[/C][C]0.105289[/C][/ROW]
[ROW][C]M5[/C][C]-2.59336570780475[/C][C]96.208323[/C][C]-0.027[/C][C]0.978612[/C][C]0.489306[/C][/ROW]
[ROW][C]M6[/C][C]162.044705787931[/C][C]95.792379[/C][C]1.6916[/C][C]0.097483[/C][C]0.048741[/C][/ROW]
[ROW][C]M7[/C][C]139.940583095422[/C][C]96.022357[/C][C]1.4574[/C][C]0.151806[/C][C]0.075903[/C][/ROW]
[ROW][C]M8[/C][C]106.359047587325[/C][C]96.144766[/C][C]1.1062[/C][C]0.274375[/C][C]0.137188[/C][/ROW]
[ROW][C]M9[/C][C]36.4821454927739[/C][C]96.035892[/C][C]0.3799[/C][C]0.705783[/C][C]0.352891[/C][/ROW]
[ROW][C]M10[/C][C]3.39130681389371[/C][C]95.908536[/C][C]0.0354[/C][C]0.971946[/C][C]0.485973[/C][/ROW]
[ROW][C]M11[/C][C]68.7931662887606[/C][C]95.557346[/C][C]0.7199[/C][C]0.47522[/C][C]0.23761[/C][/ROW]
[ROW][C]t[/C][C]-4.30151865203991[/C][C]1.341897[/C][C]-3.2056[/C][C]0.002452[/C][C]0.001226[/C][/ROW]
[/TABLE]
Source: https://freestatistics.org/blog/index.php?pk=58170&T=2

Globally Unique Identifier (entire table): ba.freestatistics.org/blog/index.php?pk=58170&T=2

As an alternative you can also use a QR Code:  

The GUIDs for individual cells are displayed in the table below:

Multiple Linear Regression - Ordinary Least Squares
VariableParameterS.D.T-STATH0: parameter = 02-tail p-value1-tail p-value
(Intercept)-405.961252705834396.851738-1.0230.3116790.15584
`Landbouw-Mannen`2.672757595826220.14194618.829400
M1-101.42899579254396.857076-1.04720.3004780.150239
M2-236.17798837474296.428293-2.44930.0181830.009092
M3-128.96551331895397.289058-1.32560.1915210.095761
M4-123.61681897355797.359274-1.26970.2105780.105289
M5-2.5933657078047596.208323-0.0270.9786120.489306
M6162.04470578793195.7923791.69160.0974830.048741
M7139.94058309542296.0223571.45740.1518060.075903
M8106.35904758732596.1447661.10620.2743750.137188
M936.482145492773996.0358920.37990.7057830.352891
M103.3913068138937195.9085360.03540.9719460.485973
M1168.793166288760695.5573460.71990.475220.23761
t-4.301518652039911.341897-3.20560.0024520.001226


Multiple Linear Regression - Regression Statistics
Multiple R0.965428192773583
R-squared0.932051595402067
Adjusted R-squared0.912848785406999
F-TEST (value)48.5372503108371
F-TEST (DF numerator)13
F-TEST (DF denominator)46
p-value0
Multiple Linear Regression - Residual Statistics
Residual Standard Deviation151.063517683038
Sum Squared Residuals1049728.57323958

\begin{tabular}{lllllllll}
\hline
Multiple Linear Regression - Regression Statistics \tabularnewline
Multiple R & 0.965428192773583 \tabularnewline
R-squared & 0.932051595402067 \tabularnewline
Adjusted R-squared & 0.912848785406999 \tabularnewline
F-TEST (value) & 48.5372503108371 \tabularnewline
F-TEST (DF numerator) & 13 \tabularnewline
F-TEST (DF denominator) & 46 \tabularnewline
p-value & 0 \tabularnewline
Multiple Linear Regression - Residual Statistics \tabularnewline
Residual Standard Deviation & 151.063517683038 \tabularnewline
Sum Squared Residuals & 1049728.57323958 \tabularnewline
\hline
\end{tabular}
%Source: https://freestatistics.org/blog/index.php?pk=58170&T=3

[TABLE]
[ROW][C]Multiple Linear Regression - Regression Statistics[/C][/ROW]
[ROW][C]Multiple R[/C][C]0.965428192773583[/C][/ROW]
[ROW][C]R-squared[/C][C]0.932051595402067[/C][/ROW]
[ROW][C]Adjusted R-squared[/C][C]0.912848785406999[/C][/ROW]
[ROW][C]F-TEST (value)[/C][C]48.5372503108371[/C][/ROW]
[ROW][C]F-TEST (DF numerator)[/C][C]13[/C][/ROW]
[ROW][C]F-TEST (DF denominator)[/C][C]46[/C][/ROW]
[ROW][C]p-value[/C][C]0[/C][/ROW]
[ROW][C]Multiple Linear Regression - Residual Statistics[/C][/ROW]
[ROW][C]Residual Standard Deviation[/C][C]151.063517683038[/C][/ROW]
[ROW][C]Sum Squared Residuals[/C][C]1049728.57323958[/C][/ROW]
[/TABLE]
Source: https://freestatistics.org/blog/index.php?pk=58170&T=3

Globally Unique Identifier (entire table): ba.freestatistics.org/blog/index.php?pk=58170&T=3

As an alternative you can also use a QR Code:  

The GUIDs for individual cells are displayed in the table below:

Multiple Linear Regression - Regression Statistics
Multiple R0.965428192773583
R-squared0.932051595402067
Adjusted R-squared0.912848785406999
F-TEST (value)48.5372503108371
F-TEST (DF numerator)13
F-TEST (DF denominator)46
p-value0
Multiple Linear Regression - Residual Statistics
Residual Standard Deviation151.063517683038
Sum Squared Residuals1049728.57323958


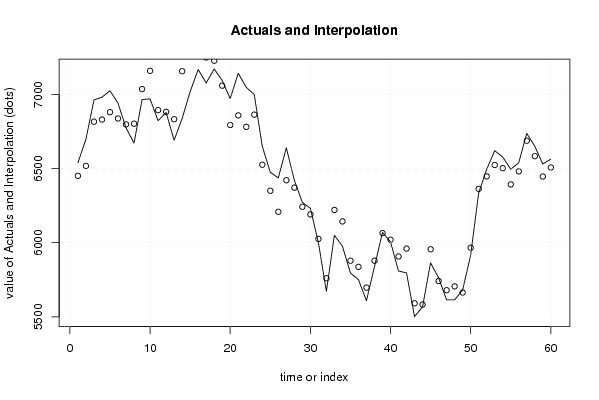
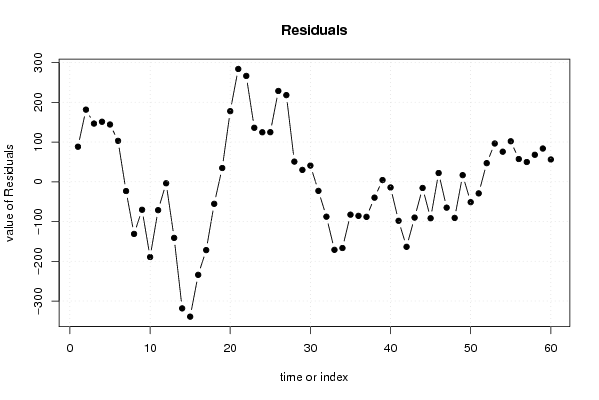
Multiple Linear Regression - Actuals, Interpolation, and Residuals
Time or IndexActualsInterpolationForecastResidualsPrediction Error
165396450.841769976988.1582300230973
266996517.59359362127181.406406378726
369626815.61585452034146.384145479663
469816830.02681819282150.973181807175
570246879.92981291088144.070187089118
669406837.13678847178102.863211528215
767746797.3673591481-23.3673591481044
866716802.24842652119-131.248426521188
969657035.43712929461-70.4371292946119
1069697158.41022771327-189.410227713265
1168226893.43414184529-71.434141845293
1268786881.8128816085-3.81288160849564
1366916832.21027667626-141.210276676263
1468377155.54682951996-318.546829519960
1570187357.34981696928-339.349816969279
1671677401.16111419586-234.161114195855
1770767247.93453163112-171.934531631120
1871717226.52356795863-55.5235679586325
1970937058.4617740352934.5382259647064
2069716793.39432422993177.605675770072
2171426858.1992984663283.800701533700
2270476780.71557719799266.284422802013
2369996863.19797878742135.802021212576
2466506525.50029185983124.499708140173
2564756350.27807992376124.721920076238
2664376208.5548110937228.445188906302
2766396421.04882892632217.951171073679
2864226371.3136102989850.6863897010209
2962726242.1418460966829.8581539033204
3062326191.3305488701040.669451129896
3160036025.94151254259-22.9415125425911
3256735760.87406273723-87.8740627372258
3360506221.24716115588-171.247161155879
3459776143.76343988757-166.763439887566
3557965878.78735401959-82.7873540195935
3657525837.76576022871-85.7657602287076
3756095697.28939703838-88.2893970383836
3858395878.96979730329-39.9697973032916
3960696064.736239177654.26376082234696
4060066020.34653574196-14.3465357419633
4158095907.21131711462-98.2113171146212
4257975960.63756612527-163.637566125268
4355025592.11895251496-90.1189525149625
4455685583.63623190891-15.6362319089144
4558645955.8083296653-91.8083296653023
4657645742.0139710098521.9860289901484
4756155680.16746242467-65.1674624246724
4856155705.96480852944-90.964808529442
4956815664.3804763846916.6195236153118
5059155966.33496846178-51.3349684617762
5163346363.24926040641-29.2492604064092
5264946447.1519215703846.848078429622
5366206523.782492246796.2175077533024
5465786502.3715285742175.6284714257895
5564956393.11040175905101.889598240952
5665386480.8469546027457.1530453972558
5767376687.308081417949.6919185820936
5866516583.0967841913367.9032158086694
5965306446.4130629230283.5869370769827
6065636506.9562577735356.0437422264723

\begin{tabular}{lllllllll}
\hline
Multiple Linear Regression - Actuals, Interpolation, and Residuals \tabularnewline
Time or Index & Actuals & InterpolationForecast & ResidualsPrediction Error \tabularnewline
1 & 6539 & 6450.8417699769 & 88.1582300230973 \tabularnewline
2 & 6699 & 6517.59359362127 & 181.406406378726 \tabularnewline
3 & 6962 & 6815.61585452034 & 146.384145479663 \tabularnewline
4 & 6981 & 6830.02681819282 & 150.973181807175 \tabularnewline
5 & 7024 & 6879.92981291088 & 144.070187089118 \tabularnewline
6 & 6940 & 6837.13678847178 & 102.863211528215 \tabularnewline
7 & 6774 & 6797.3673591481 & -23.3673591481044 \tabularnewline
8 & 6671 & 6802.24842652119 & -131.248426521188 \tabularnewline
9 & 6965 & 7035.43712929461 & -70.4371292946119 \tabularnewline
10 & 6969 & 7158.41022771327 & -189.410227713265 \tabularnewline
11 & 6822 & 6893.43414184529 & -71.434141845293 \tabularnewline
12 & 6878 & 6881.8128816085 & -3.81288160849564 \tabularnewline
13 & 6691 & 6832.21027667626 & -141.210276676263 \tabularnewline
14 & 6837 & 7155.54682951996 & -318.546829519960 \tabularnewline
15 & 7018 & 7357.34981696928 & -339.349816969279 \tabularnewline
16 & 7167 & 7401.16111419586 & -234.161114195855 \tabularnewline
17 & 7076 & 7247.93453163112 & -171.934531631120 \tabularnewline
18 & 7171 & 7226.52356795863 & -55.5235679586325 \tabularnewline
19 & 7093 & 7058.46177403529 & 34.5382259647064 \tabularnewline
20 & 6971 & 6793.39432422993 & 177.605675770072 \tabularnewline
21 & 7142 & 6858.1992984663 & 283.800701533700 \tabularnewline
22 & 7047 & 6780.71557719799 & 266.284422802013 \tabularnewline
23 & 6999 & 6863.19797878742 & 135.802021212576 \tabularnewline
24 & 6650 & 6525.50029185983 & 124.499708140173 \tabularnewline
25 & 6475 & 6350.27807992376 & 124.721920076238 \tabularnewline
26 & 6437 & 6208.5548110937 & 228.445188906302 \tabularnewline
27 & 6639 & 6421.04882892632 & 217.951171073679 \tabularnewline
28 & 6422 & 6371.31361029898 & 50.6863897010209 \tabularnewline
29 & 6272 & 6242.14184609668 & 29.8581539033204 \tabularnewline
30 & 6232 & 6191.33054887010 & 40.669451129896 \tabularnewline
31 & 6003 & 6025.94151254259 & -22.9415125425911 \tabularnewline
32 & 5673 & 5760.87406273723 & -87.8740627372258 \tabularnewline
33 & 6050 & 6221.24716115588 & -171.247161155879 \tabularnewline
34 & 5977 & 6143.76343988757 & -166.763439887566 \tabularnewline
35 & 5796 & 5878.78735401959 & -82.7873540195935 \tabularnewline
36 & 5752 & 5837.76576022871 & -85.7657602287076 \tabularnewline
37 & 5609 & 5697.28939703838 & -88.2893970383836 \tabularnewline
38 & 5839 & 5878.96979730329 & -39.9697973032916 \tabularnewline
39 & 6069 & 6064.73623917765 & 4.26376082234696 \tabularnewline
40 & 6006 & 6020.34653574196 & -14.3465357419633 \tabularnewline
41 & 5809 & 5907.21131711462 & -98.2113171146212 \tabularnewline
42 & 5797 & 5960.63756612527 & -163.637566125268 \tabularnewline
43 & 5502 & 5592.11895251496 & -90.1189525149625 \tabularnewline
44 & 5568 & 5583.63623190891 & -15.6362319089144 \tabularnewline
45 & 5864 & 5955.8083296653 & -91.8083296653023 \tabularnewline
46 & 5764 & 5742.01397100985 & 21.9860289901484 \tabularnewline
47 & 5615 & 5680.16746242467 & -65.1674624246724 \tabularnewline
48 & 5615 & 5705.96480852944 & -90.964808529442 \tabularnewline
49 & 5681 & 5664.38047638469 & 16.6195236153118 \tabularnewline
50 & 5915 & 5966.33496846178 & -51.3349684617762 \tabularnewline
51 & 6334 & 6363.24926040641 & -29.2492604064092 \tabularnewline
52 & 6494 & 6447.15192157038 & 46.848078429622 \tabularnewline
53 & 6620 & 6523.7824922467 & 96.2175077533024 \tabularnewline
54 & 6578 & 6502.37152857421 & 75.6284714257895 \tabularnewline
55 & 6495 & 6393.11040175905 & 101.889598240952 \tabularnewline
56 & 6538 & 6480.84695460274 & 57.1530453972558 \tabularnewline
57 & 6737 & 6687.3080814179 & 49.6919185820936 \tabularnewline
58 & 6651 & 6583.09678419133 & 67.9032158086694 \tabularnewline
59 & 6530 & 6446.41306292302 & 83.5869370769827 \tabularnewline
60 & 6563 & 6506.95625777353 & 56.0437422264723 \tabularnewline
\hline
\end{tabular}
%Source: https://freestatistics.org/blog/index.php?pk=58170&T=4

[TABLE]
[ROW][C]Multiple Linear Regression - Actuals, Interpolation, and Residuals[/C][/ROW]
[ROW][C]Time or Index[/C][C]Actuals[/C][C]InterpolationForecast[/C][C]ResidualsPrediction Error[/C][/ROW]
[ROW][C]1[/C][C]6539[/C][C]6450.8417699769[/C][C]88.1582300230973[/C][/ROW]
[ROW][C]2[/C][C]6699[/C][C]6517.59359362127[/C][C]181.406406378726[/C][/ROW]
[ROW][C]3[/C][C]6962[/C][C]6815.61585452034[/C][C]146.384145479663[/C][/ROW]
[ROW][C]4[/C][C]6981[/C][C]6830.02681819282[/C][C]150.973181807175[/C][/ROW]
[ROW][C]5[/C][C]7024[/C][C]6879.92981291088[/C][C]144.070187089118[/C][/ROW]
[ROW][C]6[/C][C]6940[/C][C]6837.13678847178[/C][C]102.863211528215[/C][/ROW]
[ROW][C]7[/C][C]6774[/C][C]6797.3673591481[/C][C]-23.3673591481044[/C][/ROW]
[ROW][C]8[/C][C]6671[/C][C]6802.24842652119[/C][C]-131.248426521188[/C][/ROW]
[ROW][C]9[/C][C]6965[/C][C]7035.43712929461[/C][C]-70.4371292946119[/C][/ROW]
[ROW][C]10[/C][C]6969[/C][C]7158.41022771327[/C][C]-189.410227713265[/C][/ROW]
[ROW][C]11[/C][C]6822[/C][C]6893.43414184529[/C][C]-71.434141845293[/C][/ROW]
[ROW][C]12[/C][C]6878[/C][C]6881.8128816085[/C][C]-3.81288160849564[/C][/ROW]
[ROW][C]13[/C][C]6691[/C][C]6832.21027667626[/C][C]-141.210276676263[/C][/ROW]
[ROW][C]14[/C][C]6837[/C][C]7155.54682951996[/C][C]-318.546829519960[/C][/ROW]
[ROW][C]15[/C][C]7018[/C][C]7357.34981696928[/C][C]-339.349816969279[/C][/ROW]
[ROW][C]16[/C][C]7167[/C][C]7401.16111419586[/C][C]-234.161114195855[/C][/ROW]
[ROW][C]17[/C][C]7076[/C][C]7247.93453163112[/C][C]-171.934531631120[/C][/ROW]
[ROW][C]18[/C][C]7171[/C][C]7226.52356795863[/C][C]-55.5235679586325[/C][/ROW]
[ROW][C]19[/C][C]7093[/C][C]7058.46177403529[/C][C]34.5382259647064[/C][/ROW]
[ROW][C]20[/C][C]6971[/C][C]6793.39432422993[/C][C]177.605675770072[/C][/ROW]
[ROW][C]21[/C][C]7142[/C][C]6858.1992984663[/C][C]283.800701533700[/C][/ROW]
[ROW][C]22[/C][C]7047[/C][C]6780.71557719799[/C][C]266.284422802013[/C][/ROW]
[ROW][C]23[/C][C]6999[/C][C]6863.19797878742[/C][C]135.802021212576[/C][/ROW]
[ROW][C]24[/C][C]6650[/C][C]6525.50029185983[/C][C]124.499708140173[/C][/ROW]
[ROW][C]25[/C][C]6475[/C][C]6350.27807992376[/C][C]124.721920076238[/C][/ROW]
[ROW][C]26[/C][C]6437[/C][C]6208.5548110937[/C][C]228.445188906302[/C][/ROW]
[ROW][C]27[/C][C]6639[/C][C]6421.04882892632[/C][C]217.951171073679[/C][/ROW]
[ROW][C]28[/C][C]6422[/C][C]6371.31361029898[/C][C]50.6863897010209[/C][/ROW]
[ROW][C]29[/C][C]6272[/C][C]6242.14184609668[/C][C]29.8581539033204[/C][/ROW]
[ROW][C]30[/C][C]6232[/C][C]6191.33054887010[/C][C]40.669451129896[/C][/ROW]
[ROW][C]31[/C][C]6003[/C][C]6025.94151254259[/C][C]-22.9415125425911[/C][/ROW]
[ROW][C]32[/C][C]5673[/C][C]5760.87406273723[/C][C]-87.8740627372258[/C][/ROW]
[ROW][C]33[/C][C]6050[/C][C]6221.24716115588[/C][C]-171.247161155879[/C][/ROW]
[ROW][C]34[/C][C]5977[/C][C]6143.76343988757[/C][C]-166.763439887566[/C][/ROW]
[ROW][C]35[/C][C]5796[/C][C]5878.78735401959[/C][C]-82.7873540195935[/C][/ROW]
[ROW][C]36[/C][C]5752[/C][C]5837.76576022871[/C][C]-85.7657602287076[/C][/ROW]
[ROW][C]37[/C][C]5609[/C][C]5697.28939703838[/C][C]-88.2893970383836[/C][/ROW]
[ROW][C]38[/C][C]5839[/C][C]5878.96979730329[/C][C]-39.9697973032916[/C][/ROW]
[ROW][C]39[/C][C]6069[/C][C]6064.73623917765[/C][C]4.26376082234696[/C][/ROW]
[ROW][C]40[/C][C]6006[/C][C]6020.34653574196[/C][C]-14.3465357419633[/C][/ROW]
[ROW][C]41[/C][C]5809[/C][C]5907.21131711462[/C][C]-98.2113171146212[/C][/ROW]
[ROW][C]42[/C][C]5797[/C][C]5960.63756612527[/C][C]-163.637566125268[/C][/ROW]
[ROW][C]43[/C][C]5502[/C][C]5592.11895251496[/C][C]-90.1189525149625[/C][/ROW]
[ROW][C]44[/C][C]5568[/C][C]5583.63623190891[/C][C]-15.6362319089144[/C][/ROW]
[ROW][C]45[/C][C]5864[/C][C]5955.8083296653[/C][C]-91.8083296653023[/C][/ROW]
[ROW][C]46[/C][C]5764[/C][C]5742.01397100985[/C][C]21.9860289901484[/C][/ROW]
[ROW][C]47[/C][C]5615[/C][C]5680.16746242467[/C][C]-65.1674624246724[/C][/ROW]
[ROW][C]48[/C][C]5615[/C][C]5705.96480852944[/C][C]-90.964808529442[/C][/ROW]
[ROW][C]49[/C][C]5681[/C][C]5664.38047638469[/C][C]16.6195236153118[/C][/ROW]
[ROW][C]50[/C][C]5915[/C][C]5966.33496846178[/C][C]-51.3349684617762[/C][/ROW]
[ROW][C]51[/C][C]6334[/C][C]6363.24926040641[/C][C]-29.2492604064092[/C][/ROW]
[ROW][C]52[/C][C]6494[/C][C]6447.15192157038[/C][C]46.848078429622[/C][/ROW]
[ROW][C]53[/C][C]6620[/C][C]6523.7824922467[/C][C]96.2175077533024[/C][/ROW]
[ROW][C]54[/C][C]6578[/C][C]6502.37152857421[/C][C]75.6284714257895[/C][/ROW]
[ROW][C]55[/C][C]6495[/C][C]6393.11040175905[/C][C]101.889598240952[/C][/ROW]
[ROW][C]56[/C][C]6538[/C][C]6480.84695460274[/C][C]57.1530453972558[/C][/ROW]
[ROW][C]57[/C][C]6737[/C][C]6687.3080814179[/C][C]49.6919185820936[/C][/ROW]
[ROW][C]58[/C][C]6651[/C][C]6583.09678419133[/C][C]67.9032158086694[/C][/ROW]
[ROW][C]59[/C][C]6530[/C][C]6446.41306292302[/C][C]83.5869370769827[/C][/ROW]
[ROW][C]60[/C][C]6563[/C][C]6506.95625777353[/C][C]56.0437422264723[/C][/ROW]
[/TABLE]
Source: https://freestatistics.org/blog/index.php?pk=58170&T=4

Globally Unique Identifier (entire table): ba.freestatistics.org/blog/index.php?pk=58170&T=4

As an alternative you can also use a QR Code:  

The GUIDs for individual cells are displayed in the table below:

Multiple Linear Regression - Actuals, Interpolation, and Residuals
Time or IndexActualsInterpolationForecastResidualsPrediction Error
165396450.841769976988.1582300230973
266996517.59359362127181.406406378726
369626815.61585452034146.384145479663
469816830.02681819282150.973181807175
570246879.92981291088144.070187089118
669406837.13678847178102.863211528215
767746797.3673591481-23.3673591481044
866716802.24842652119-131.248426521188
969657035.43712929461-70.4371292946119
1069697158.41022771327-189.410227713265
1168226893.43414184529-71.434141845293
1268786881.8128816085-3.81288160849564
1366916832.21027667626-141.210276676263
1468377155.54682951996-318.546829519960
1570187357.34981696928-339.349816969279
1671677401.16111419586-234.161114195855
1770767247.93453163112-171.934531631120
1871717226.52356795863-55.5235679586325
1970937058.4617740352934.5382259647064
2069716793.39432422993177.605675770072
2171426858.1992984663283.800701533700
2270476780.71557719799266.284422802013
2369996863.19797878742135.802021212576
2466506525.50029185983124.499708140173
2564756350.27807992376124.721920076238
2664376208.5548110937228.445188906302
2766396421.04882892632217.951171073679
2864226371.3136102989850.6863897010209
2962726242.1418460966829.8581539033204
3062326191.3305488701040.669451129896
3160036025.94151254259-22.9415125425911
3256735760.87406273723-87.8740627372258
3360506221.24716115588-171.247161155879
3459776143.76343988757-166.763439887566
3557965878.78735401959-82.7873540195935
3657525837.76576022871-85.7657602287076
3756095697.28939703838-88.2893970383836
3858395878.96979730329-39.9697973032916
3960696064.736239177654.26376082234696
4060066020.34653574196-14.3465357419633
4158095907.21131711462-98.2113171146212
4257975960.63756612527-163.637566125268
4355025592.11895251496-90.1189525149625
4455685583.63623190891-15.6362319089144
4558645955.8083296653-91.8083296653023
4657645742.0139710098521.9860289901484
4756155680.16746242467-65.1674624246724
4856155705.96480852944-90.964808529442
4956815664.3804763846916.6195236153118
5059155966.33496846178-51.3349684617762
5163346363.24926040641-29.2492604064092
5264946447.1519215703846.848078429622
5366206523.782492246796.2175077533024
5465786502.3715285742175.6284714257895
5564956393.11040175905101.889598240952
5665386480.8469546027457.1530453972558
5767376687.308081417949.6919185820936
5866516583.0967841913367.9032158086694
5965306446.4130629230283.5869370769827
6065636506.9562577735356.0437422264723


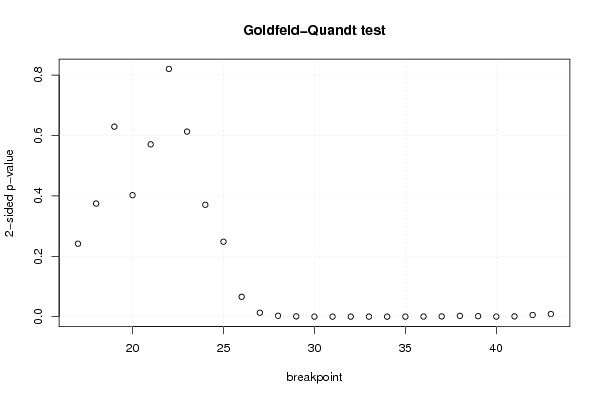
Goldfeld-Quandt test for Heteroskedasticity
p-valuesAlternative Hypothesis
breakpoint indexgreater2-sidedless
170.1208392144816550.2416784289633090.879160785518345
180.1872829694802630.3745659389605260.812717030519737
190.3146834937156250.629366987431250.685316506284375
200.2011976428555470.4023952857110950.798802357144452
210.285413011000980.570826022001960.71458698899902
220.4102611203643820.8205222407287630.589738879635618
230.3065336582557530.6130673165115070.693466341744247
240.8147368069304720.3705263861390560.185263193069528
250.8758624238017360.2482751523965270.124137576198264
260.9671141552596040.06577168948079160.0328858447403958
270.9934823909062120.01303521818757630.00651760909378813
280.9985097038351440.002980592329712790.00149029616485639
290.9995194973185280.0009610053629447840.000480502681472392
300.9999455758791260.0001088482417478175.44241208739086e-05
310.999959030084538.19398309385394e-054.09699154692697e-05
320.999957939194688.41216106393557e-054.20608053196779e-05
330.9999512201239379.75597521257433e-054.87798760628717e-05
340.9999768008442164.63983115672947e-052.31991557836474e-05
350.99993162536810.0001367492638020486.83746319010241e-05
360.9997984583730120.0004030832539757250.000201541626987862
370.9995832545454540.0008334909090915660.000416745454545783
380.9986887094386220.002622581122756450.00131129056137822
390.9991531414407240.001693717118551270.000846858559275634
400.9999170005362920.0001659989274154368.29994637077178e-05
410.9994905934289290.001018813142142560.000509406571071279
420.9972732480631420.005453503873715270.00272675193685764
430.9956318686762390.008736262647522680.00436813132376134

\begin{tabular}{lllllllll}
\hline
Goldfeld-Quandt test for Heteroskedasticity \tabularnewline
p-values & Alternative Hypothesis \tabularnewline
breakpoint index & greater & 2-sided & less \tabularnewline
17 & 0.120839214481655 & 0.241678428963309 & 0.879160785518345 \tabularnewline
18 & 0.187282969480263 & 0.374565938960526 & 0.812717030519737 \tabularnewline
19 & 0.314683493715625 & 0.62936698743125 & 0.685316506284375 \tabularnewline
20 & 0.201197642855547 & 0.402395285711095 & 0.798802357144452 \tabularnewline
21 & 0.28541301100098 & 0.57082602200196 & 0.71458698899902 \tabularnewline
22 & 0.410261120364382 & 0.820522240728763 & 0.589738879635618 \tabularnewline
23 & 0.306533658255753 & 0.613067316511507 & 0.693466341744247 \tabularnewline
24 & 0.814736806930472 & 0.370526386139056 & 0.185263193069528 \tabularnewline
25 & 0.875862423801736 & 0.248275152396527 & 0.124137576198264 \tabularnewline
26 & 0.967114155259604 & 0.0657716894807916 & 0.0328858447403958 \tabularnewline
27 & 0.993482390906212 & 0.0130352181875763 & 0.00651760909378813 \tabularnewline
28 & 0.998509703835144 & 0.00298059232971279 & 0.00149029616485639 \tabularnewline
29 & 0.999519497318528 & 0.000961005362944784 & 0.000480502681472392 \tabularnewline
30 & 0.999945575879126 & 0.000108848241747817 & 5.44241208739086e-05 \tabularnewline
31 & 0.99995903008453 & 8.19398309385394e-05 & 4.09699154692697e-05 \tabularnewline
32 & 0.99995793919468 & 8.41216106393557e-05 & 4.20608053196779e-05 \tabularnewline
33 & 0.999951220123937 & 9.75597521257433e-05 & 4.87798760628717e-05 \tabularnewline
34 & 0.999976800844216 & 4.63983115672947e-05 & 2.31991557836474e-05 \tabularnewline
35 & 0.9999316253681 & 0.000136749263802048 & 6.83746319010241e-05 \tabularnewline
36 & 0.999798458373012 & 0.000403083253975725 & 0.000201541626987862 \tabularnewline
37 & 0.999583254545454 & 0.000833490909091566 & 0.000416745454545783 \tabularnewline
38 & 0.998688709438622 & 0.00262258112275645 & 0.00131129056137822 \tabularnewline
39 & 0.999153141440724 & 0.00169371711855127 & 0.000846858559275634 \tabularnewline
40 & 0.999917000536292 & 0.000165998927415436 & 8.29994637077178e-05 \tabularnewline
41 & 0.999490593428929 & 0.00101881314214256 & 0.000509406571071279 \tabularnewline
42 & 0.997273248063142 & 0.00545350387371527 & 0.00272675193685764 \tabularnewline
43 & 0.995631868676239 & 0.00873626264752268 & 0.00436813132376134 \tabularnewline
\hline
\end{tabular}
%Source: https://freestatistics.org/blog/index.php?pk=58170&T=5

[TABLE]
[ROW][C]Goldfeld-Quandt test for Heteroskedasticity[/C][/ROW]
[ROW][C]p-values[/C][C]Alternative Hypothesis[/C][/ROW]
[ROW][C]breakpoint index[/C][C]greater[/C][C]2-sided[/C][C]less[/C][/ROW]
[ROW][C]17[/C][C]0.120839214481655[/C][C]0.241678428963309[/C][C]0.879160785518345[/C][/ROW]
[ROW][C]18[/C][C]0.187282969480263[/C][C]0.374565938960526[/C][C]0.812717030519737[/C][/ROW]
[ROW][C]19[/C][C]0.314683493715625[/C][C]0.62936698743125[/C][C]0.685316506284375[/C][/ROW]
[ROW][C]20[/C][C]0.201197642855547[/C][C]0.402395285711095[/C][C]0.798802357144452[/C][/ROW]
[ROW][C]21[/C][C]0.28541301100098[/C][C]0.57082602200196[/C][C]0.71458698899902[/C][/ROW]
[ROW][C]22[/C][C]0.410261120364382[/C][C]0.820522240728763[/C][C]0.589738879635618[/C][/ROW]
[ROW][C]23[/C][C]0.306533658255753[/C][C]0.613067316511507[/C][C]0.693466341744247[/C][/ROW]
[ROW][C]24[/C][C]0.814736806930472[/C][C]0.370526386139056[/C][C]0.185263193069528[/C][/ROW]
[ROW][C]25[/C][C]0.875862423801736[/C][C]0.248275152396527[/C][C]0.124137576198264[/C][/ROW]
[ROW][C]26[/C][C]0.967114155259604[/C][C]0.0657716894807916[/C][C]0.0328858447403958[/C][/ROW]
[ROW][C]27[/C][C]0.993482390906212[/C][C]0.0130352181875763[/C][C]0.00651760909378813[/C][/ROW]
[ROW][C]28[/C][C]0.998509703835144[/C][C]0.00298059232971279[/C][C]0.00149029616485639[/C][/ROW]
[ROW][C]29[/C][C]0.999519497318528[/C][C]0.000961005362944784[/C][C]0.000480502681472392[/C][/ROW]
[ROW][C]30[/C][C]0.999945575879126[/C][C]0.000108848241747817[/C][C]5.44241208739086e-05[/C][/ROW]
[ROW][C]31[/C][C]0.99995903008453[/C][C]8.19398309385394e-05[/C][C]4.09699154692697e-05[/C][/ROW]
[ROW][C]32[/C][C]0.99995793919468[/C][C]8.41216106393557e-05[/C][C]4.20608053196779e-05[/C][/ROW]
[ROW][C]33[/C][C]0.999951220123937[/C][C]9.75597521257433e-05[/C][C]4.87798760628717e-05[/C][/ROW]
[ROW][C]34[/C][C]0.999976800844216[/C][C]4.63983115672947e-05[/C][C]2.31991557836474e-05[/C][/ROW]
[ROW][C]35[/C][C]0.9999316253681[/C][C]0.000136749263802048[/C][C]6.83746319010241e-05[/C][/ROW]
[ROW][C]36[/C][C]0.999798458373012[/C][C]0.000403083253975725[/C][C]0.000201541626987862[/C][/ROW]
[ROW][C]37[/C][C]0.999583254545454[/C][C]0.000833490909091566[/C][C]0.000416745454545783[/C][/ROW]
[ROW][C]38[/C][C]0.998688709438622[/C][C]0.00262258112275645[/C][C]0.00131129056137822[/C][/ROW]
[ROW][C]39[/C][C]0.999153141440724[/C][C]0.00169371711855127[/C][C]0.000846858559275634[/C][/ROW]
[ROW][C]40[/C][C]0.999917000536292[/C][C]0.000165998927415436[/C][C]8.29994637077178e-05[/C][/ROW]
[ROW][C]41[/C][C]0.999490593428929[/C][C]0.00101881314214256[/C][C]0.000509406571071279[/C][/ROW]
[ROW][C]42[/C][C]0.997273248063142[/C][C]0.00545350387371527[/C][C]0.00272675193685764[/C][/ROW]
[ROW][C]43[/C][C]0.995631868676239[/C][C]0.00873626264752268[/C][C]0.00436813132376134[/C][/ROW]
[/TABLE]
Source: https://freestatistics.org/blog/index.php?pk=58170&T=5

Globally Unique Identifier (entire table): ba.freestatistics.org/blog/index.php?pk=58170&T=5

As an alternative you can also use a QR Code:  

The GUIDs for individual cells are displayed in the table below:

Goldfeld-Quandt test for Heteroskedasticity
p-valuesAlternative Hypothesis
breakpoint indexgreater2-sidedless
170.1208392144816550.2416784289633090.879160785518345
180.1872829694802630.3745659389605260.812717030519737
190.3146834937156250.629366987431250.685316506284375
200.2011976428555470.4023952857110950.798802357144452
210.285413011000980.570826022001960.71458698899902
220.4102611203643820.8205222407287630.589738879635618
230.3065336582557530.6130673165115070.693466341744247
240.8147368069304720.3705263861390560.185263193069528
250.8758624238017360.2482751523965270.124137576198264
260.9671141552596040.06577168948079160.0328858447403958
270.9934823909062120.01303521818757630.00651760909378813
280.9985097038351440.002980592329712790.00149029616485639
290.9995194973185280.0009610053629447840.000480502681472392
300.9999455758791260.0001088482417478175.44241208739086e-05
310.999959030084538.19398309385394e-054.09699154692697e-05
320.999957939194688.41216106393557e-054.20608053196779e-05
330.9999512201239379.75597521257433e-054.87798760628717e-05
340.9999768008442164.63983115672947e-052.31991557836474e-05
350.99993162536810.0001367492638020486.83746319010241e-05
360.9997984583730120.0004030832539757250.000201541626987862
370.9995832545454540.0008334909090915660.000416745454545783
380.9986887094386220.002622581122756450.00131129056137822
390.9991531414407240.001693717118551270.000846858559275634
400.9999170005362920.0001659989274154368.29994637077178e-05
410.9994905934289290.001018813142142560.000509406571071279
420.9972732480631420.005453503873715270.00272675193685764
430.9956318686762390.008736262647522680.00436813132376134


Meta Analysis of Goldfeld-Quandt test for Heteroskedasticity
Description# significant tests% significant testsOK/NOK
1% type I error level160.592592592592593NOK
5% type I error level170.62962962962963NOK
10% type I error level180.666666666666667NOK

\begin{tabular}{lllllllll}
\hline
Meta Analysis of Goldfeld-Quandt test for Heteroskedasticity \tabularnewline
Description & # significant tests & % significant tests & OK/NOK \tabularnewline
1% type I error level & 16 & 0.592592592592593 & NOK \tabularnewline
5% type I error level & 17 & 0.62962962962963 & NOK \tabularnewline
10% type I error level & 18 & 0.666666666666667 & NOK \tabularnewline
\hline
\end{tabular}
%Source: https://freestatistics.org/blog/index.php?pk=58170&T=6

[TABLE]
[ROW][C]Meta Analysis of Goldfeld-Quandt test for Heteroskedasticity[/C][/ROW]
[ROW][C]Description[/C][C]# significant tests[/C][C]% significant tests[/C][C]OK/NOK[/C][/ROW]
[ROW][C]1% type I error level[/C][C]16[/C][C]0.592592592592593[/C][C]NOK[/C][/ROW]
[ROW][C]5% type I error level[/C][C]17[/C][C]0.62962962962963[/C][C]NOK[/C][/ROW]
[ROW][C]10% type I error level[/C][C]18[/C][C]0.666666666666667[/C][C]NOK[/C][/ROW]
[/TABLE]
Source: https://freestatistics.org/blog/index.php?pk=58170&T=6

Globally Unique Identifier (entire table): ba.freestatistics.org/blog/index.php?pk=58170&T=6

As an alternative you can also use a QR Code:  

The GUIDs for individual cells are displayed in the table below:

Meta Analysis of Goldfeld-Quandt test for Heteroskedasticity
Description# significant tests% significant testsOK/NOK
1% type I error level160.592592592592593NOK
5% type I error level170.62962962962963NOK
10% type I error level180.666666666666667NOK


Parameters (Session):
par1 = 1 ; par2 = Include Monthly Dummies ; par3 = Linear Trend ;
Parameters (R input):
par1 = 1 ; par2 = Include Monthly Dummies ; par3 = Linear Trend ;
R code (references can be found in the software module):
library(lattice)
library(lmtest)
n25 <- 25 #minimum number of obs. for Goldfeld-Quandt test
par1 <- as.numeric(par1)
x <- t(y)
k <- length(x[1,])
n <- length(x[,1])
x1 <- cbind(x[,par1], x[,1:k!=par1])
mycolnames <- c(colnames(x)[par1], colnames(x)[1:k!=par1])
colnames(x1) <- mycolnames #colnames(x)[par1]
x <- x1
if (par3 == 'First Differences'){
x2 <- array(0, dim=c(n-1,k), dimnames=list(1:(n-1), paste('(1-B)',colnames(x),sep='')))
for (i in 1:n-1) {
for (j in 1:k) {
x2[i,j] <- x[i+1,j] - x[i,j]
}
}
x <- x2
}
if (par2 == 'Include Monthly Dummies'){
x2 <- array(0, dim=c(n,11), dimnames=list(1:n, paste('M', seq(1:11), sep ='')))
for (i in 1:11){
x2[seq(i,n,12),i] <- 1
}
x <- cbind(x, x2)
}
if (par2 == 'Include Quarterly Dummies'){
x2 <- array(0, dim=c(n,3), dimnames=list(1:n, paste('Q', seq(1:3), sep ='')))
for (i in 1:3){
x2[seq(i,n,4),i] <- 1
}
x <- cbind(x, x2)
}
k <- length(x[1,])
if (par3 == 'Linear Trend'){
x <- cbind(x, c(1:n))
colnames(x)[k+1] <- 't'
}
x
k <- length(x[1,])
df <- as.data.frame(x)
(mylm <- lm(df))
(mysum <- summary(mylm))
if (n > n25) {
kp3 <- k + 3
nmkm3 <- n - k - 3
gqarr <- array(NA, dim=c(nmkm3-kp3+1,3))
numgqtests <- 0
numsignificant1 <- 0
numsignificant5 <- 0
numsignificant10 <- 0
for (mypoint in kp3:nmkm3) {
j <- 0
numgqtests <- numgqtests + 1
for (myalt in c('greater', 'two.sided', 'less')) {
j <- j + 1
gqarr[mypoint-kp3+1,j] <- gqtest(mylm, point=mypoint, alternative=myalt)$p.value
}
if (gqarr[mypoint-kp3+1,2] < 0.01) numsignificant1 <- numsignificant1 + 1
if (gqarr[mypoint-kp3+1,2] < 0.05) numsignificant5 <- numsignificant5 + 1
if (gqarr[mypoint-kp3+1,2] < 0.10) numsignificant10 <- numsignificant10 + 1
}
gqarr
}
bitmap(file='test0.png')
plot(x[,1], type='l', main='Actuals and Interpolation', ylab='value of Actuals and Interpolation (dots)', xlab='time or index')
points(x[,1]-mysum$resid)
grid()
dev.off()
bitmap(file='test1.png')
plot(mysum$resid, type='b', pch=19, main='Residuals', ylab='value of Residuals', xlab='time or index')
grid()
dev.off()
bitmap(file='test2.png')
hist(mysum$resid, main='Residual Histogram', xlab='values of Residuals')
grid()
dev.off()
bitmap(file='test3.png')
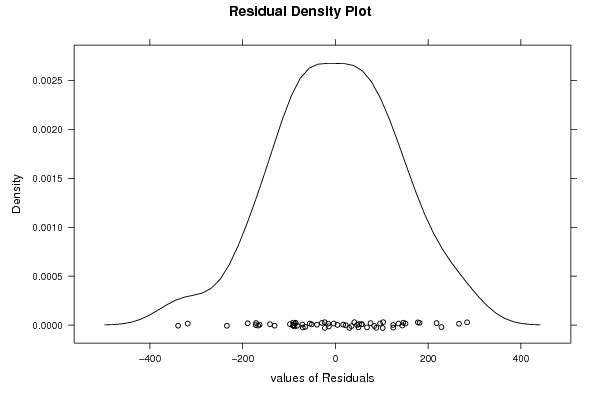
densityplot(~mysum$resid,col='black',main='Residual Density Plot', xlab='values of Residuals')
dev.off()
bitmap(file='test4.png')
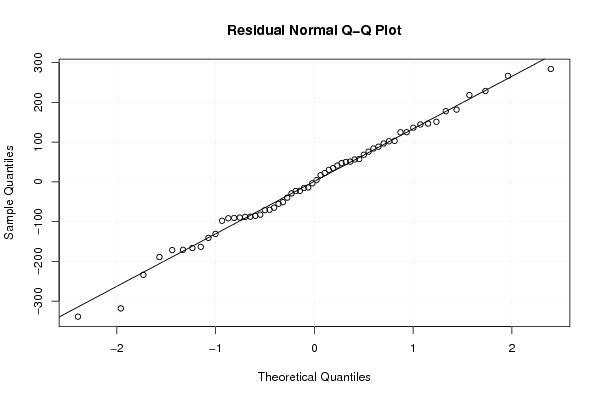
qqnorm(mysum$resid, main='Residual Normal Q-Q Plot')
qqline(mysum$resid)
grid()
dev.off()
(myerror <- as.ts(mysum$resid))
bitmap(file='test5.png')
dum <- cbind(lag(myerror,k=1),myerror)
dum
dum1 <- dum[2:length(myerror),]
dum1
z <- as.data.frame(dum1)
z
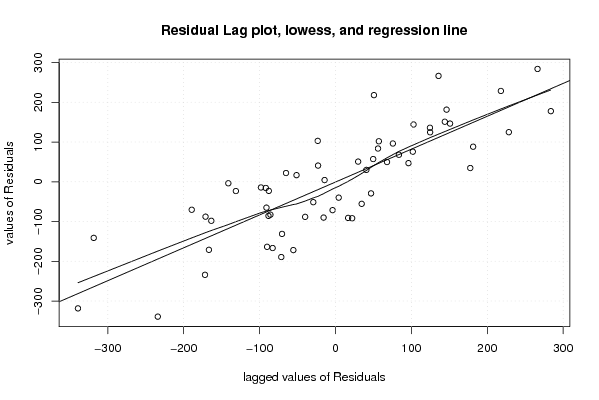
plot(z,main=paste('Residual Lag plot, lowess, and regression line'), ylab='values of Residuals', xlab='lagged values of Residuals')
lines(lowess(z))
abline(lm(z))
grid()
dev.off()
bitmap(file='test6.png')
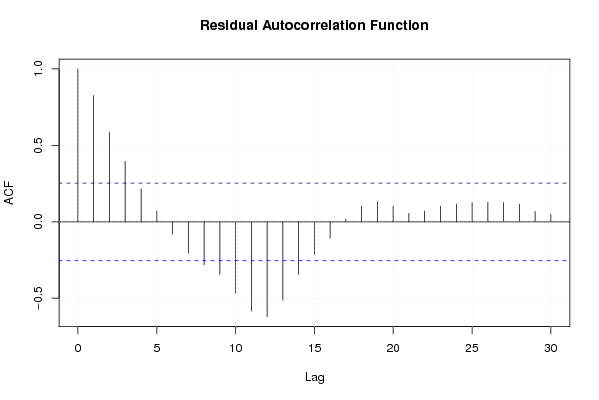
acf(mysum$resid, lag.max=length(mysum$resid)/2, main='Residual Autocorrelation Function')
grid()
dev.off()
bitmap(file='test7.png')
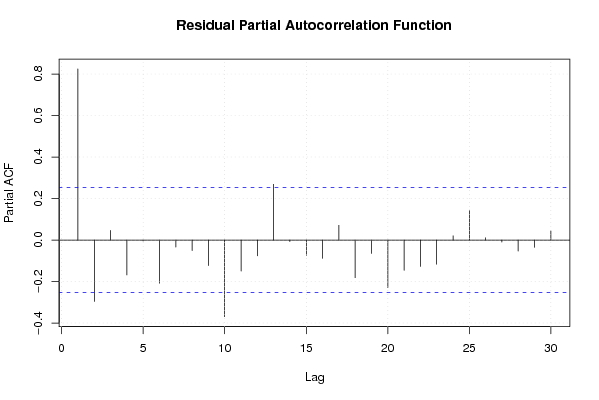
pacf(mysum$resid, lag.max=length(mysum$resid)/2, main='Residual Partial Autocorrelation Function')
grid()
dev.off()
bitmap(file='test8.png')
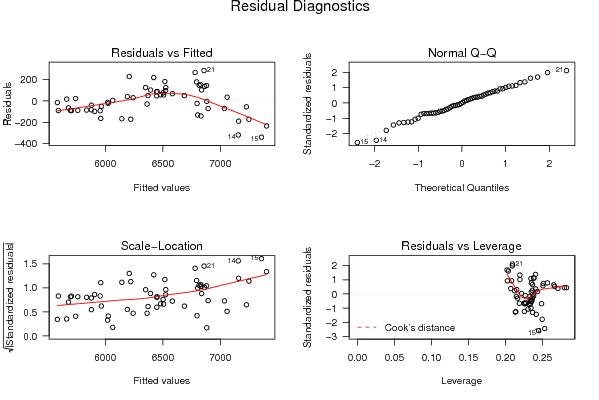
opar <- par(mfrow = c(2,2), oma = c(0, 0, 1.1, 0))
plot(mylm, las = 1, sub='Residual Diagnostics')
par(opar)
dev.off()
if (n > n25) {
bitmap(file='test9.png')
plot(kp3:nmkm3,gqarr[,2], main='Goldfeld-Quandt test',ylab='2-sided p-value',xlab='breakpoint')
grid()
dev.off()
}
load(file='createtable')
a<-table.start()
a<-table.row.start(a)
a<-table.element(a, 'Multiple Linear Regression - Estimated Regression Equation', 1, TRUE)
a<-table.row.end(a)
myeq <- colnames(x)[1]
myeq <- paste(myeq, '[t] = ', sep='')
for (i in 1:k){
if (mysum$coefficients[i,1] > 0) myeq <- paste(myeq, '+', '')
myeq <- paste(myeq, mysum$coefficients[i,1], sep=' ')
if (rownames(mysum$coefficients)[i] != '(Intercept)') {
myeq <- paste(myeq, rownames(mysum$coefficients)[i], sep='')
if (rownames(mysum$coefficients)[i] != 't') myeq <- paste(myeq, '[t]', sep='')
}
}
myeq <- paste(myeq, ' + e[t]')
a<-table.row.start(a)
a<-table.element(a, myeq)
a<-table.row.end(a)
a<-table.end(a)
table.save(a,file='mytable1.tab')
a<-table.start()
a<-table.row.start(a)
a<-table.element(a,hyperlink('ols1.htm','Multiple Linear Regression - Ordinary Least Squares',''), 6, TRUE)
a<-table.row.end(a)
a<-table.row.start(a)
a<-table.element(a,'Variable',header=TRUE)
a<-table.element(a,'Parameter',header=TRUE)
a<-table.element(a,'S.D.',header=TRUE)
a<-table.element(a,'T-STAT
H0: parameter = 0',header=TRUE)
a<-table.element(a,'2-tail p-value',header=TRUE)
a<-table.element(a,'1-tail p-value',header=TRUE)
a<-table.row.end(a)
for (i in 1:k){
a<-table.row.start(a)
a<-table.element(a,rownames(mysum$coefficients)[i],header=TRUE)
a<-table.element(a,mysum$coefficients[i,1])
a<-table.element(a, round(mysum$coefficients[i,2],6))
a<-table.element(a, round(mysum$coefficients[i,3],4))
a<-table.element(a, round(mysum$coefficients[i,4],6))
a<-table.element(a, round(mysum$coefficients[i,4]/2,6))
a<-table.row.end(a)
}
a<-table.end(a)
table.save(a,file='mytable2.tab')
a<-table.start()
a<-table.row.start(a)
a<-table.element(a, 'Multiple Linear Regression - Regression Statistics', 2, TRUE)
a<-table.row.end(a)
a<-table.row.start(a)
a<-table.element(a, 'Multiple R',1,TRUE)
a<-table.element(a, sqrt(mysum$r.squared))
a<-table.row.end(a)
a<-table.row.start(a)
a<-table.element(a, 'R-squared',1,TRUE)
a<-table.element(a, mysum$r.squared)
a<-table.row.end(a)
a<-table.row.start(a)
a<-table.element(a, 'Adjusted R-squared',1,TRUE)
a<-table.element(a, mysum$adj.r.squared)
a<-table.row.end(a)
a<-table.row.start(a)
a<-table.element(a, 'F-TEST (value)',1,TRUE)
a<-table.element(a, mysum$fstatistic[1])
a<-table.row.end(a)
a<-table.row.start(a)
a<-table.element(a, 'F-TEST (DF numerator)',1,TRUE)
a<-table.element(a, mysum$fstatistic[2])
a<-table.row.end(a)
a<-table.row.start(a)
a<-table.element(a, 'F-TEST (DF denominator)',1,TRUE)
a<-table.element(a, mysum$fstatistic[3])
a<-table.row.end(a)
a<-table.row.start(a)
a<-table.element(a, 'p-value',1,TRUE)
a<-table.element(a, 1-pf(mysum$fstatistic[1],mysum$fstatistic[2],mysum$fstatistic[3]))
a<-table.row.end(a)
a<-table.row.start(a)
a<-table.element(a, 'Multiple Linear Regression - Residual Statistics', 2, TRUE)
a<-table.row.end(a)
a<-table.row.start(a)
a<-table.element(a, 'Residual Standard Deviation',1,TRUE)
a<-table.element(a, mysum$sigma)
a<-table.row.end(a)
a<-table.row.start(a)
a<-table.element(a, 'Sum Squared Residuals',1,TRUE)
a<-table.element(a, sum(myerror*myerror))
a<-table.row.end(a)
a<-table.end(a)
table.save(a,file='mytable3.tab')
a<-table.start()
a<-table.row.start(a)
a<-table.element(a, 'Multiple Linear Regression - Actuals, Interpolation, and Residuals', 4, TRUE)
a<-table.row.end(a)
a<-table.row.start(a)
a<-table.element(a, 'Time or Index', 1, TRUE)
a<-table.element(a, 'Actuals', 1, TRUE)
a<-table.element(a, 'Interpolation
Forecast', 1, TRUE)
a<-table.element(a, 'Residuals
Prediction Error', 1, TRUE)
a<-table.row.end(a)
for (i in 1:n) {
a<-table.row.start(a)
a<-table.element(a,i, 1, TRUE)
a<-table.element(a,x[i])
a<-table.element(a,x[i]-mysum$resid[i])
a<-table.element(a,mysum$resid[i])
a<-table.row.end(a)
}
a<-table.end(a)
table.save(a,file='mytable4.tab')
if (n > n25) {
a<-table.start()
a<-table.row.start(a)
a<-table.element(a,'Goldfeld-Quandt test for Heteroskedasticity',4,TRUE)
a<-table.row.end(a)
a<-table.row.start(a)
a<-table.element(a,'p-values',header=TRUE)
a<-table.element(a,'Alternative Hypothesis',3,header=TRUE)
a<-table.row.end(a)
a<-table.row.start(a)
a<-table.element(a,'breakpoint index',header=TRUE)
a<-table.element(a,'greater',header=TRUE)
a<-table.element(a,'2-sided',header=TRUE)
a<-table.element(a,'less',header=TRUE)
a<-table.row.end(a)
for (mypoint in kp3:nmkm3) {
a<-table.row.start(a)
a<-table.element(a,mypoint,header=TRUE)
a<-table.element(a,gqarr[mypoint-kp3+1,1])
a<-table.element(a,gqarr[mypoint-kp3+1,2])
a<-table.element(a,gqarr[mypoint-kp3+1,3])
a<-table.row.end(a)
}
a<-table.end(a)
table.save(a,file='mytable5.tab')
a<-table.start()
a<-table.row.start(a)
a<-table.element(a,'Meta Analysis of Goldfeld-Quandt test for Heteroskedasticity',4,TRUE)
a<-table.row.end(a)
a<-table.row.start(a)
a<-table.element(a,'Description',header=TRUE)
a<-table.element(a,'# significant tests',header=TRUE)
a<-table.element(a,'% significant tests',header=TRUE)
a<-table.element(a,'OK/NOK',header=TRUE)
a<-table.row.end(a)
a<-table.row.start(a)
a<-table.element(a,'1% type I error level',header=TRUE)
a<-table.element(a,numsignificant1)
a<-table.element(a,numsignificant1/numgqtests)
if (numsignificant1/numgqtests < 0.01) dum <- 'OK' else dum <- 'NOK'
a<-table.element(a,dum)
a<-table.row.end(a)
a<-table.row.start(a)
a<-table.element(a,'5% type I error level',header=TRUE)
a<-table.element(a,numsignificant5)
a<-table.element(a,numsignificant5/numgqtests)
if (numsignificant5/numgqtests < 0.05) dum <- 'OK' else dum <- 'NOK'
a<-table.element(a,dum)
a<-table.row.end(a)
a<-table.row.start(a)
a<-table.element(a,'10% type I error level',header=TRUE)
a<-table.element(a,numsignificant10)
a<-table.element(a,numsignificant10/numgqtests)
if (numsignificant10/numgqtests < 0.1) dum <- 'OK' else dum <- 'NOK'
a<-table.element(a,dum)
a<-table.row.end(a)
a<-table.end(a)
table.save(a,file='mytable6.tab')
}