| Multiple Linear Regression - Estimated Regression Equation |
| Voeding-Mannen[t] = -405.961252705834 + 2.67275759582622`Landbouw-Mannen`[t] -101.428995792543M1[t] -236.177988374742M2[t] -128.965513318953M3[t] -123.616818973557M4[t] -2.59336570780475M5[t] + 162.044705787931M6[t] + 139.940583095422M7[t] + 106.359047587325M8[t] + 36.4821454927739M9[t] + 3.39130681389371M10[t] + 68.7931662887606M11[t] -4.30151865203991t + e[t] |
| Multiple Linear Regression - Ordinary Least Squares | |||||
| Variable | Parameter | S.D. | T-STAT H0: parameter = 0 | 2-tail p-value | 1-tail p-value |
| (Intercept) | -405.961252705834 | 396.851738 | -1.023 | 0.311679 | 0.15584 |
| `Landbouw-Mannen` | 2.67275759582622 | 0.141946 | 18.8294 | 0 | 0 |
| M1 | -101.428995792543 | 96.857076 | -1.0472 | 0.300478 | 0.150239 |
| M2 | -236.177988374742 | 96.428293 | -2.4493 | 0.018183 | 0.009092 |
| M3 | -128.965513318953 | 97.289058 | -1.3256 | 0.191521 | 0.095761 |
| M4 | -123.616818973557 | 97.359274 | -1.2697 | 0.210578 | 0.105289 |
| M5 | -2.59336570780475 | 96.208323 | -0.027 | 0.978612 | 0.489306 |
| M6 | 162.044705787931 | 95.792379 | 1.6916 | 0.097483 | 0.048741 |
| M7 | 139.940583095422 | 96.022357 | 1.4574 | 0.151806 | 0.075903 |
| M8 | 106.359047587325 | 96.144766 | 1.1062 | 0.274375 | 0.137188 |
| M9 | 36.4821454927739 | 96.035892 | 0.3799 | 0.705783 | 0.352891 |
| M10 | 3.39130681389371 | 95.908536 | 0.0354 | 0.971946 | 0.485973 |
| M11 | 68.7931662887606 | 95.557346 | 0.7199 | 0.47522 | 0.23761 |
| t | -4.30151865203991 | 1.341897 | -3.2056 | 0.002452 | 0.001226 |
| Multiple Linear Regression - Regression Statistics | |
| Multiple R | 0.965428192773583 |
| R-squared | 0.932051595402067 |
| Adjusted R-squared | 0.912848785406999 |
| F-TEST (value) | 48.5372503108371 |
| F-TEST (DF numerator) | 13 |
| F-TEST (DF denominator) | 46 |
| p-value | 0 |
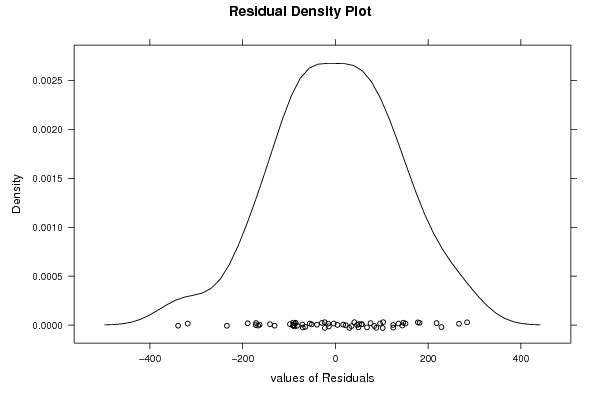
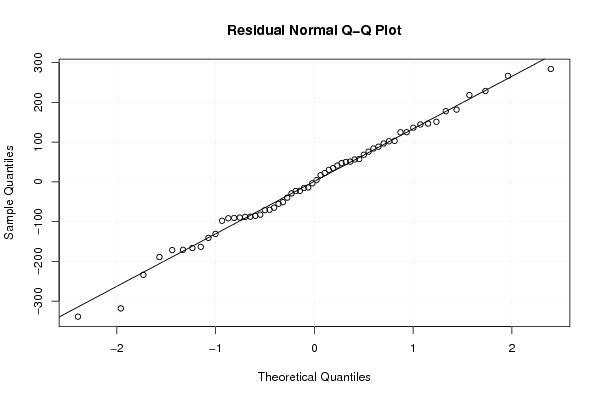
| Multiple Linear Regression - Residual Statistics | |
| Residual Standard Deviation | 151.063517683038 |
| Sum Squared Residuals | 1049728.57323958 |
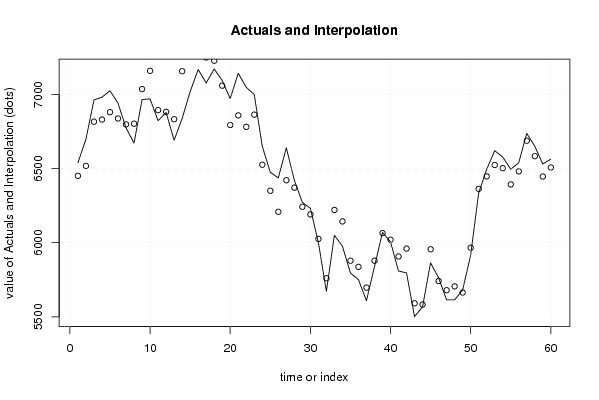
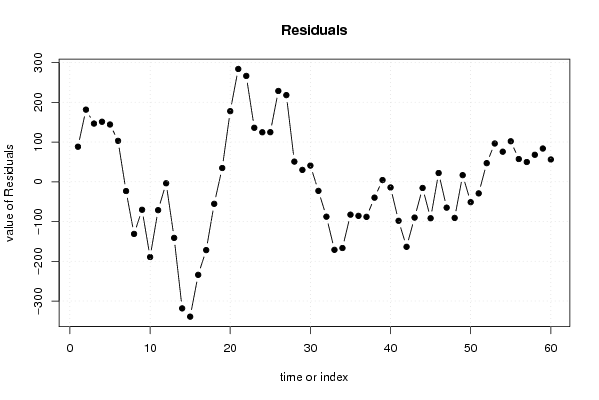
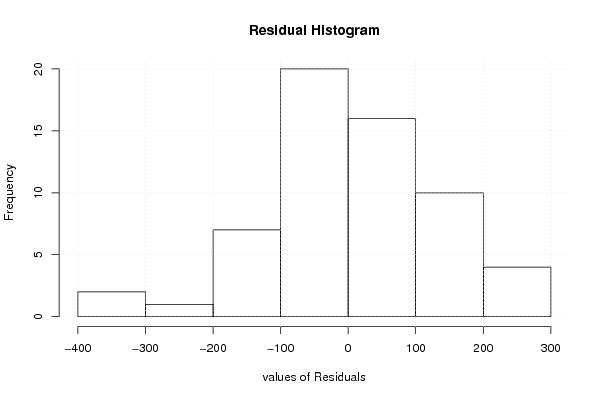
| Multiple Linear Regression - Actuals, Interpolation, and Residuals | |||
| Time or Index | Actuals | Interpolation Forecast | Residuals Prediction Error |
| 1 | 6539 | 6450.8417699769 | 88.1582300230973 |
| 2 | 6699 | 6517.59359362127 | 181.406406378726 |
| 3 | 6962 | 6815.61585452034 | 146.384145479663 |
| 4 | 6981 | 6830.02681819282 | 150.973181807175 |
| 5 | 7024 | 6879.92981291088 | 144.070187089118 |
| 6 | 6940 | 6837.13678847178 | 102.863211528215 |
| 7 | 6774 | 6797.3673591481 | -23.3673591481044 |
| 8 | 6671 | 6802.24842652119 | -131.248426521188 |
| 9 | 6965 | 7035.43712929461 | -70.4371292946119 |
| 10 | 6969 | 7158.41022771327 | -189.410227713265 |
| 11 | 6822 | 6893.43414184529 | -71.434141845293 |
| 12 | 6878 | 6881.8128816085 | -3.81288160849564 |
| 13 | 6691 | 6832.21027667626 | -141.210276676263 |
| 14 | 6837 | 7155.54682951996 | -318.546829519960 |
| 15 | 7018 | 7357.34981696928 | -339.349816969279 |
| 16 | 7167 | 7401.16111419586 | -234.161114195855 |
| 17 | 7076 | 7247.93453163112 | -171.934531631120 |
| 18 | 7171 | 7226.52356795863 | -55.5235679586325 |
| 19 | 7093 | 7058.46177403529 | 34.5382259647064 |
| 20 | 6971 | 6793.39432422993 | 177.605675770072 |
| 21 | 7142 | 6858.1992984663 | 283.800701533700 |
| 22 | 7047 | 6780.71557719799 | 266.284422802013 |
| 23 | 6999 | 6863.19797878742 | 135.802021212576 |
| 24 | 6650 | 6525.50029185983 | 124.499708140173 |
| 25 | 6475 | 6350.27807992376 | 124.721920076238 |
| 26 | 6437 | 6208.5548110937 | 228.445188906302 |
| 27 | 6639 | 6421.04882892632 | 217.951171073679 |
| 28 | 6422 | 6371.31361029898 | 50.6863897010209 |
| 29 | 6272 | 6242.14184609668 | 29.8581539033204 |
| 30 | 6232 | 6191.33054887010 | 40.669451129896 |
| 31 | 6003 | 6025.94151254259 | -22.9415125425911 |
| 32 | 5673 | 5760.87406273723 | -87.8740627372258 |
| 33 | 6050 | 6221.24716115588 | -171.247161155879 |
| 34 | 5977 | 6143.76343988757 | -166.763439887566 |
| 35 | 5796 | 5878.78735401959 | -82.7873540195935 |
| 36 | 5752 | 5837.76576022871 | -85.7657602287076 |
| 37 | 5609 | 5697.28939703838 | -88.2893970383836 |
| 38 | 5839 | 5878.96979730329 | -39.9697973032916 |
| 39 | 6069 | 6064.73623917765 | 4.26376082234696 |
| 40 | 6006 | 6020.34653574196 | -14.3465357419633 |
| 41 | 5809 | 5907.21131711462 | -98.2113171146212 |
| 42 | 5797 | 5960.63756612527 | -163.637566125268 |
| 43 | 5502 | 5592.11895251496 | -90.1189525149625 |
| 44 | 5568 | 5583.63623190891 | -15.6362319089144 |
| 45 | 5864 | 5955.8083296653 | -91.8083296653023 |
| 46 | 5764 | 5742.01397100985 | 21.9860289901484 |
| 47 | 5615 | 5680.16746242467 | -65.1674624246724 |
| 48 | 5615 | 5705.96480852944 | -90.964808529442 |
| 49 | 5681 | 5664.38047638469 | 16.6195236153118 |
| 50 | 5915 | 5966.33496846178 | -51.3349684617762 |
| 51 | 6334 | 6363.24926040641 | -29.2492604064092 |
| 52 | 6494 | 6447.15192157038 | 46.848078429622 |
| 53 | 6620 | 6523.7824922467 | 96.2175077533024 |
| 54 | 6578 | 6502.37152857421 | 75.6284714257895 |
| 55 | 6495 | 6393.11040175905 | 101.889598240952 |
| 56 | 6538 | 6480.84695460274 | 57.1530453972558 |
| 57 | 6737 | 6687.3080814179 | 49.6919185820936 |
| 58 | 6651 | 6583.09678419133 | 67.9032158086694 |
| 59 | 6530 | 6446.41306292302 | 83.5869370769827 |
| 60 | 6563 | 6506.95625777353 | 56.0437422264723 |
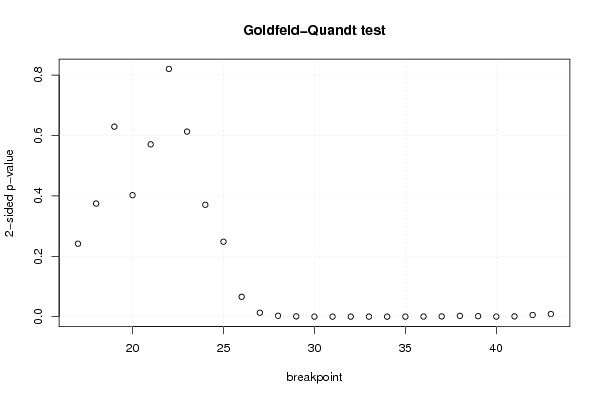
| Goldfeld-Quandt test for Heteroskedasticity | |||
| p-values | Alternative Hypothesis | ||
| breakpoint index | greater | 2-sided | less |
| 17 | 0.120839214481655 | 0.241678428963309 | 0.879160785518345 |
| 18 | 0.187282969480263 | 0.374565938960526 | 0.812717030519737 |
| 19 | 0.314683493715625 | 0.62936698743125 | 0.685316506284375 |
| 20 | 0.201197642855547 | 0.402395285711095 | 0.798802357144452 |
| 21 | 0.28541301100098 | 0.57082602200196 | 0.71458698899902 |
| 22 | 0.410261120364382 | 0.820522240728763 | 0.589738879635618 |
| 23 | 0.306533658255753 | 0.613067316511507 | 0.693466341744247 |
| 24 | 0.814736806930472 | 0.370526386139056 | 0.185263193069528 |
| 25 | 0.875862423801736 | 0.248275152396527 | 0.124137576198264 |
| 26 | 0.967114155259604 | 0.0657716894807916 | 0.0328858447403958 |
| 27 | 0.993482390906212 | 0.0130352181875763 | 0.00651760909378813 |
| 28 | 0.998509703835144 | 0.00298059232971279 | 0.00149029616485639 |
| 29 | 0.999519497318528 | 0.000961005362944784 | 0.000480502681472392 |
| 30 | 0.999945575879126 | 0.000108848241747817 | 5.44241208739086e-05 |
| 31 | 0.99995903008453 | 8.19398309385394e-05 | 4.09699154692697e-05 |
| 32 | 0.99995793919468 | 8.41216106393557e-05 | 4.20608053196779e-05 |
| 33 | 0.999951220123937 | 9.75597521257433e-05 | 4.87798760628717e-05 |
| 34 | 0.999976800844216 | 4.63983115672947e-05 | 2.31991557836474e-05 |
| 35 | 0.9999316253681 | 0.000136749263802048 | 6.83746319010241e-05 |
| 36 | 0.999798458373012 | 0.000403083253975725 | 0.000201541626987862 |
| 37 | 0.999583254545454 | 0.000833490909091566 | 0.000416745454545783 |
| 38 | 0.998688709438622 | 0.00262258112275645 | 0.00131129056137822 |
| 39 | 0.999153141440724 | 0.00169371711855127 | 0.000846858559275634 |
| 40 | 0.999917000536292 | 0.000165998927415436 | 8.29994637077178e-05 |
| 41 | 0.999490593428929 | 0.00101881314214256 | 0.000509406571071279 |
| 42 | 0.997273248063142 | 0.00545350387371527 | 0.00272675193685764 |
| 43 | 0.995631868676239 | 0.00873626264752268 | 0.00436813132376134 |
| Meta Analysis of Goldfeld-Quandt test for Heteroskedasticity | |||
| Description | # significant tests | % significant tests | OK/NOK |
| 1% type I error level | 16 | 0.592592592592593 | NOK |
| 5% type I error level | 17 | 0.62962962962963 | NOK |
| 10% type I error level | 18 | 0.666666666666667 | NOK |