| Multiple Linear Regression - Estimated Regression Equation |
| Y[t] = + 2.16355186150491e-14 -5.16431325155128e-16X[t] + 1.59090058226580e-16Y1[t] -7.92762271926817e-17Y2[t] -4.19119738909473e-16Y3[t] + 1Y4[t] -4.8940746873282e-16M1[t] -6.66523909077379e-16M2[t] + 5.34026133594919e-16M3[t] + 2.1568677450766e-16M4[t] + 2.34962547286129e-16M5[t] + 6.20006976066222e-15M6[t] + 8.96894589098686e-16M7[t] + 1.85692333379998e-16M8[t] + 7.64820214041699e-16M9[t] -2.31022629128203e-16M10[t] -7.89915010542167e-17M11[t] + 6.3286818349455e-18t + e[t] |
| Multiple Linear Regression - Ordinary Least Squares | |||||
| Variable | Parameter | S.D. | T-STAT H0: parameter = 0 | 2-tail p-value | 1-tail p-value |
| (Intercept) | 2.16355186150491e-14 | 0 | 0.2491 | 0.804576 | 0.402288 |
| X | -5.16431325155128e-16 | 0 | -0.5742 | 0.569073 | 0.284536 |
| Y1 | 1.59090058226580e-16 | 0 | 2.5368 | 0.015192 | 0.007596 |
| Y2 | -7.92762271926817e-17 | 0 | -0.8619 | 0.393866 | 0.196933 |
| Y3 | -4.19119738909473e-16 | 0 | -4.4066 | 7.7e-05 | 3.8e-05 |
| Y4 | 1 | 0 | 13886012447109426 | 0 | 0 |
| M1 | -4.8940746873282e-16 | 0 | -0.1833 | 0.855494 | 0.427747 |
| M2 | -6.66523909077379e-16 | 0 | -0.2464 | 0.806655 | 0.403328 |
| M3 | 5.34026133594919e-16 | 0 | 0.1937 | 0.847402 | 0.423701 |
| M4 | 2.1568677450766e-16 | 0 | 0.0643 | 0.949052 | 0.474526 |
| M5 | 2.34962547286129e-16 | 0 | 0.0877 | 0.930515 | 0.465257 |
| M6 | 6.20006976066222e-15 | 0 | 2.3502 | 0.023781 | 0.011891 |
| M7 | 8.96894589098686e-16 | 0 | 0.3245 | 0.747233 | 0.373616 |
| M8 | 1.85692333379998e-16 | 0 | 0.0653 | 0.948242 | 0.474121 |
| M9 | 7.64820214041699e-16 | 0 | 0.2826 | 0.778967 | 0.389483 |
| M10 | -2.31022629128203e-16 | 0 | -0.0744 | 0.941031 | 0.470515 |
| M11 | -7.89915010542167e-17 | 0 | -0.0276 | 0.978109 | 0.489054 |
| t | 6.3286818349455e-18 | 0 | 0.0373 | 0.970395 | 0.485197 |
| Multiple Linear Regression - Regression Statistics | |
| Multiple R | 1 |
| R-squared | 1 |
| Adjusted R-squared | 1 |
| F-TEST (value) | 4.52444903618255e+32 |
| F-TEST (DF numerator) | 17 |
| F-TEST (DF denominator) | 40 |
| p-value | 0 |
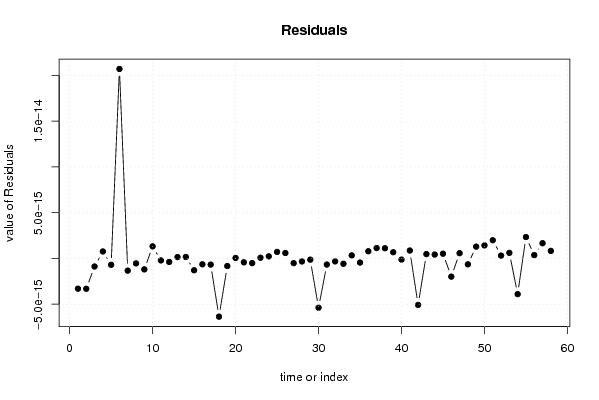
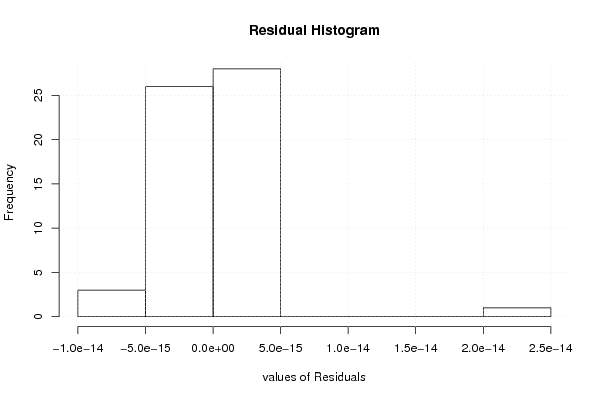
| Multiple Linear Regression - Residual Statistics | |
| Residual Standard Deviation | 3.87735021444872e-15 |
| Sum Squared Residuals | 6.0135378741942e-28 |
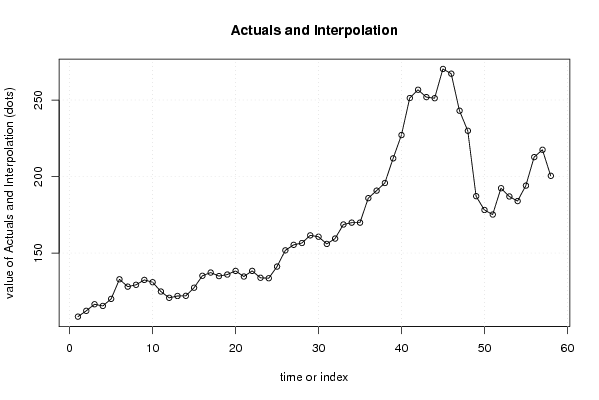
| Multiple Linear Regression - Actuals, Interpolation, and Residuals | |||
| Time or Index | Actuals | Interpolation Forecast | Residuals Prediction Error |
| 1 | 108.5 | 108.5 | -3.29839737165348e-15 |
| 2 | 112.3 | 112.3 | -3.31188053484745e-15 |
| 3 | 116.6 | 116.6 | -8.7702089918852e-16 |
| 4 | 115.5 | 115.5 | 7.66183023220705e-16 |
| 5 | 120.1 | 120.1 | -6.90367191252025e-16 |
| 6 | 132.9 | 132.9 | 2.07067720305347e-14 |
| 7 | 128.1 | 128.1 | -1.32810811567139e-15 |
| 8 | 129.3 | 129.3 | -5.37845267868493e-16 |
| 9 | 132.5 | 132.5 | -1.19166692565931e-15 |
| 10 | 131 | 131 | 1.32277310495672e-15 |
| 11 | 124.9 | 124.9 | -2.12531021700543e-16 |
| 12 | 120.8 | 120.8 | -3.78968191426067e-16 |
| 13 | 122 | 122 | 1.51822237918604e-16 |
| 14 | 122.1 | 122.1 | 1.63671240851298e-16 |
| 15 | 127.4 | 127.4 | -1.28941037949949e-15 |
| 16 | 135.2 | 135.2 | -6.37088015179162e-16 |
| 17 | 137.3 | 137.3 | -6.66357580906015e-16 |
| 18 | 135 | 135 | -6.35588633253829e-15 |
| 19 | 136 | 136 | -8.2670096221065e-16 |
| 20 | 138.4 | 138.4 | 5.89012223373722e-17 |
| 21 | 134.7 | 134.7 | -4.19994524298056e-16 |
| 22 | 138.4 | 138.4 | -5.08821517908562e-16 |
| 23 | 133.9 | 133.9 | 8.21087703693914e-17 |
| 24 | 133.6 | 133.6 | 2.31936918400157e-16 |
| 25 | 141.2 | 141.2 | 7.14767053144733e-16 |
| 26 | 151.8 | 151.8 | 5.97773544280951e-16 |
| 27 | 155.4 | 155.4 | -5.10718457794993e-16 |
| 28 | 156.6 | 156.6 | -3.24521495346969e-16 |
| 29 | 161.6 | 161.6 | -1.27127440080524e-16 |
| 30 | 160.7 | 160.7 | -5.38004752110076e-15 |
| 31 | 156 | 156 | -6.64972065519288e-16 |
| 32 | 159.5 | 159.5 | -3.19322440161124e-16 |
| 33 | 168.7 | 168.7 | -5.78494052175696e-16 |
| 34 | 169.9 | 169.9 | 3.38287751156981e-16 |
| 35 | 169.9 | 169.9 | -4.46588138668727e-16 |
| 36 | 185.9 | 185.9 | 7.88101720294903e-16 |
| 37 | 190.8 | 190.8 | 1.13786614676900e-15 |
| 38 | 195.8 | 195.8 | 1.12055944976226e-15 |
| 39 | 211.9 | 211.9 | 6.81518275785871e-16 |
| 40 | 227.1 | 227.1 | -1.21550103846306e-16 |
| 41 | 251.3 | 251.3 | 8.68429397992201e-16 |
| 42 | 256.7 | 256.7 | -5.07283619535942e-15 |
| 43 | 251.9 | 251.9 | 4.7903201794652e-16 |
| 44 | 251.2 | 251.2 | 4.28768690935868e-16 |
| 45 | 270.3 | 270.3 | 5.22020997050886e-16 |
| 46 | 267.2 | 267.2 | -1.98233932561599e-15 |
| 47 | 243 | 243 | 5.77010389999881e-16 |
| 48 | 229.9 | 229.9 | -6.4107044726898e-16 |
| 49 | 187.2 | 187.2 | 1.29394193382115e-15 |
| 50 | 178.2 | 178.2 | 1.42987629995295e-15 |
| 51 | 175.2 | 175.2 | 1.99563146069713e-15 |
| 52 | 192.4 | 192.4 | 3.1697659115173e-16 |
| 53 | 187 | 187 | 6.15422814246362e-16 |
| 54 | 184 | 184 | -3.89800198153627e-15 |
| 55 | 194.1 | 194.1 | 2.34074912545480e-15 |
| 56 | 212.7 | 212.7 | 3.6949779475638e-16 |
| 57 | 217.5 | 217.5 | 1.66813450508217e-15 |
| 58 | 200.5 | 200.5 | 8.30099987410848e-16 |
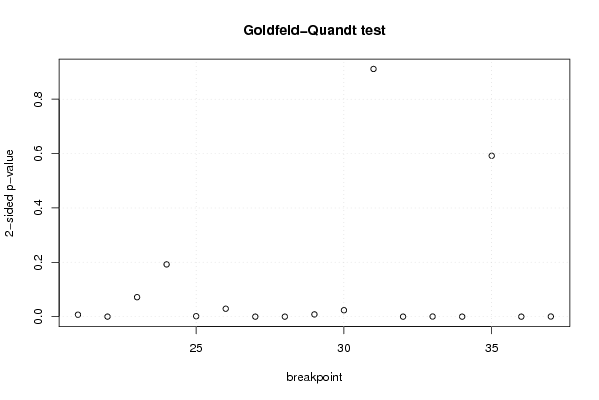
| Goldfeld-Quandt test for Heteroskedasticity | |||
| p-values | Alternative Hypothesis | ||
| breakpoint index | greater | 2-sided | less |
| 21 | 0.00354922185721876 | 0.00709844371443753 | 0.996450778142781 |
| 22 | 6.72744556507772e-05 | 0.000134548911301554 | 0.99993272554435 |
| 23 | 0.035820813351809 | 0.071641626703618 | 0.96417918664819 |
| 24 | 0.903889477488095 | 0.192221045023809 | 0.0961105225119047 |
| 25 | 0.00083121900204795 | 0.0016624380040959 | 0.999168780997952 |
| 26 | 0.985410246921432 | 0.0291795061571370 | 0.0145897530785685 |
| 27 | 1.44931085613560e-07 | 2.89862171227120e-07 | 0.999999855068914 |
| 28 | 0.999986624679032 | 2.67506419367588e-05 | 1.33753209683794e-05 |
| 29 | 0.00418370487234142 | 0.00836740974468283 | 0.995816295127659 |
| 30 | 0.988184915042469 | 0.023630169915063 | 0.0118150849575315 |
| 31 | 0.455692529293027 | 0.911385058586053 | 0.544307470706973 |
| 32 | 1.37538503310616e-07 | 2.75077006621231e-07 | 0.999999862461497 |
| 33 | 0.000200186054704549 | 0.000400372109409099 | 0.999799813945295 |
| 34 | 0.999989932174725 | 2.01356505507558e-05 | 1.00678252753779e-05 |
| 35 | 0.704050982442804 | 0.591898035114392 | 0.295949017557196 |
| 36 | 6.15482274481323e-14 | 1.23096454896265e-13 | 0.999999999999938 |
| 37 | 0.000247434401429631 | 0.000494868802859261 | 0.99975256559857 |
| Meta Analysis of Goldfeld-Quandt test for Heteroskedasticity | |||
| Description | # significant tests | % significant tests | OK/NOK |
| 1% type I error level | 11 | 0.647058823529412 | NOK |
| 5% type I error level | 13 | 0.764705882352941 | NOK |
| 10% type I error level | 14 | 0.823529411764706 | NOK |