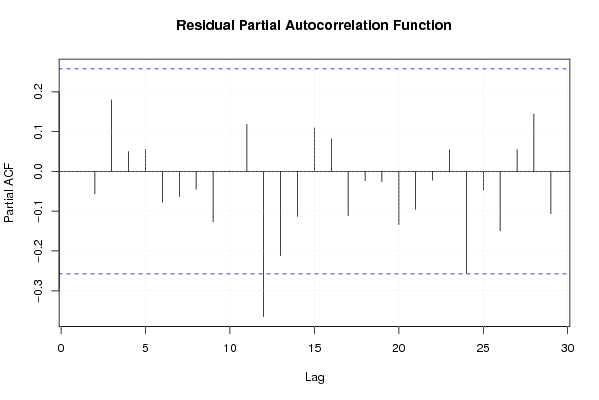
| Multiple Linear Regression - Estimated Regression Equation |
| Y[t] = -0.0734302746307986 + 0.240213449888453X[t] + 1.06847062139874Y1[t] -0.151877506173371Y2[t] -0.0658484772738318M1[t] -0.0807067438688125M2[t] + 0.119085905707768M3[t] -0.0704160867844202M4[t] -0.105059685311399M5[t] -0.236207021068785M6[t] -0.138233436004764M7[t] -0.0983526673209309M8[t] -0.251765154607209M9[t] -0.0539842332914323M10[t] -0.123558533753511M11[t] -0.0100825486711427t + e[t] |
| Multiple Linear Regression - Ordinary Least Squares | |||||
| Variable | Parameter | S.D. | T-STAT H0: parameter = 0 | 2-tail p-value | 1-tail p-value |
| (Intercept) | -0.0734302746307986 | 0.516944 | -0.142 | 0.887722 | 0.443861 |
| X | 0.240213449888453 | 0.245619 | 0.978 | 0.333677 | 0.166839 |
| Y1 | 1.06847062139874 | 0.155586 | 6.8674 | 0 | 0 |
| Y2 | -0.151877506173371 | 0.176414 | -0.8609 | 0.394173 | 0.197087 |
| M1 | -0.0658484772738318 | 0.333842 | -0.1972 | 0.844588 | 0.422294 |
| M2 | -0.0807067438688125 | 0.333377 | -0.2421 | 0.80989 | 0.404945 |
| M3 | 0.119085905707768 | 0.332721 | 0.3579 | 0.7222 | 0.3611 |
| M4 | -0.0704160867844202 | 0.334438 | -0.2106 | 0.834256 | 0.417128 |
| M5 | -0.105059685311399 | 0.335323 | -0.3133 | 0.755597 | 0.377798 |
| M6 | -0.236207021068785 | 0.335886 | -0.7032 | 0.485789 | 0.242894 |
| M7 | -0.138233436004764 | 0.335708 | -0.4118 | 0.682604 | 0.341302 |
| M8 | -0.0983526673209309 | 0.332598 | -0.2957 | 0.768908 | 0.384454 |
| M9 | -0.251765154607209 | 0.333541 | -0.7548 | 0.454566 | 0.227283 |
| M10 | -0.0539842332914323 | 0.337482 | -0.16 | 0.873678 | 0.436839 |
| M11 | -0.123558533753511 | 0.350141 | -0.3529 | 0.725942 | 0.362971 |
| t | -0.0100825486711427 | 0.014672 | -0.6872 | 0.495748 | 0.247874 |
| Multiple Linear Regression - Regression Statistics | |
| Multiple R | 0.93060263788341 |
| R-squared | 0.866021269635562 |
| Adjusted R-squared | 0.818171723076834 |
| F-TEST (value) | 18.0988396321093 |
| F-TEST (DF numerator) | 15 |
| F-TEST (DF denominator) | 42 |
| p-value | 1.14797060746241e-13 |
| Multiple Linear Regression - Residual Statistics | |
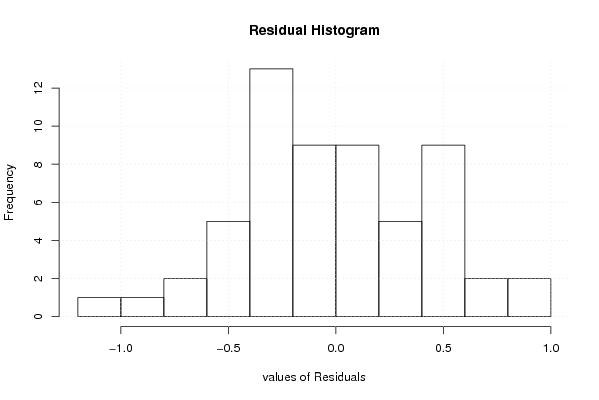
| Residual Standard Deviation | 0.494837629499835 |
| Sum Squared Residuals | 10.2842997418987 |
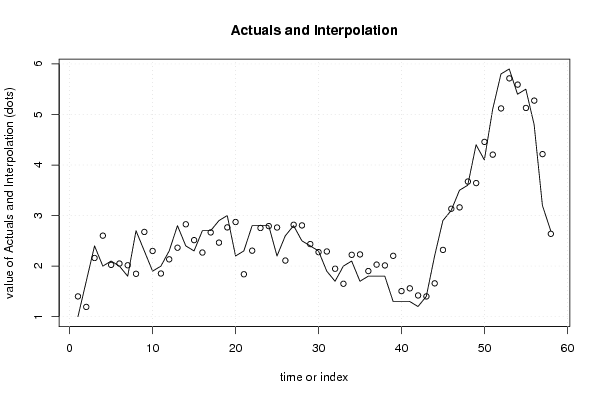
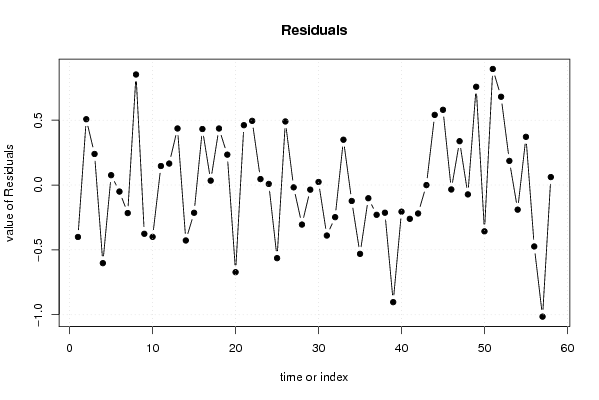
| Multiple Linear Regression - Actuals, Interpolation, and Residuals | |||
| Time or Index | Actuals | Interpolation Forecast | Residuals Prediction Error |
| 1 | 1 | 1.40060183623691 | -0.400601836236909 |
| 2 | 1.7 | 1.19234239792570 | 0.507657602074297 |
| 3 | 2.4 | 2.16035743504493 | 0.239642564955067 |
| 4 | 2 | 2.60238807453935 | -0.602388074539354 |
| 5 | 2.1 | 2.02395942446038 | 0.0760405755396217 |
| 6 | 2 | 2.05032760464107 | -0.0503276046410725 |
| 7 | 1.8 | 2.01618382827674 | -0.216183828276739 |
| 8 | 2.7 | 1.84747567462702 | 0.85252432537298 |
| 9 | 2.3 | 2.67597969916314 | -0.375979699163136 |
| 10 | 1.9 | 2.29960006769224 | -0.399600067692242 |
| 11 | 2 | 1.85330597246887 | 0.146694027531126 |
| 12 | 2.3 | 2.13438002216046 | 0.165619977839535 |
| 13 | 2.8 | 2.36380243201777 | 0.436197567982226 |
| 14 | 2.4 | 2.82753367559901 | -0.427533675599007 |
| 15 | 2.3 | 2.51391677485826 | -0.213916774858265 |
| 16 | 2.7 | 2.26823617402441 | 0.431763825975592 |
| 17 | 2.7 | 2.66608602600312 | 0.0339139739968816 |
| 18 | 2.9 | 2.46410513910524 | 0.435894860894758 |
| 19 | 3 | 2.76569029977787 | 0.234309700222133 |
| 20 | 2.2 | 2.87196008069576 | -0.671960080695757 |
| 21 | 2.3 | 1.83850079700201 | 0.461499202997989 |
| 22 | 2.8 | 2.30499306120179 | 0.495006938798211 |
| 23 | 2.8 | 2.75399231014614 | 0.0460076898538632 |
| 24 | 2.8 | 2.79152954214182 | 0.00847045785817974 |
| 25 | 2.2 | 2.76364120617454 | -0.563641206174536 |
| 26 | 2.6 | 2.10962869056359 | 0.490371309436406 |
| 27 | 2.8 | 2.81785354373255 | -0.0178535437325490 |
| 28 | 2.5 | 2.804842007364 | -0.304842007364 |
| 29 | 2.4 | 2.43562265199931 | -0.035622651999313 |
| 30 | 2.3 | 2.27634737826284 | 0.0236526217371558 |
| 31 | 1.9 | 2.28939404462538 | -0.389394044625376 |
| 32 | 1.7 | 1.94782805317695 | -0.247828053176947 |
| 33 | 2 | 1.65060697140020 | 0.349393028599796 |
| 34 | 2.1 | 2.22285191468352 | -0.122851914683516 |
| 35 | 1.7 | 2.23090235532589 | -0.530902355325887 |
| 36 | 1.8 | 1.90180234123142 | -0.101802341231424 |
| 37 | 1.8 | 2.02950139737894 | -0.229501397378939 |
| 38 | 1.8 | 2.01339417648432 | -0.213394176484324 |
| 39 | 1.3 | 2.20310427738976 | -0.903104277389762 |
| 40 | 1.3 | 1.50531644301033 | -0.205316443010331 |
| 41 | 1.3 | 1.56055039388774 | -0.260550393887739 |
| 42 | 1.2 | 1.41932050945921 | -0.219320509459211 |
| 43 | 1.4 | 1.40036448371222 | -0.000364483712215286 |
| 44 | 2.2 | 1.65904457862199 | 0.54095542137801 |
| 45 | 2.9 | 2.31995053854888 | 0.580049461451115 |
| 46 | 3.1 | 3.13407634123394 | -0.0340763412339369 |
| 47 | 3.5 | 3.1617993620591 | 0.338200637940897 |
| 48 | 3.6 | 3.67228809446629 | -0.0722880944662918 |
| 49 | 4.4 | 3.64245312819184 | 0.757546871808157 |
| 50 | 4.1 | 4.45710105942737 | -0.357101059427372 |
| 51 | 5.1 | 4.20476796897449 | 0.895232031025509 |
| 52 | 5.8 | 5.11921730106191 | 0.680782698938093 |
| 53 | 5.9 | 5.71378150364945 | 0.186218496350549 |
| 54 | 5.4 | 5.58989936853163 | -0.189899368531630 |
| 55 | 5.5 | 5.1283673436078 | 0.371632656392198 |
| 56 | 4.8 | 5.27369161287829 | -0.473691612878285 |
| 57 | 3.2 | 4.21496199388576 | -1.01496199388576 |
| 58 | 2.7 | 2.63847861518852 | 0.0615213848114844 |
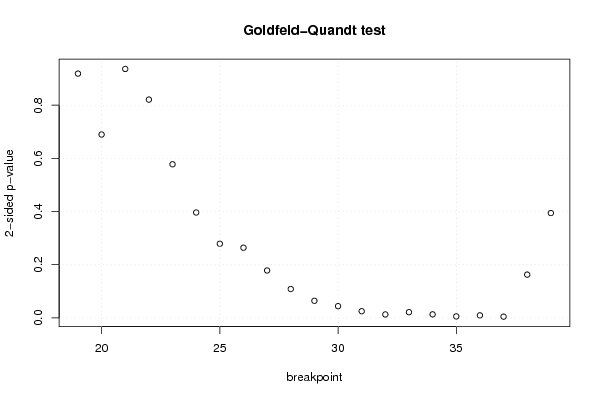
| Goldfeld-Quandt test for Heteroskedasticity | |||
| p-values | Alternative Hypothesis | ||
| breakpoint index | greater | 2-sided | less |
| 19 | 0.459441795118545 | 0.91888359023709 | 0.540558204881455 |
| 20 | 0.655118093845668 | 0.689763812308664 | 0.344881906154332 |
| 21 | 0.531802581282074 | 0.936394837435852 | 0.468197418717926 |
| 22 | 0.410558377005022 | 0.821116754010043 | 0.589441622994978 |
| 23 | 0.288902370838456 | 0.577804741676912 | 0.711097629161544 |
| 24 | 0.19822987805666 | 0.39645975611332 | 0.80177012194334 |
| 25 | 0.139448752202932 | 0.278897504405865 | 0.860551247797068 |
| 26 | 0.132048983907634 | 0.264097967815269 | 0.867951016092366 |
| 27 | 0.0892095606444316 | 0.178419121288863 | 0.910790439355568 |
| 28 | 0.0543232348449099 | 0.108646469689820 | 0.94567676515509 |
| 29 | 0.0321969583426167 | 0.0643939166852334 | 0.967803041657383 |
| 30 | 0.0221094872279176 | 0.0442189744558351 | 0.977890512772082 |
| 31 | 0.0125918719360459 | 0.0251837438720917 | 0.987408128063954 |
| 32 | 0.00652494975561953 | 0.0130498995112391 | 0.99347505024438 |
| 33 | 0.0107959423839636 | 0.0215918847679272 | 0.989204057616036 |
| 34 | 0.00670560119209043 | 0.0134112023841809 | 0.99329439880791 |
| 35 | 0.00286879147266795 | 0.0057375829453359 | 0.997131208527332 |
| 36 | 0.00480771940822882 | 0.00961543881645763 | 0.995192280591771 |
| 37 | 0.00237267514447376 | 0.00474535028894751 | 0.997627324855526 |
| 38 | 0.0814361482648349 | 0.162872296529670 | 0.918563851735165 |
| 39 | 0.197217967825072 | 0.394435935650144 | 0.802782032174928 |
| Meta Analysis of Goldfeld-Quandt test for Heteroskedasticity | |||
| Description | # significant tests | % significant tests | OK/NOK |
| 1% type I error level | 3 | 0.142857142857143 | NOK |
| 5% type I error level | 8 | 0.380952380952381 | NOK |
| 10% type I error level | 9 | 0.428571428571429 | NOK |