| Multiple Linear Regression - Estimated Regression Equation |
| TotaleIndustrieleProductie[t] = + 48.7719098176646 -3.92815091693391X[t] + 0.229632225851288Y1[t] + 0.35939013498551Y2[t] -16.6549309698687M1[t] -24.6048091612375M2[t] + 7.98612935353004M3[t] -3.39181676279789M4[t] -9.8962790917531M5[t] -0.591645919035228M6[t] -10.2867511923731M7[t] -11.8673684644641M8[t] -8.68197056383971M9[t] -0.597406321343375M10[t] + 4.17151212199479M11[t] + 0.0603498253718281t + e[t] |
| Multiple Linear Regression - Ordinary Least Squares | |||||
| Variable | Parameter | S.D. | T-STAT H0: parameter = 0 | 2-tail p-value | 1-tail p-value |
| (Intercept) | 48.7719098176646 | 14.322241 | 3.4053 | 0.001421 | 0.00071 |
| X | -3.92815091693391 | 2.800057 | -1.4029 | 0.167669 | 0.083835 |
| Y1 | 0.229632225851288 | 0.134701 | 1.7048 | 0.095293 | 0.047646 |
| Y2 | 0.35939013498551 | 0.126988 | 2.8301 | 0.006986 | 0.003493 |
| M1 | -16.6549309698687 | 3.091986 | -5.3865 | 3e-06 | 1e-06 |
| M2 | -24.6048091612375 | 3.912985 | -6.288 | 0 | 0 |
| M3 | 7.98612935353004 | 4.388498 | 1.8198 | 0.075599 | 0.037799 |
| M4 | -3.39181676279789 | 3.893557 | -0.8711 | 0.388408 | 0.194204 |
| M5 | -9.8962790917531 | 3.544963 | -2.7916 | 0.007729 | 0.003865 |
| M6 | -0.591645919035228 | 3.2706 | -0.1809 | 0.857278 | 0.428639 |
| M7 | -10.2867511923731 | 3.035381 | -3.3889 | 0.00149 | 0.000745 |
| M8 | -11.8673684644641 | 3.544847 | -3.3478 | 0.001677 | 0.000838 |
| M9 | -8.68197056383971 | 3.393313 | -2.5586 | 0.014028 | 0.007014 |
| M10 | -0.597406321343375 | 3.411245 | -0.1751 | 0.861782 | 0.430891 |
| M11 | 4.17151212199479 | 3.139765 | 1.3286 | 0.190828 | 0.095414 |
| t | 0.0603498253718281 | 0.07321 | 0.8243 | 0.414191 | 0.207096 |
| Multiple Linear Regression - Regression Statistics | |
| Multiple R | 0.904468438807846 |
| R-squared | 0.818063156799503 |
| Adjusted R-squared | 0.756039232981151 |
| F-TEST (value) | 13.1894776472923 |
| F-TEST (DF numerator) | 15 |
| F-TEST (DF denominator) | 44 |
| p-value | 1.17428289314603e-11 |
| Multiple Linear Regression - Residual Statistics | |
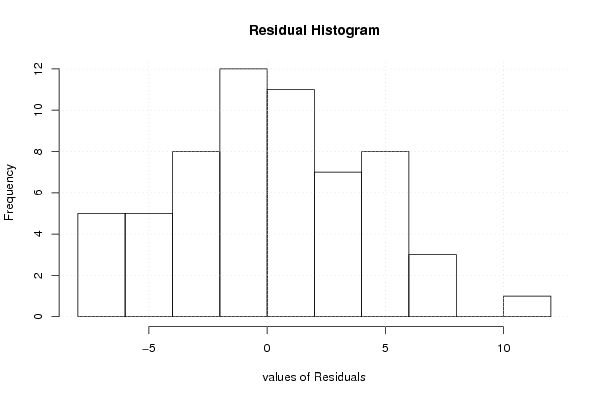
| Residual Standard Deviation | 4.75429381103554 |
| Sum Squared Residuals | 994.545624232637 |
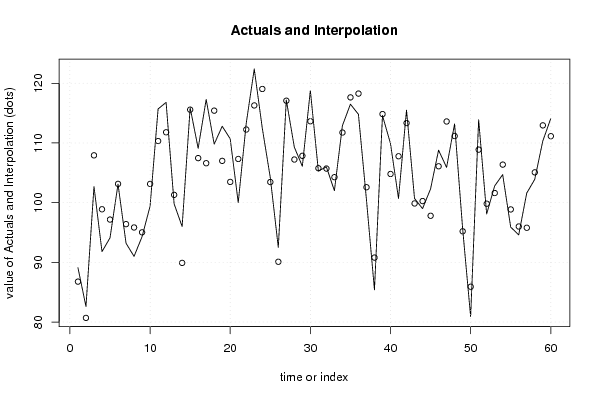
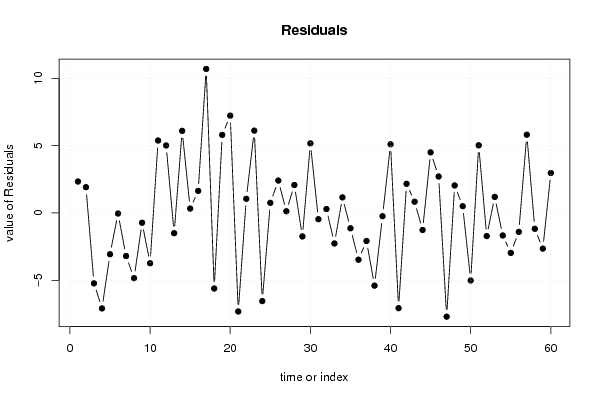
| Multiple Linear Regression - Actuals, Interpolation, and Residuals | |||
| Time or Index | Actuals | Interpolation Forecast | Residuals Prediction Error |
| 1 | 89.1 | 86.7668831370217 | 2.33311686297828 |
| 2 | 82.6 | 80.6870451290717 | 1.91295487092829 |
| 3 | 102.7 | 107.928371529836 | -5.22837152983556 |
| 4 | 91.8 | 98.8903471010845 | -7.09034710108453 |
| 5 | 94.1 | 97.1669850489309 | -3.06698504893088 |
| 6 | 103.1 | 103.142769695136 | -0.042769695136433 |
| 7 | 93.2 | 96.4013015902987 | -3.20130159029867 |
| 8 | 91 | 95.8421863225214 | -4.84218632252139 |
| 9 | 94.3 | 95.0247808152882 | -0.72478081528819 |
| 10 | 99.4 | 103.136822931497 | -3.73682293149747 |
| 11 | 115.7 | 110.323202997501 | 5.37679700249879 |
| 12 | 116.8 | 111.787935670680 | 5.01206432931964 |
| 13 | 99.8 | 101.304009174884 | -1.50400917488376 |
| 14 | 96 | 89.906062117899 | 6.09393788210103 |
| 15 | 115.9 | 115.575115705050 | 0.324884294950293 |
| 16 | 109.1 | 107.461518195589 | 1.63848180441069 |
| 17 | 117.3 | 106.607770242429 | 10.6922297575712 |
| 18 | 109.8 | 115.411884574598 | -5.61188457459761 |
| 19 | 112.8 | 107.001886539628 | 5.79811346037193 |
| 20 | 110.7 | 103.475089758071 | 7.22491024192851 |
| 21 | 100 | 107.316780214736 | -7.3167802147365 |
| 22 | 113.3 | 112.249910182526 | 1.05008981747369 |
| 23 | 122.4 | 116.287812610713 | 6.11218738928652 |
| 24 | 112.5 | 119.046192364645 | -6.54619236464452 |
| 25 | 104.2 | 103.448702412588 | 0.751297587411934 |
| 26 | 92.5 | 90.0952642356689 | 2.40473576433112 |
| 27 | 117.2 | 117.076917412968 | 0.123082587031616 |
| 28 | 109.3 | 107.226372521209 | 2.07362747879137 |
| 29 | 106.1 | 107.845101767542 | -1.74510176754219 |
| 30 | 118.8 | 113.636079576522 | 5.16392042347777 |
| 31 | 105.3 | 105.767604964914 | -0.467604964913886 |
| 32 | 106 | 105.711557183518 | 0.288442816481648 |
| 33 | 102 | 104.266280645306 | -2.26628064530606 |
| 34 | 112.9 | 111.744238904259 | 1.15576109574108 |
| 35 | 116.5 | 117.638937894806 | -1.13893789480592 |
| 36 | 114.8 | 118.271804082590 | -3.47180408258966 |
| 37 | 100.5 | 102.580652640093 | -2.08065264009346 |
| 38 | 85.4 | 90.7964202149477 | -5.39642021494772 |
| 39 | 114.6 | 114.840983014440 | -0.240983014439798 |
| 40 | 109.9 | 104.801856680060 | 5.09814331993991 |
| 41 | 100.7 | 107.772664656553 | -7.07266465655256 |
| 42 | 115.5 | 113.335897542379 | 2.16410245762148 |
| 43 | 100.7 | 99.865158878211 | 0.834841121789101 |
| 44 | 99 | 100.265308486678 | -1.26530848667826 |
| 45 | 102.3 | 97.8017074309417 | 4.49829256905829 |
| 46 | 108.8 | 106.093444614644 | 2.70655538535624 |
| 47 | 105.9 | 113.601309796839 | -7.7013097968393 |
| 48 | 113.2 | 111.160249922653 | 2.03975007734658 |
| 49 | 95.7 | 95.199752635413 | 0.500247364586997 |
| 50 | 80.9 | 85.9152083024127 | -5.01520830241273 |
| 51 | 113.9 | 108.878612337707 | 5.02138766229344 |
| 52 | 98.1 | 99.8199055020574 | -1.71990550205743 |
| 53 | 102.8 | 101.607478284546 | 1.19252171545447 |
| 54 | 104.7 | 106.373368611365 | -1.67336861136521 |
| 55 | 95.9 | 98.8640480269485 | -2.96404802694849 |
| 56 | 94.6 | 96.0058582492105 | -1.40585824921052 |
| 57 | 101.6 | 95.7904508937275 | 5.80954910627246 |
| 58 | 103.9 | 105.075583367074 | -1.17558336707354 |
| 59 | 110.3 | 112.94873670014 | -2.64873670014008 |
| 60 | 114.1 | 111.133817959432 | 2.96618204056796 |
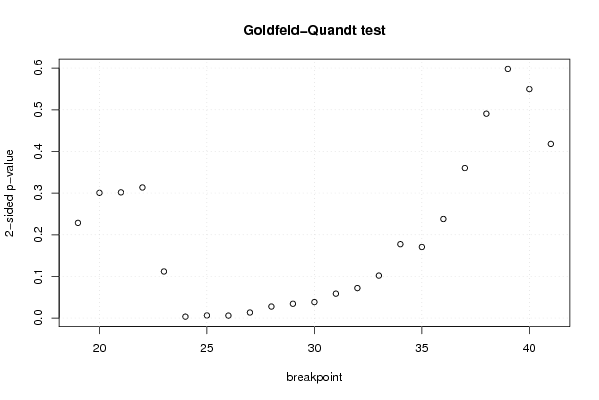
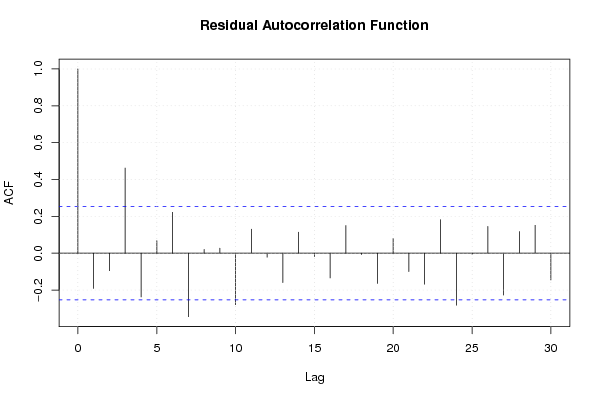
| Goldfeld-Quandt test for Heteroskedasticity | |||
| p-values | Alternative Hypothesis | ||
| breakpoint index | greater | 2-sided | less |
| 19 | 0.885744354662036 | 0.228511290675929 | 0.114255645337964 |
| 20 | 0.849676890981094 | 0.300646218037811 | 0.150323109018906 |
| 21 | 0.849103452071177 | 0.301793095857646 | 0.150896547928823 |
| 22 | 0.843242895736402 | 0.313514208527196 | 0.156757104263598 |
| 23 | 0.944068599006053 | 0.111862801987895 | 0.0559314009939474 |
| 24 | 0.998294136268217 | 0.00341172746356511 | 0.00170586373178255 |
| 25 | 0.996847767447684 | 0.00630446510463106 | 0.00315223255231553 |
| 26 | 0.997033543714508 | 0.00593291257098407 | 0.00296645628549204 |
| 27 | 0.993317212101977 | 0.0133655757960456 | 0.0066827878980228 |
| 28 | 0.986181828766204 | 0.0276363424675911 | 0.0138181712337956 |
| 29 | 0.98282661270671 | 0.0343467745865817 | 0.0171733872932908 |
| 30 | 0.980818982859855 | 0.0383620342802906 | 0.0191810171401453 |
| 31 | 0.970699007747668 | 0.058601984504664 | 0.029300992252332 |
| 32 | 0.964007354431402 | 0.0719852911371953 | 0.0359926455685977 |
| 33 | 0.949033504642436 | 0.101932990715128 | 0.0509664953575642 |
| 34 | 0.911306062724148 | 0.177387874551703 | 0.0886939372758516 |
| 35 | 0.914689068886684 | 0.170621862226633 | 0.0853109311133163 |
| 36 | 0.881094183847517 | 0.237811632304967 | 0.118905816152483 |
| 37 | 0.81992531440963 | 0.360149371180739 | 0.180074685590370 |
| 38 | 0.75469051759435 | 0.4906189648113 | 0.24530948240565 |
| 39 | 0.700993085412501 | 0.598013829174998 | 0.299006914587499 |
| 40 | 0.725193528041864 | 0.549612943916273 | 0.274806471958136 |
| 41 | 0.79097818107525 | 0.418043637849499 | 0.209021818924750 |
| Meta Analysis of Goldfeld-Quandt test for Heteroskedasticity | |||
| Description | # significant tests | % significant tests | OK/NOK |
| 1% type I error level | 3 | 0.130434782608696 | NOK |
| 5% type I error level | 7 | 0.304347826086957 | NOK |
| 10% type I error level | 9 | 0.391304347826087 | NOK |