| Multiple Linear Regression - Estimated Regression Equation |
| WklBe[t] = + 595.594736842105 -26.9736842105263X[t] -2.93684210526333M1[t] -21.4M2[t] -36.8M3[t] -34.4M4[t] -32.1999999999999M5[t] -36.3999999999999M6[t] -45.2M7[t] -50.2M8[t] -61.4M9[t] -59.2M10[t] -7.99999999999997M11[t] + e[t] |
| Multiple Linear Regression - Ordinary Least Squares | |||||
| Variable | Parameter | S.D. | T-STAT H0: parameter = 0 | 2-tail p-value | 1-tail p-value |
| (Intercept) | 595.594736842105 | 17.908126 | 33.2584 | 0 | 0 |
| X | -26.9736842105263 | 12.457042 | -2.1653 | 0.035362 | 0.017681 |
| M1 | -2.93684210526333 | 24.069292 | -0.122 | 0.903396 | 0.451698 |
| M2 | -21.4 | 25.079628 | -0.8533 | 0.397741 | 0.19887 |
| M3 | -36.8 | 25.079628 | -1.4673 | 0.148809 | 0.074405 |
| M4 | -34.4 | 25.079628 | -1.3716 | 0.176556 | 0.088278 |
| M5 | -32.1999999999999 | 25.079628 | -1.2839 | 0.205336 | 0.102668 |
| M6 | -36.3999999999999 | 25.079628 | -1.4514 | 0.15318 | 0.07659 |
| M7 | -45.2 | 25.079628 | -1.8023 | 0.077786 | 0.038893 |
| M8 | -50.2 | 25.079628 | -2.0016 | 0.050995 | 0.025497 |
| M9 | -61.4 | 25.079628 | -2.4482 | 0.018063 | 0.009031 |
| M10 | -59.2 | 25.079628 | -2.3605 | 0.022362 | 0.011181 |
| M11 | -7.99999999999997 | 25.079628 | -0.319 | 0.751123 | 0.375561 |
| Multiple Linear Regression - Regression Statistics | |
| Multiple R | 0.537167659901329 |
| R-squared | 0.288549094843869 |
| Adjusted R-squared | 0.110686368554837 |
| F-TEST (value) | 1.62231345973505 |
| F-TEST (DF numerator) | 12 |
| F-TEST (DF denominator) | 48 |
| p-value | 0.116971788217152 |
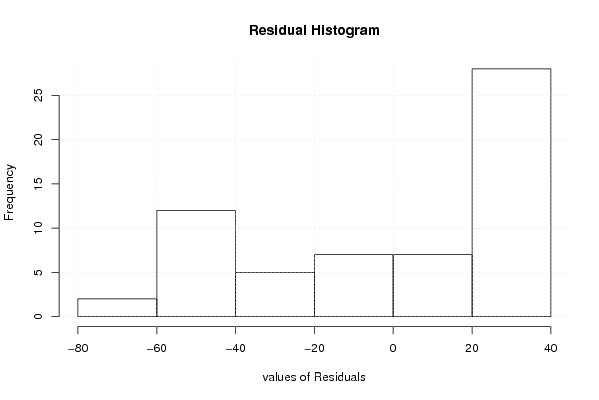
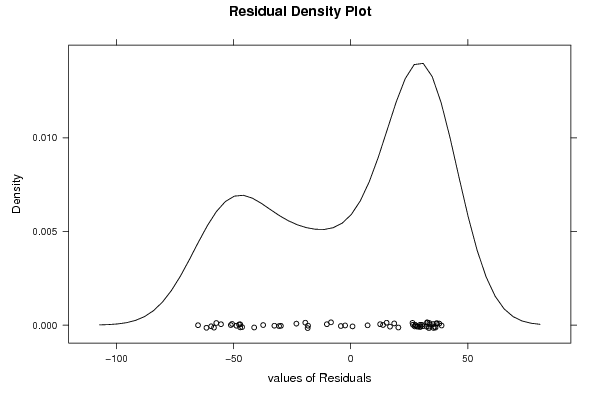
| Multiple Linear Regression - Residual Statistics | |
| Residual Standard Deviation | 39.6543730028053 |
| Sum Squared Residuals | 75478.5263157894 |
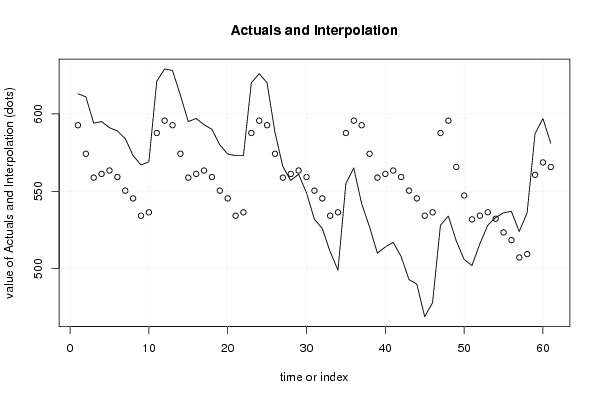
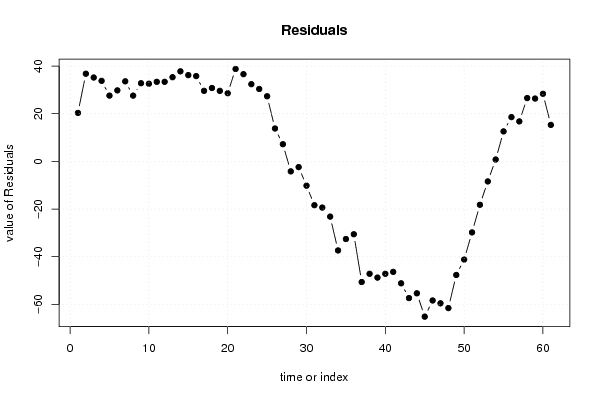
| Multiple Linear Regression - Actuals, Interpolation, and Residuals | |||
| Time or Index | Actuals | Interpolation Forecast | Residuals Prediction Error |
| 1 | 613 | 592.657894736843 | 20.3421052631569 |
| 2 | 611 | 574.194736842105 | 36.8052631578947 |
| 3 | 594 | 558.794736842105 | 35.2052631578947 |
| 4 | 595 | 561.194736842105 | 33.8052631578948 |
| 5 | 591 | 563.394736842105 | 27.6052631578948 |
| 6 | 589 | 559.194736842105 | 29.8052631578948 |
| 7 | 584 | 550.394736842105 | 33.6052631578947 |
| 8 | 573 | 545.394736842105 | 27.6052631578947 |
| 9 | 567 | 534.194736842105 | 32.8052631578947 |
| 10 | 569 | 536.394736842105 | 32.6052631578948 |
| 11 | 621 | 587.594736842105 | 33.4052631578948 |
| 12 | 629 | 595.594736842105 | 33.4052631578948 |
| 13 | 628 | 592.657894736842 | 35.3421052631581 |
| 14 | 612 | 574.194736842105 | 37.8052631578947 |
| 15 | 595 | 558.794736842105 | 36.2052631578947 |
| 16 | 597 | 561.194736842105 | 35.8052631578947 |
| 17 | 593 | 563.394736842105 | 29.6052631578947 |
| 18 | 590 | 559.194736842105 | 30.8052631578947 |
| 19 | 580 | 550.394736842105 | 29.6052631578947 |
| 20 | 574 | 545.394736842105 | 28.6052631578947 |
| 21 | 573 | 534.194736842105 | 38.8052631578948 |
| 22 | 573 | 536.394736842105 | 36.6052631578947 |
| 23 | 620 | 587.594736842105 | 32.4052631578947 |
| 24 | 626 | 595.594736842105 | 30.4052631578948 |
| 25 | 620 | 592.657894736842 | 27.3421052631581 |
| 26 | 588 | 574.194736842105 | 13.8052631578947 |
| 27 | 566 | 558.794736842105 | 7.20526315789473 |
| 28 | 557 | 561.194736842105 | -4.19473684210529 |
| 29 | 561 | 563.394736842105 | -2.39473684210529 |
| 30 | 549 | 559.194736842105 | -10.1947368421053 |
| 31 | 532 | 550.394736842105 | -18.3947368421052 |
| 32 | 526 | 545.394736842105 | -19.3947368421052 |
| 33 | 511 | 534.194736842105 | -23.1947368421053 |
| 34 | 499 | 536.394736842105 | -37.3947368421053 |
| 35 | 555 | 587.594736842105 | -32.5947368421053 |
| 36 | 565 | 595.594736842105 | -30.5947368421052 |
| 37 | 542 | 592.657894736842 | -50.6578947368419 |
| 38 | 527 | 574.194736842105 | -47.1947368421053 |
| 39 | 510 | 558.794736842105 | -48.7947368421053 |
| 40 | 514 | 561.194736842105 | -47.1947368421053 |
| 41 | 517 | 563.394736842105 | -46.3947368421053 |
| 42 | 508 | 559.194736842105 | -51.1947368421053 |
| 43 | 493 | 550.394736842105 | -57.3947368421052 |
| 44 | 490 | 545.394736842105 | -55.3947368421052 |
| 45 | 469 | 534.194736842105 | -65.1947368421052 |
| 46 | 478 | 536.394736842105 | -58.3947368421052 |
| 47 | 528 | 587.594736842105 | -59.5947368421052 |
| 48 | 534 | 595.594736842105 | -61.5947368421052 |
| 49 | 518 | 565.684210526316 | -47.6842105263156 |
| 50 | 506 | 547.221052631579 | -41.221052631579 |
| 51 | 502 | 531.821052631579 | -29.821052631579 |
| 52 | 516 | 534.221052631579 | -18.221052631579 |
| 53 | 528 | 536.421052631579 | -8.421052631579 |
| 54 | 533 | 532.221052631579 | 0.778947368421 |
| 55 | 536 | 523.421052631579 | 12.5789473684210 |
| 56 | 537 | 518.421052631579 | 18.5789473684210 |
| 57 | 524 | 507.221052631579 | 16.7789473684210 |
| 58 | 536 | 509.421052631579 | 26.578947368421 |
| 59 | 587 | 560.621052631579 | 26.378947368421 |
| 60 | 597 | 568.621052631579 | 28.3789473684211 |
| 61 | 581 | 565.684210526316 | 15.3157894736844 |
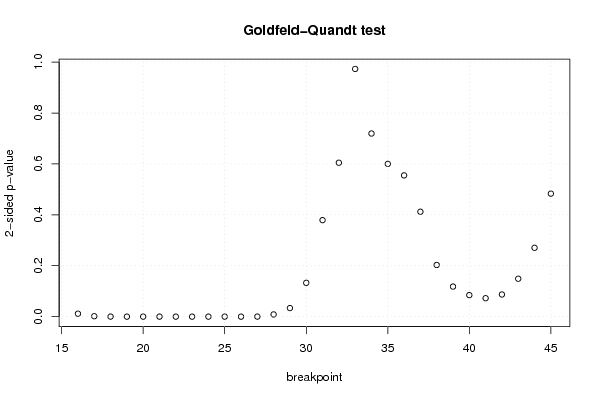
| Goldfeld-Quandt test for Heteroskedasticity | |||
| p-values | Alternative Hypothesis | ||
| breakpoint index | greater | 2-sided | less |
| 16 | 0.00579636704677684 | 0.0115927340935537 | 0.994203632953223 |
| 17 | 0.000844865598487998 | 0.00168973119697600 | 0.999155134401512 |
| 18 | 0.000115855535994366 | 0.000231711071988732 | 0.999884144464006 |
| 19 | 1.85471221270918e-05 | 3.70942442541836e-05 | 0.999981452877873 |
| 20 | 2.47079153541971e-06 | 4.94158307083941e-06 | 0.999997529208465 |
| 21 | 6.48299488131684e-07 | 1.29659897626337e-06 | 0.999999351700512 |
| 22 | 1.43604406882979e-07 | 2.87208813765959e-07 | 0.999999856395593 |
| 23 | 2.67486062750629e-08 | 5.34972125501259e-08 | 0.999999973251394 |
| 24 | 6.14066803656605e-09 | 1.22813360731321e-08 | 0.999999993859332 |
| 25 | 2.26669095644399e-09 | 4.53338191288799e-09 | 0.99999999773331 |
| 26 | 1.90142111547462e-06 | 3.80284223094923e-06 | 0.999998098578885 |
| 27 | 0.000125415563188628 | 0.000250831126377256 | 0.999874584436811 |
| 28 | 0.00436650205314035 | 0.0087330041062807 | 0.99563349794686 |
| 29 | 0.0168651874542079 | 0.0337303749084158 | 0.983134812545792 |
| 30 | 0.0664427232861858 | 0.132885446572372 | 0.933557276713814 |
| 31 | 0.189569048688651 | 0.379138097377301 | 0.81043095131135 |
| 32 | 0.302348641952331 | 0.604697283904662 | 0.697651358047669 |
| 33 | 0.48657172443494 | 0.97314344886988 | 0.51342827556506 |
| 34 | 0.640281147895894 | 0.719437704208213 | 0.359718852104106 |
| 35 | 0.699901950010715 | 0.60019609997857 | 0.300098049989285 |
| 36 | 0.722487602163875 | 0.555024795672251 | 0.277512397836125 |
| 37 | 0.793884998985751 | 0.412230002028498 | 0.206115001014249 |
| 38 | 0.89845675350425 | 0.203086492991501 | 0.101543246495751 |
| 39 | 0.940954382952636 | 0.118091234094727 | 0.0590456170473637 |
| 40 | 0.957752596538754 | 0.0844948069224927 | 0.0422474034612464 |
| 41 | 0.9637622215932 | 0.0724755568135993 | 0.0362377784067996 |
| 42 | 0.956456497260827 | 0.0870870054783461 | 0.0435435027391731 |
| 43 | 0.925502553071287 | 0.148994893857427 | 0.0744974469287134 |
| 44 | 0.86472190118234 | 0.27055619763532 | 0.13527809881766 |
| 45 | 0.758339319768784 | 0.483321360462433 | 0.241660680231216 |
| Meta Analysis of Goldfeld-Quandt test for Heteroskedasticity | |||
| Description | # significant tests | % significant tests | OK/NOK |
| 1% type I error level | 12 | 0.4 | NOK |
| 5% type I error level | 14 | 0.466666666666667 | NOK |
| 10% type I error level | 17 | 0.566666666666667 | NOK |