Free Statistics

of Irreproducible Research!

Author's title

Author*The author of this computation has been verified*
R Software Modulerwasp_multipleregression.wasp
Title produced by softwareMultiple Regression
Date of computationFri, 20 Nov 2009 06:54:52 -0700
Cite this page as followsStatistical Computations at FreeStatistics.org, Office for Research Development and Education, URL https://freestatistics.org/blog/index.php?v=date/2009/Nov/20/t1258726338rf5t93f86681u57.htm/, Retrieved Sat, 20 Apr 2024 04:57:39 +0000
Statistical Computations at FreeStatistics.org, Office for Research Development and Education, URL https://freestatistics.org/blog/index.php?pk=58182, Retrieved Sat, 20 Apr 2024 04:57:39 +0000
QR Codes:

Original text written by user:
IsPrivate?No (this computation is public)
User-defined keywords
Estimated Impact141
Family? (F = Feedback message, R = changed R code, M = changed R Module, P = changed Parameters, D = changed Data)
-     [Multiple Regression] [Q1 The Seatbeltlaw] [2007-11-14 19:27:43] [8cd6641b921d30ebe00b648d1481bba0]
- RM D  [Multiple Regression] [Seatbelt] [2009-11-12 14:10:54] [b98453cac15ba1066b407e146608df68]
-    D      [Multiple Regression] [] [2009-11-20 13:54:52] [ed082d38031561faed979d8cebfeba4d] [Current]
Feedback Forum

Post a new message
Dataseries X:
16203	112	13808	11752	10751	10144
17432	112	16203	13808	11752	10751
18014	304	17432	16203	13808	11752
16956	794	18014	17432	16203	13808
17982	901	16956	18014	17432	16203
19435	1232	17982	16956	18014	17432
19990	1240	19435	17982	16956	18014
20154	1032	19990	19435	17982	16956
10327	1145	20154	19990	19435	17982
9807	1588	10327	20154	19990	19435
10862	2264	9807	10327	20154	19990
13743	2209	10862	9807	10327	20154
16458	2917	13743	10862	9807	10144
18466	243	16458	13743	10862	10751
18810	558	18466	16458	13743	11752
17361	1238	18810	18466	16458	13808
17411	1502	17361	18810	18466	16203
18517	2000	17411	17361	18810	17432
18525	2146	18517	17411	17361	18014
17859	2066	18525	18517	17411	16956
9499	2046	17859	18525	18517	17982
9490	1952	9499	17859	18525	19435
9255	2771	9490	9499	17859	19990
10758	3278	9255	9490	9499	20154
12375	4000	10758	9255	9490	10327
14617	410	12375	10758	9255	9807
15427	1107	14617	12375	10758	10862
14136	1622	15427	14617	12375	13743
14308	1986	14136	15427	14617	16458
15293	2036	14308	14136	15427	18466
15679	2400	15293	14308	14136	18810
16319	2736	15679	15293	14308	17361
11196	2901	16319	15679	15293	17411
11169	2883	11196	16319	15679	18517
12158	3747	11169	11196	16319	18525
14251	4075	12158	11169	11196	17859
16237	4996	14251	12158	11169	9499
19706	575	16237	14251	12158	9490
18960	999	19706	16237	14251	9255
18537	1411	18960	19706	16237	10758
19103	1493	18537	18960	19706	12375
19691	1846	19103	18537	18960	14617
19464	2899	19691	19103	18537	15427
17264	2372	19464	19691	19103	14136
8957	2856	17264	19464	19691	14308
9703	3468	8957	17264	19464	15293
9166	4193	9703	8957	17264	15679
9519	4440	9166	9703	8957	16319
10535	4186	9519	9166	9703	11196
11526	655	10535	9519	9166	11169
9630	1453	11526	10535	9519	12158
7061	1989	9630	11526	10535	14251
6021	2209	7061	9630	11526	16237


Summary of computational transaction
Raw Inputview raw input (R code)
Raw Outputview raw output of R engine
Computing time3 seconds
R Server'Gwilym Jenkins' @ 72.249.127.135

\begin{tabular}{lllllllll}
\hline
Summary of computational transaction \tabularnewline
Raw Input & view raw input (R code)  \tabularnewline
Raw Output & view raw output of R engine  \tabularnewline
Computing time & 3 seconds \tabularnewline
R Server & 'Gwilym Jenkins' @ 72.249.127.135 \tabularnewline
\hline
\end{tabular}
%Source: https://freestatistics.org/blog/index.php?pk=58182&T=0

[TABLE]
[ROW][C]Summary of computational transaction[/C][/ROW]
[ROW][C]Raw Input[/C][C]view raw input (R code) [/C][/ROW]
[ROW][C]Raw Output[/C][C]view raw output of R engine [/C][/ROW]
[ROW][C]Computing time[/C][C]3 seconds[/C][/ROW]
[ROW][C]R Server[/C][C]'Gwilym Jenkins' @ 72.249.127.135[/C][/ROW]
[/TABLE]
Source: https://freestatistics.org/blog/index.php?pk=58182&T=0

Globally Unique Identifier (entire table): ba.freestatistics.org/blog/index.php?pk=58182&T=0

As an alternative you can also use a QR Code:  

The GUIDs for individual cells are displayed in the table below:

Summary of computational transaction
Raw Inputview raw input (R code)
Raw Outputview raw output of R engine
Computing time3 seconds
R Server'Gwilym Jenkins' @ 72.249.127.135


Multiple Linear Regression - Estimated Regression Equation
Y[t] = + 5039.52273540422 + 0.152568870939067X[t] + 1.21721358419328Y1[t] -0.158914826056032Y2[t] -0.133371695416324Y3[t] -0.125086641034477Y4[t] -1237.48667831291M1[t] -796.231551251808M2[t] -2800.83954489340M3[t] -3149.69928454874M4[t] -830.742747890353M5[t] -166.895192124954M6[t] -1271.27324638286M7[t] -1886.8123772962M8[t] -8925.71155554022M9[t] + 834.008192265998M10[t] -272.653196521483M11[t] -28.6099017672629t + e[t]

\begin{tabular}{lllllllll}
\hline
Multiple Linear Regression - Estimated Regression Equation \tabularnewline
Y[t] =  +  5039.52273540422 +  0.152568870939067X[t] +  1.21721358419328Y1[t] -0.158914826056032Y2[t] -0.133371695416324Y3[t] -0.125086641034477Y4[t] -1237.48667831291M1[t] -796.231551251808M2[t] -2800.83954489340M3[t] -3149.69928454874M4[t] -830.742747890353M5[t] -166.895192124954M6[t] -1271.27324638286M7[t] -1886.8123772962M8[t] -8925.71155554022M9[t] +  834.008192265998M10[t] -272.653196521483M11[t] -28.6099017672629t  + e[t] \tabularnewline
\hline
\end{tabular}
%Source: https://freestatistics.org/blog/index.php?pk=58182&T=1

[TABLE]
[ROW][C]Multiple Linear Regression - Estimated Regression Equation[/C][/ROW]
[ROW][C]Y[t] =  +  5039.52273540422 +  0.152568870939067X[t] +  1.21721358419328Y1[t] -0.158914826056032Y2[t] -0.133371695416324Y3[t] -0.125086641034477Y4[t] -1237.48667831291M1[t] -796.231551251808M2[t] -2800.83954489340M3[t] -3149.69928454874M4[t] -830.742747890353M5[t] -166.895192124954M6[t] -1271.27324638286M7[t] -1886.8123772962M8[t] -8925.71155554022M9[t] +  834.008192265998M10[t] -272.653196521483M11[t] -28.6099017672629t  + e[t][/C][/ROW]
[/TABLE]
Source: https://freestatistics.org/blog/index.php?pk=58182&T=1

Globally Unique Identifier (entire table): ba.freestatistics.org/blog/index.php?pk=58182&T=1

As an alternative you can also use a QR Code:  

The GUIDs for individual cells are displayed in the table below:

Multiple Linear Regression - Estimated Regression Equation
Y[t] = + 5039.52273540422 + 0.152568870939067X[t] + 1.21721358419328Y1[t] -0.158914826056032Y2[t] -0.133371695416324Y3[t] -0.125086641034477Y4[t] -1237.48667831291M1[t] -796.231551251808M2[t] -2800.83954489340M3[t] -3149.69928454874M4[t] -830.742747890353M5[t] -166.895192124954M6[t] -1271.27324638286M7[t] -1886.8123772962M8[t] -8925.71155554022M9[t] + 834.008192265998M10[t] -272.653196521483M11[t] -28.6099017672629t + e[t]


Multiple Linear Regression - Ordinary Least Squares
VariableParameterS.D.T-STATH0: parameter = 02-tail p-value1-tail p-value
(Intercept)5039.522735404224459.3613811.13010.266120.13306
X0.1525688709390670.2696250.56590.5751010.287551
Y11.217213584193280.1774066.861200
Y2-0.1589148260560320.268997-0.59080.5584710.279236
Y3-0.1333716954163240.193218-0.69030.494580.24729
Y4-0.1250866410344770.168057-0.74430.4616570.230829
M1-1237.486678312911506.315053-0.82150.4169040.208452
M2-796.2315512518081599.277915-0.49790.621690.310845
M3-2800.839544893401352.024178-2.07160.0457370.022869
M4-3149.699284548741070.086875-2.94340.0057310.002865
M5-830.742747890353944.231106-0.87980.3849640.192482
M6-166.8951921249541010.600647-0.16510.869780.43489
M7-1271.27324638286970.723979-1.30960.1988580.099429
M8-1886.8123772962952.829009-1.98020.0555830.027791
M9-8925.711555540221009.261665-8.843800
M10834.0081922659981625.6220670.5130.6111470.305573
M11-272.6531965214831649.882392-0.16530.8696930.434847
t-28.609901767262919.311086-1.48150.1474140.073707

\begin{tabular}{lllllllll}
\hline
Multiple Linear Regression - Ordinary Least Squares \tabularnewline
Variable & Parameter & S.D. & T-STATH0: parameter = 0 & 2-tail p-value & 1-tail p-value \tabularnewline
(Intercept) & 5039.52273540422 & 4459.361381 & 1.1301 & 0.26612 & 0.13306 \tabularnewline
X & 0.152568870939067 & 0.269625 & 0.5659 & 0.575101 & 0.287551 \tabularnewline
Y1 & 1.21721358419328 & 0.177406 & 6.8612 & 0 & 0 \tabularnewline
Y2 & -0.158914826056032 & 0.268997 & -0.5908 & 0.558471 & 0.279236 \tabularnewline
Y3 & -0.133371695416324 & 0.193218 & -0.6903 & 0.49458 & 0.24729 \tabularnewline
Y4 & -0.125086641034477 & 0.168057 & -0.7443 & 0.461657 & 0.230829 \tabularnewline
M1 & -1237.48667831291 & 1506.315053 & -0.8215 & 0.416904 & 0.208452 \tabularnewline
M2 & -796.231551251808 & 1599.277915 & -0.4979 & 0.62169 & 0.310845 \tabularnewline
M3 & -2800.83954489340 & 1352.024178 & -2.0716 & 0.045737 & 0.022869 \tabularnewline
M4 & -3149.69928454874 & 1070.086875 & -2.9434 & 0.005731 & 0.002865 \tabularnewline
M5 & -830.742747890353 & 944.231106 & -0.8798 & 0.384964 & 0.192482 \tabularnewline
M6 & -166.895192124954 & 1010.600647 & -0.1651 & 0.86978 & 0.43489 \tabularnewline
M7 & -1271.27324638286 & 970.723979 & -1.3096 & 0.198858 & 0.099429 \tabularnewline
M8 & -1886.8123772962 & 952.829009 & -1.9802 & 0.055583 & 0.027791 \tabularnewline
M9 & -8925.71155554022 & 1009.261665 & -8.8438 & 0 & 0 \tabularnewline
M10 & 834.008192265998 & 1625.622067 & 0.513 & 0.611147 & 0.305573 \tabularnewline
M11 & -272.653196521483 & 1649.882392 & -0.1653 & 0.869693 & 0.434847 \tabularnewline
t & -28.6099017672629 & 19.311086 & -1.4815 & 0.147414 & 0.073707 \tabularnewline
\hline
\end{tabular}
%Source: https://freestatistics.org/blog/index.php?pk=58182&T=2

[TABLE]
[ROW][C]Multiple Linear Regression - Ordinary Least Squares[/C][/ROW]
[ROW][C]Variable[/C][C]Parameter[/C][C]S.D.[/C][C]T-STATH0: parameter = 0[/C][C]2-tail p-value[/C][C]1-tail p-value[/C][/ROW]
[ROW][C](Intercept)[/C][C]5039.52273540422[/C][C]4459.361381[/C][C]1.1301[/C][C]0.26612[/C][C]0.13306[/C][/ROW]
[ROW][C]X[/C][C]0.152568870939067[/C][C]0.269625[/C][C]0.5659[/C][C]0.575101[/C][C]0.287551[/C][/ROW]
[ROW][C]Y1[/C][C]1.21721358419328[/C][C]0.177406[/C][C]6.8612[/C][C]0[/C][C]0[/C][/ROW]
[ROW][C]Y2[/C][C]-0.158914826056032[/C][C]0.268997[/C][C]-0.5908[/C][C]0.558471[/C][C]0.279236[/C][/ROW]
[ROW][C]Y3[/C][C]-0.133371695416324[/C][C]0.193218[/C][C]-0.6903[/C][C]0.49458[/C][C]0.24729[/C][/ROW]
[ROW][C]Y4[/C][C]-0.125086641034477[/C][C]0.168057[/C][C]-0.7443[/C][C]0.461657[/C][C]0.230829[/C][/ROW]
[ROW][C]M1[/C][C]-1237.48667831291[/C][C]1506.315053[/C][C]-0.8215[/C][C]0.416904[/C][C]0.208452[/C][/ROW]
[ROW][C]M2[/C][C]-796.231551251808[/C][C]1599.277915[/C][C]-0.4979[/C][C]0.62169[/C][C]0.310845[/C][/ROW]
[ROW][C]M3[/C][C]-2800.83954489340[/C][C]1352.024178[/C][C]-2.0716[/C][C]0.045737[/C][C]0.022869[/C][/ROW]
[ROW][C]M4[/C][C]-3149.69928454874[/C][C]1070.086875[/C][C]-2.9434[/C][C]0.005731[/C][C]0.002865[/C][/ROW]
[ROW][C]M5[/C][C]-830.742747890353[/C][C]944.231106[/C][C]-0.8798[/C][C]0.384964[/C][C]0.192482[/C][/ROW]
[ROW][C]M6[/C][C]-166.895192124954[/C][C]1010.600647[/C][C]-0.1651[/C][C]0.86978[/C][C]0.43489[/C][/ROW]
[ROW][C]M7[/C][C]-1271.27324638286[/C][C]970.723979[/C][C]-1.3096[/C][C]0.198858[/C][C]0.099429[/C][/ROW]
[ROW][C]M8[/C][C]-1886.8123772962[/C][C]952.829009[/C][C]-1.9802[/C][C]0.055583[/C][C]0.027791[/C][/ROW]
[ROW][C]M9[/C][C]-8925.71155554022[/C][C]1009.261665[/C][C]-8.8438[/C][C]0[/C][C]0[/C][/ROW]
[ROW][C]M10[/C][C]834.008192265998[/C][C]1625.622067[/C][C]0.513[/C][C]0.611147[/C][C]0.305573[/C][/ROW]
[ROW][C]M11[/C][C]-272.653196521483[/C][C]1649.882392[/C][C]-0.1653[/C][C]0.869693[/C][C]0.434847[/C][/ROW]
[ROW][C]t[/C][C]-28.6099017672629[/C][C]19.311086[/C][C]-1.4815[/C][C]0.147414[/C][C]0.073707[/C][/ROW]
[/TABLE]
Source: https://freestatistics.org/blog/index.php?pk=58182&T=2

Globally Unique Identifier (entire table): ba.freestatistics.org/blog/index.php?pk=58182&T=2

As an alternative you can also use a QR Code:  

The GUIDs for individual cells are displayed in the table below:

Multiple Linear Regression - Ordinary Least Squares
VariableParameterS.D.T-STATH0: parameter = 02-tail p-value1-tail p-value
(Intercept)5039.522735404224459.3613811.13010.266120.13306
X0.1525688709390670.2696250.56590.5751010.287551
Y11.217213584193280.1774066.861200
Y2-0.1589148260560320.268997-0.59080.5584710.279236
Y3-0.1333716954163240.193218-0.69030.494580.24729
Y4-0.1250866410344770.168057-0.74430.4616570.230829
M1-1237.486678312911506.315053-0.82150.4169040.208452
M2-796.2315512518081599.277915-0.49790.621690.310845
M3-2800.839544893401352.024178-2.07160.0457370.022869
M4-3149.699284548741070.086875-2.94340.0057310.002865
M5-830.742747890353944.231106-0.87980.3849640.192482
M6-166.8951921249541010.600647-0.16510.869780.43489
M7-1271.27324638286970.723979-1.30960.1988580.099429
M8-1886.8123772962952.829009-1.98020.0555830.027791
M9-8925.711555540221009.261665-8.843800
M10834.0081922659981625.6220670.5130.6111470.305573
M11-272.6531965214831649.882392-0.16530.8696930.434847
t-28.609901767262919.311086-1.48150.1474140.073707


Multiple Linear Regression - Regression Statistics
Multiple R0.981518378713279
R-squared0.963378327751944
Adjusted R-squared0.945590658374316
F-TEST (value)54.1598962348403
F-TEST (DF numerator)17
F-TEST (DF denominator)35
p-value0
Multiple Linear Regression - Residual Statistics
Residual Standard Deviation937.106244215662
Sum Squared Residuals30735883.9531794

\begin{tabular}{lllllllll}
\hline
Multiple Linear Regression - Regression Statistics \tabularnewline
Multiple R & 0.981518378713279 \tabularnewline
R-squared & 0.963378327751944 \tabularnewline
Adjusted R-squared & 0.945590658374316 \tabularnewline
F-TEST (value) & 54.1598962348403 \tabularnewline
F-TEST (DF numerator) & 17 \tabularnewline
F-TEST (DF denominator) & 35 \tabularnewline
p-value & 0 \tabularnewline
Multiple Linear Regression - Residual Statistics \tabularnewline
Residual Standard Deviation & 937.106244215662 \tabularnewline
Sum Squared Residuals & 30735883.9531794 \tabularnewline
\hline
\end{tabular}
%Source: https://freestatistics.org/blog/index.php?pk=58182&T=3

[TABLE]
[ROW][C]Multiple Linear Regression - Regression Statistics[/C][/ROW]
[ROW][C]Multiple R[/C][C]0.981518378713279[/C][/ROW]
[ROW][C]R-squared[/C][C]0.963378327751944[/C][/ROW]
[ROW][C]Adjusted R-squared[/C][C]0.945590658374316[/C][/ROW]
[ROW][C]F-TEST (value)[/C][C]54.1598962348403[/C][/ROW]
[ROW][C]F-TEST (DF numerator)[/C][C]17[/C][/ROW]
[ROW][C]F-TEST (DF denominator)[/C][C]35[/C][/ROW]
[ROW][C]p-value[/C][C]0[/C][/ROW]
[ROW][C]Multiple Linear Regression - Residual Statistics[/C][/ROW]
[ROW][C]Residual Standard Deviation[/C][C]937.106244215662[/C][/ROW]
[ROW][C]Sum Squared Residuals[/C][C]30735883.9531794[/C][/ROW]
[/TABLE]
Source: https://freestatistics.org/blog/index.php?pk=58182&T=3

Globally Unique Identifier (entire table): ba.freestatistics.org/blog/index.php?pk=58182&T=3

As an alternative you can also use a QR Code:  

The GUIDs for individual cells are displayed in the table below:

Multiple Linear Regression - Regression Statistics
Multiple R0.981518378713279
R-squared0.963378327751944
Adjusted R-squared0.945590658374316
F-TEST (value)54.1598962348403
F-TEST (DF numerator)17
F-TEST (DF denominator)35
p-value0
Multiple Linear Regression - Residual Statistics
Residual Standard Deviation937.106244215662
Sum Squared Residuals30735883.9531794


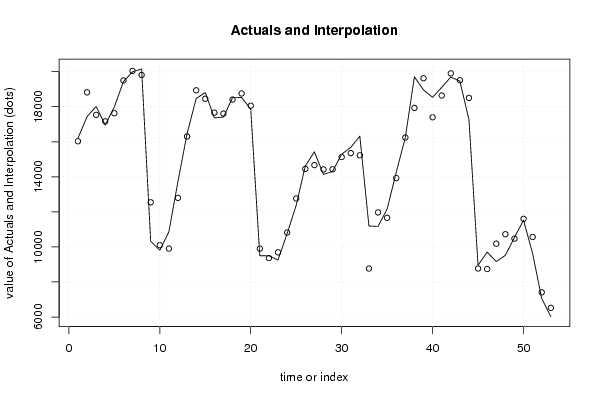
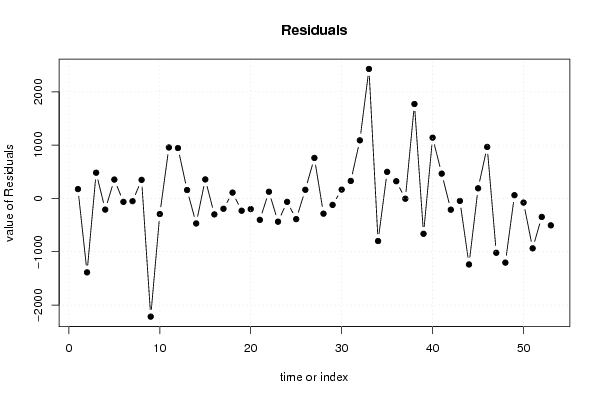
Multiple Linear Regression - Actuals, Interpolation, and Residuals
Time or IndexActualsInterpolationForecastResidualsPrediction Error
11620316027.4740195250175.525980475039
21743218819.1842383708-1387.18423837085
31801417531.1901193002482.809880699819
41695617164.9878649264-208.987864926352
51798217627.8626492226354.13735077738
61943519499.2398142875-64.239814287504
71999020041.3439641976-51.3439641976077
82015419805.6132100469348.386789953138
91032712544.641744657-2217.64174465700
10980710099.9474968022-292.947496802228
11108629905.221651052956.77834894800
121374312797.7991405042945.20085949582
131645816300.3290739922157.670926007802
141846618935.2716758402-469.271675840165
151881018453.3685169252356.631483074835
161736117659.9839229609-298.983922960897
171741117604.8066864470-193.806686447044
181851718407.5405552831109.459444716898
191852518755.5752988062-230.575298806196
201785918058.8717489497-199.871748949702
2194999900.52773700663-401.527737006635
2294909364.40995648836125.590043511638
2392559691.06805817654-436.06805817654
241075810822.3219761968-64.3219761967597
251237512763.6238888048-388.623888804814
261461714454.3196512665162.680348733508
271542714667.0457764288759.954223571198
281413614421.7684224102-285.768422410225
291430814428.8768084923-120.876808492253
301529315127.0576344725165.942365527527
311567915350.3798320845328.620167915513
321631915229.11789112021089.88210887983
33111968766.83279380312429.16720619689
341116911967.8784202523-798.878420252277
351215811659.323943106498.676056894004
361425113928.0956611457322.904338854314
371623716242.301634772-5.30163477198586
381970617934.43850191941771.56149808064
391896019623.0672889446-663.067288944637
401853717396.25774838071140.74225161928
411910318637.8526348609465.147365139086
421969119902.1619959569-211.161995956921
431946419510.7009049117-46.7009049117082
441726418502.3971498833-1238.39714988326
4589578766.99772453326190.002275466745
4697038736.76412645713966.235873542868
47916610185.3863476655-1019.38634766546
48951910722.7832221534-1203.78322215337
491053510474.271382906060.728617093958
501152611603.7859326031-77.785932603132
51963010566.3282984012-936.328298401214
5270617408.0020413218-347.002041321807
5360216525.60122097717-504.601220977169

\begin{tabular}{lllllllll}
\hline
Multiple Linear Regression - Actuals, Interpolation, and Residuals \tabularnewline
Time or Index & Actuals & InterpolationForecast & ResidualsPrediction Error \tabularnewline
1 & 16203 & 16027.4740195250 & 175.525980475039 \tabularnewline
2 & 17432 & 18819.1842383708 & -1387.18423837085 \tabularnewline
3 & 18014 & 17531.1901193002 & 482.809880699819 \tabularnewline
4 & 16956 & 17164.9878649264 & -208.987864926352 \tabularnewline
5 & 17982 & 17627.8626492226 & 354.13735077738 \tabularnewline
6 & 19435 & 19499.2398142875 & -64.239814287504 \tabularnewline
7 & 19990 & 20041.3439641976 & -51.3439641976077 \tabularnewline
8 & 20154 & 19805.6132100469 & 348.386789953138 \tabularnewline
9 & 10327 & 12544.641744657 & -2217.64174465700 \tabularnewline
10 & 9807 & 10099.9474968022 & -292.947496802228 \tabularnewline
11 & 10862 & 9905.221651052 & 956.77834894800 \tabularnewline
12 & 13743 & 12797.7991405042 & 945.20085949582 \tabularnewline
13 & 16458 & 16300.3290739922 & 157.670926007802 \tabularnewline
14 & 18466 & 18935.2716758402 & -469.271675840165 \tabularnewline
15 & 18810 & 18453.3685169252 & 356.631483074835 \tabularnewline
16 & 17361 & 17659.9839229609 & -298.983922960897 \tabularnewline
17 & 17411 & 17604.8066864470 & -193.806686447044 \tabularnewline
18 & 18517 & 18407.5405552831 & 109.459444716898 \tabularnewline
19 & 18525 & 18755.5752988062 & -230.575298806196 \tabularnewline
20 & 17859 & 18058.8717489497 & -199.871748949702 \tabularnewline
21 & 9499 & 9900.52773700663 & -401.527737006635 \tabularnewline
22 & 9490 & 9364.40995648836 & 125.590043511638 \tabularnewline
23 & 9255 & 9691.06805817654 & -436.06805817654 \tabularnewline
24 & 10758 & 10822.3219761968 & -64.3219761967597 \tabularnewline
25 & 12375 & 12763.6238888048 & -388.623888804814 \tabularnewline
26 & 14617 & 14454.3196512665 & 162.680348733508 \tabularnewline
27 & 15427 & 14667.0457764288 & 759.954223571198 \tabularnewline
28 & 14136 & 14421.7684224102 & -285.768422410225 \tabularnewline
29 & 14308 & 14428.8768084923 & -120.876808492253 \tabularnewline
30 & 15293 & 15127.0576344725 & 165.942365527527 \tabularnewline
31 & 15679 & 15350.3798320845 & 328.620167915513 \tabularnewline
32 & 16319 & 15229.1178911202 & 1089.88210887983 \tabularnewline
33 & 11196 & 8766.8327938031 & 2429.16720619689 \tabularnewline
34 & 11169 & 11967.8784202523 & -798.878420252277 \tabularnewline
35 & 12158 & 11659.323943106 & 498.676056894004 \tabularnewline
36 & 14251 & 13928.0956611457 & 322.904338854314 \tabularnewline
37 & 16237 & 16242.301634772 & -5.30163477198586 \tabularnewline
38 & 19706 & 17934.4385019194 & 1771.56149808064 \tabularnewline
39 & 18960 & 19623.0672889446 & -663.067288944637 \tabularnewline
40 & 18537 & 17396.2577483807 & 1140.74225161928 \tabularnewline
41 & 19103 & 18637.8526348609 & 465.147365139086 \tabularnewline
42 & 19691 & 19902.1619959569 & -211.161995956921 \tabularnewline
43 & 19464 & 19510.7009049117 & -46.7009049117082 \tabularnewline
44 & 17264 & 18502.3971498833 & -1238.39714988326 \tabularnewline
45 & 8957 & 8766.99772453326 & 190.002275466745 \tabularnewline
46 & 9703 & 8736.76412645713 & 966.235873542868 \tabularnewline
47 & 9166 & 10185.3863476655 & -1019.38634766546 \tabularnewline
48 & 9519 & 10722.7832221534 & -1203.78322215337 \tabularnewline
49 & 10535 & 10474.2713829060 & 60.728617093958 \tabularnewline
50 & 11526 & 11603.7859326031 & -77.785932603132 \tabularnewline
51 & 9630 & 10566.3282984012 & -936.328298401214 \tabularnewline
52 & 7061 & 7408.0020413218 & -347.002041321807 \tabularnewline
53 & 6021 & 6525.60122097717 & -504.601220977169 \tabularnewline
\hline
\end{tabular}
%Source: https://freestatistics.org/blog/index.php?pk=58182&T=4

[TABLE]
[ROW][C]Multiple Linear Regression - Actuals, Interpolation, and Residuals[/C][/ROW]
[ROW][C]Time or Index[/C][C]Actuals[/C][C]InterpolationForecast[/C][C]ResidualsPrediction Error[/C][/ROW]
[ROW][C]1[/C][C]16203[/C][C]16027.4740195250[/C][C]175.525980475039[/C][/ROW]
[ROW][C]2[/C][C]17432[/C][C]18819.1842383708[/C][C]-1387.18423837085[/C][/ROW]
[ROW][C]3[/C][C]18014[/C][C]17531.1901193002[/C][C]482.809880699819[/C][/ROW]
[ROW][C]4[/C][C]16956[/C][C]17164.9878649264[/C][C]-208.987864926352[/C][/ROW]
[ROW][C]5[/C][C]17982[/C][C]17627.8626492226[/C][C]354.13735077738[/C][/ROW]
[ROW][C]6[/C][C]19435[/C][C]19499.2398142875[/C][C]-64.239814287504[/C][/ROW]
[ROW][C]7[/C][C]19990[/C][C]20041.3439641976[/C][C]-51.3439641976077[/C][/ROW]
[ROW][C]8[/C][C]20154[/C][C]19805.6132100469[/C][C]348.386789953138[/C][/ROW]
[ROW][C]9[/C][C]10327[/C][C]12544.641744657[/C][C]-2217.64174465700[/C][/ROW]
[ROW][C]10[/C][C]9807[/C][C]10099.9474968022[/C][C]-292.947496802228[/C][/ROW]
[ROW][C]11[/C][C]10862[/C][C]9905.221651052[/C][C]956.77834894800[/C][/ROW]
[ROW][C]12[/C][C]13743[/C][C]12797.7991405042[/C][C]945.20085949582[/C][/ROW]
[ROW][C]13[/C][C]16458[/C][C]16300.3290739922[/C][C]157.670926007802[/C][/ROW]
[ROW][C]14[/C][C]18466[/C][C]18935.2716758402[/C][C]-469.271675840165[/C][/ROW]
[ROW][C]15[/C][C]18810[/C][C]18453.3685169252[/C][C]356.631483074835[/C][/ROW]
[ROW][C]16[/C][C]17361[/C][C]17659.9839229609[/C][C]-298.983922960897[/C][/ROW]
[ROW][C]17[/C][C]17411[/C][C]17604.8066864470[/C][C]-193.806686447044[/C][/ROW]
[ROW][C]18[/C][C]18517[/C][C]18407.5405552831[/C][C]109.459444716898[/C][/ROW]
[ROW][C]19[/C][C]18525[/C][C]18755.5752988062[/C][C]-230.575298806196[/C][/ROW]
[ROW][C]20[/C][C]17859[/C][C]18058.8717489497[/C][C]-199.871748949702[/C][/ROW]
[ROW][C]21[/C][C]9499[/C][C]9900.52773700663[/C][C]-401.527737006635[/C][/ROW]
[ROW][C]22[/C][C]9490[/C][C]9364.40995648836[/C][C]125.590043511638[/C][/ROW]
[ROW][C]23[/C][C]9255[/C][C]9691.06805817654[/C][C]-436.06805817654[/C][/ROW]
[ROW][C]24[/C][C]10758[/C][C]10822.3219761968[/C][C]-64.3219761967597[/C][/ROW]
[ROW][C]25[/C][C]12375[/C][C]12763.6238888048[/C][C]-388.623888804814[/C][/ROW]
[ROW][C]26[/C][C]14617[/C][C]14454.3196512665[/C][C]162.680348733508[/C][/ROW]
[ROW][C]27[/C][C]15427[/C][C]14667.0457764288[/C][C]759.954223571198[/C][/ROW]
[ROW][C]28[/C][C]14136[/C][C]14421.7684224102[/C][C]-285.768422410225[/C][/ROW]
[ROW][C]29[/C][C]14308[/C][C]14428.8768084923[/C][C]-120.876808492253[/C][/ROW]
[ROW][C]30[/C][C]15293[/C][C]15127.0576344725[/C][C]165.942365527527[/C][/ROW]
[ROW][C]31[/C][C]15679[/C][C]15350.3798320845[/C][C]328.620167915513[/C][/ROW]
[ROW][C]32[/C][C]16319[/C][C]15229.1178911202[/C][C]1089.88210887983[/C][/ROW]
[ROW][C]33[/C][C]11196[/C][C]8766.8327938031[/C][C]2429.16720619689[/C][/ROW]
[ROW][C]34[/C][C]11169[/C][C]11967.8784202523[/C][C]-798.878420252277[/C][/ROW]
[ROW][C]35[/C][C]12158[/C][C]11659.323943106[/C][C]498.676056894004[/C][/ROW]
[ROW][C]36[/C][C]14251[/C][C]13928.0956611457[/C][C]322.904338854314[/C][/ROW]
[ROW][C]37[/C][C]16237[/C][C]16242.301634772[/C][C]-5.30163477198586[/C][/ROW]
[ROW][C]38[/C][C]19706[/C][C]17934.4385019194[/C][C]1771.56149808064[/C][/ROW]
[ROW][C]39[/C][C]18960[/C][C]19623.0672889446[/C][C]-663.067288944637[/C][/ROW]
[ROW][C]40[/C][C]18537[/C][C]17396.2577483807[/C][C]1140.74225161928[/C][/ROW]
[ROW][C]41[/C][C]19103[/C][C]18637.8526348609[/C][C]465.147365139086[/C][/ROW]
[ROW][C]42[/C][C]19691[/C][C]19902.1619959569[/C][C]-211.161995956921[/C][/ROW]
[ROW][C]43[/C][C]19464[/C][C]19510.7009049117[/C][C]-46.7009049117082[/C][/ROW]
[ROW][C]44[/C][C]17264[/C][C]18502.3971498833[/C][C]-1238.39714988326[/C][/ROW]
[ROW][C]45[/C][C]8957[/C][C]8766.99772453326[/C][C]190.002275466745[/C][/ROW]
[ROW][C]46[/C][C]9703[/C][C]8736.76412645713[/C][C]966.235873542868[/C][/ROW]
[ROW][C]47[/C][C]9166[/C][C]10185.3863476655[/C][C]-1019.38634766546[/C][/ROW]
[ROW][C]48[/C][C]9519[/C][C]10722.7832221534[/C][C]-1203.78322215337[/C][/ROW]
[ROW][C]49[/C][C]10535[/C][C]10474.2713829060[/C][C]60.728617093958[/C][/ROW]
[ROW][C]50[/C][C]11526[/C][C]11603.7859326031[/C][C]-77.785932603132[/C][/ROW]
[ROW][C]51[/C][C]9630[/C][C]10566.3282984012[/C][C]-936.328298401214[/C][/ROW]
[ROW][C]52[/C][C]7061[/C][C]7408.0020413218[/C][C]-347.002041321807[/C][/ROW]
[ROW][C]53[/C][C]6021[/C][C]6525.60122097717[/C][C]-504.601220977169[/C][/ROW]
[/TABLE]
Source: https://freestatistics.org/blog/index.php?pk=58182&T=4

Globally Unique Identifier (entire table): ba.freestatistics.org/blog/index.php?pk=58182&T=4

As an alternative you can also use a QR Code:  

The GUIDs for individual cells are displayed in the table below:

Multiple Linear Regression - Actuals, Interpolation, and Residuals
Time or IndexActualsInterpolationForecastResidualsPrediction Error
11620316027.4740195250175.525980475039
21743218819.1842383708-1387.18423837085
31801417531.1901193002482.809880699819
41695617164.9878649264-208.987864926352
51798217627.8626492226354.13735077738
61943519499.2398142875-64.239814287504
71999020041.3439641976-51.3439641976077
82015419805.6132100469348.386789953138
91032712544.641744657-2217.64174465700
10980710099.9474968022-292.947496802228
11108629905.221651052956.77834894800
121374312797.7991405042945.20085949582
131645816300.3290739922157.670926007802
141846618935.2716758402-469.271675840165
151881018453.3685169252356.631483074835
161736117659.9839229609-298.983922960897
171741117604.8066864470-193.806686447044
181851718407.5405552831109.459444716898
191852518755.5752988062-230.575298806196
201785918058.8717489497-199.871748949702
2194999900.52773700663-401.527737006635
2294909364.40995648836125.590043511638
2392559691.06805817654-436.06805817654
241075810822.3219761968-64.3219761967597
251237512763.6238888048-388.623888804814
261461714454.3196512665162.680348733508
271542714667.0457764288759.954223571198
281413614421.7684224102-285.768422410225
291430814428.8768084923-120.876808492253
301529315127.0576344725165.942365527527
311567915350.3798320845328.620167915513
321631915229.11789112021089.88210887983
33111968766.83279380312429.16720619689
341116911967.8784202523-798.878420252277
351215811659.323943106498.676056894004
361425113928.0956611457322.904338854314
371623716242.301634772-5.30163477198586
381970617934.43850191941771.56149808064
391896019623.0672889446-663.067288944637
401853717396.25774838071140.74225161928
411910318637.8526348609465.147365139086
421969119902.1619959569-211.161995956921
431946419510.7009049117-46.7009049117082
441726418502.3971498833-1238.39714988326
4589578766.99772453326190.002275466745
4697038736.76412645713966.235873542868
47916610185.3863476655-1019.38634766546
48951910722.7832221534-1203.78322215337
491053510474.271382906060.728617093958
501152611603.7859326031-77.785932603132
51963010566.3282984012-936.328298401214
5270617408.0020413218-347.002041321807
5360216525.60122097717-504.601220977169


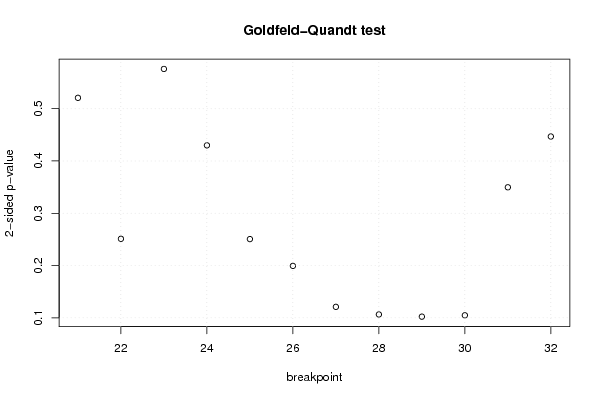
Goldfeld-Quandt test for Heteroskedasticity
p-valuesAlternative Hypothesis
breakpoint indexgreater2-sidedless
210.2603724610199260.5207449220398520.739627538980074
220.1255857372305810.2511714744611620.874414262769419
230.2880004054716670.5760008109433350.711999594528333
240.2149728464707270.4299456929414540.785027153529273
250.1253317836227070.2506635672454140.874668216377293
260.0996867959815790.1993735919631580.900313204018421
270.06053383919358160.1210676783871630.939466160806418
280.05325615799756870.1065123159951370.946743842002431
290.0511602857623430.1023205715246860.948839714237657
300.05245655346079480.1049131069215900.947543446539205
310.174851834292850.34970366858570.82514816570715
320.2233897117004030.4467794234008050.776610288299597

\begin{tabular}{lllllllll}
\hline
Goldfeld-Quandt test for Heteroskedasticity \tabularnewline
p-values & Alternative Hypothesis \tabularnewline
breakpoint index & greater & 2-sided & less \tabularnewline
21 & 0.260372461019926 & 0.520744922039852 & 0.739627538980074 \tabularnewline
22 & 0.125585737230581 & 0.251171474461162 & 0.874414262769419 \tabularnewline
23 & 0.288000405471667 & 0.576000810943335 & 0.711999594528333 \tabularnewline
24 & 0.214972846470727 & 0.429945692941454 & 0.785027153529273 \tabularnewline
25 & 0.125331783622707 & 0.250663567245414 & 0.874668216377293 \tabularnewline
26 & 0.099686795981579 & 0.199373591963158 & 0.900313204018421 \tabularnewline
27 & 0.0605338391935816 & 0.121067678387163 & 0.939466160806418 \tabularnewline
28 & 0.0532561579975687 & 0.106512315995137 & 0.946743842002431 \tabularnewline
29 & 0.051160285762343 & 0.102320571524686 & 0.948839714237657 \tabularnewline
30 & 0.0524565534607948 & 0.104913106921590 & 0.947543446539205 \tabularnewline
31 & 0.17485183429285 & 0.3497036685857 & 0.82514816570715 \tabularnewline
32 & 0.223389711700403 & 0.446779423400805 & 0.776610288299597 \tabularnewline
\hline
\end{tabular}
%Source: https://freestatistics.org/blog/index.php?pk=58182&T=5

[TABLE]
[ROW][C]Goldfeld-Quandt test for Heteroskedasticity[/C][/ROW]
[ROW][C]p-values[/C][C]Alternative Hypothesis[/C][/ROW]
[ROW][C]breakpoint index[/C][C]greater[/C][C]2-sided[/C][C]less[/C][/ROW]
[ROW][C]21[/C][C]0.260372461019926[/C][C]0.520744922039852[/C][C]0.739627538980074[/C][/ROW]
[ROW][C]22[/C][C]0.125585737230581[/C][C]0.251171474461162[/C][C]0.874414262769419[/C][/ROW]
[ROW][C]23[/C][C]0.288000405471667[/C][C]0.576000810943335[/C][C]0.711999594528333[/C][/ROW]
[ROW][C]24[/C][C]0.214972846470727[/C][C]0.429945692941454[/C][C]0.785027153529273[/C][/ROW]
[ROW][C]25[/C][C]0.125331783622707[/C][C]0.250663567245414[/C][C]0.874668216377293[/C][/ROW]
[ROW][C]26[/C][C]0.099686795981579[/C][C]0.199373591963158[/C][C]0.900313204018421[/C][/ROW]
[ROW][C]27[/C][C]0.0605338391935816[/C][C]0.121067678387163[/C][C]0.939466160806418[/C][/ROW]
[ROW][C]28[/C][C]0.0532561579975687[/C][C]0.106512315995137[/C][C]0.946743842002431[/C][/ROW]
[ROW][C]29[/C][C]0.051160285762343[/C][C]0.102320571524686[/C][C]0.948839714237657[/C][/ROW]
[ROW][C]30[/C][C]0.0524565534607948[/C][C]0.104913106921590[/C][C]0.947543446539205[/C][/ROW]
[ROW][C]31[/C][C]0.17485183429285[/C][C]0.3497036685857[/C][C]0.82514816570715[/C][/ROW]
[ROW][C]32[/C][C]0.223389711700403[/C][C]0.446779423400805[/C][C]0.776610288299597[/C][/ROW]
[/TABLE]
Source: https://freestatistics.org/blog/index.php?pk=58182&T=5

Globally Unique Identifier (entire table): ba.freestatistics.org/blog/index.php?pk=58182&T=5

As an alternative you can also use a QR Code:  

The GUIDs for individual cells are displayed in the table below:

Goldfeld-Quandt test for Heteroskedasticity
p-valuesAlternative Hypothesis
breakpoint indexgreater2-sidedless
210.2603724610199260.5207449220398520.739627538980074
220.1255857372305810.2511714744611620.874414262769419
230.2880004054716670.5760008109433350.711999594528333
240.2149728464707270.4299456929414540.785027153529273
250.1253317836227070.2506635672454140.874668216377293
260.0996867959815790.1993735919631580.900313204018421
270.06053383919358160.1210676783871630.939466160806418
280.05325615799756870.1065123159951370.946743842002431
290.0511602857623430.1023205715246860.948839714237657
300.05245655346079480.1049131069215900.947543446539205
310.174851834292850.34970366858570.82514816570715
320.2233897117004030.4467794234008050.776610288299597


Meta Analysis of Goldfeld-Quandt test for Heteroskedasticity
Description# significant tests% significant testsOK/NOK
1% type I error level00OK
5% type I error level00OK
10% type I error level00OK

\begin{tabular}{lllllllll}
\hline
Meta Analysis of Goldfeld-Quandt test for Heteroskedasticity \tabularnewline
Description & # significant tests & % significant tests & OK/NOK \tabularnewline
1% type I error level & 0 & 0 & OK \tabularnewline
5% type I error level & 0 & 0 & OK \tabularnewline
10% type I error level & 0 & 0 & OK \tabularnewline
\hline
\end{tabular}
%Source: https://freestatistics.org/blog/index.php?pk=58182&T=6

[TABLE]
[ROW][C]Meta Analysis of Goldfeld-Quandt test for Heteroskedasticity[/C][/ROW]
[ROW][C]Description[/C][C]# significant tests[/C][C]% significant tests[/C][C]OK/NOK[/C][/ROW]
[ROW][C]1% type I error level[/C][C]0[/C][C]0[/C][C]OK[/C][/ROW]
[ROW][C]5% type I error level[/C][C]0[/C][C]0[/C][C]OK[/C][/ROW]
[ROW][C]10% type I error level[/C][C]0[/C][C]0[/C][C]OK[/C][/ROW]
[/TABLE]
Source: https://freestatistics.org/blog/index.php?pk=58182&T=6

Globally Unique Identifier (entire table): ba.freestatistics.org/blog/index.php?pk=58182&T=6

As an alternative you can also use a QR Code:  

The GUIDs for individual cells are displayed in the table below:

Meta Analysis of Goldfeld-Quandt test for Heteroskedasticity
Description# significant tests% significant testsOK/NOK
1% type I error level00OK
5% type I error level00OK
10% type I error level00OK


Parameters (Session):
par1 = 1 ; par2 = Include Monthly Dummies ; par3 = Linear Trend ;
Parameters (R input):
par1 = 1 ; par2 = Include Monthly Dummies ; par3 = Linear Trend ;
R code (references can be found in the software module):
library(lattice)
library(lmtest)
n25 <- 25 #minimum number of obs. for Goldfeld-Quandt test
par1 <- as.numeric(par1)
x <- t(y)
k <- length(x[1,])
n <- length(x[,1])
x1 <- cbind(x[,par1], x[,1:k!=par1])
mycolnames <- c(colnames(x)[par1], colnames(x)[1:k!=par1])
colnames(x1) <- mycolnames #colnames(x)[par1]
x <- x1
if (par3 == 'First Differences'){
x2 <- array(0, dim=c(n-1,k), dimnames=list(1:(n-1), paste('(1-B)',colnames(x),sep='')))
for (i in 1:n-1) {
for (j in 1:k) {
x2[i,j] <- x[i+1,j] - x[i,j]
}
}
x <- x2
}
if (par2 == 'Include Monthly Dummies'){
x2 <- array(0, dim=c(n,11), dimnames=list(1:n, paste('M', seq(1:11), sep ='')))
for (i in 1:11){
x2[seq(i,n,12),i] <- 1
}
x <- cbind(x, x2)
}
if (par2 == 'Include Quarterly Dummies'){
x2 <- array(0, dim=c(n,3), dimnames=list(1:n, paste('Q', seq(1:3), sep ='')))
for (i in 1:3){
x2[seq(i,n,4),i] <- 1
}
x <- cbind(x, x2)
}
k <- length(x[1,])
if (par3 == 'Linear Trend'){
x <- cbind(x, c(1:n))
colnames(x)[k+1] <- 't'
}
x
k <- length(x[1,])
df <- as.data.frame(x)
(mylm <- lm(df))
(mysum <- summary(mylm))
if (n > n25) {
kp3 <- k + 3
nmkm3 <- n - k - 3
gqarr <- array(NA, dim=c(nmkm3-kp3+1,3))
numgqtests <- 0
numsignificant1 <- 0
numsignificant5 <- 0
numsignificant10 <- 0
for (mypoint in kp3:nmkm3) {
j <- 0
numgqtests <- numgqtests + 1
for (myalt in c('greater', 'two.sided', 'less')) {
j <- j + 1
gqarr[mypoint-kp3+1,j] <- gqtest(mylm, point=mypoint, alternative=myalt)$p.value
}
if (gqarr[mypoint-kp3+1,2] < 0.01) numsignificant1 <- numsignificant1 + 1
if (gqarr[mypoint-kp3+1,2] < 0.05) numsignificant5 <- numsignificant5 + 1
if (gqarr[mypoint-kp3+1,2] < 0.10) numsignificant10 <- numsignificant10 + 1
}
gqarr
}
bitmap(file='test0.png')
plot(x[,1], type='l', main='Actuals and Interpolation', ylab='value of Actuals and Interpolation (dots)', xlab='time or index')
points(x[,1]-mysum$resid)
grid()
dev.off()
bitmap(file='test1.png')
plot(mysum$resid, type='b', pch=19, main='Residuals', ylab='value of Residuals', xlab='time or index')
grid()
dev.off()
bitmap(file='test2.png')
hist(mysum$resid, main='Residual Histogram', xlab='values of Residuals')
grid()
dev.off()
bitmap(file='test3.png')
densityplot(~mysum$resid,col='black',main='Residual Density Plot', xlab='values of Residuals')
dev.off()
bitmap(file='test4.png')
qqnorm(mysum$resid, main='Residual Normal Q-Q Plot')
qqline(mysum$resid)
grid()
dev.off()
(myerror <- as.ts(mysum$resid))
bitmap(file='test5.png')
dum <- cbind(lag(myerror,k=1),myerror)
dum
dum1 <- dum[2:length(myerror),]
dum1
z <- as.data.frame(dum1)
z
plot(z,main=paste('Residual Lag plot, lowess, and regression line'), ylab='values of Residuals', xlab='lagged values of Residuals')
lines(lowess(z))
abline(lm(z))
grid()
dev.off()
bitmap(file='test6.png')
acf(mysum$resid, lag.max=length(mysum$resid)/2, main='Residual Autocorrelation Function')
grid()
dev.off()
bitmap(file='test7.png')
pacf(mysum$resid, lag.max=length(mysum$resid)/2, main='Residual Partial Autocorrelation Function')
grid()
dev.off()
bitmap(file='test8.png')
opar <- par(mfrow = c(2,2), oma = c(0, 0, 1.1, 0))
plot(mylm, las = 1, sub='Residual Diagnostics')
par(opar)
dev.off()
if (n > n25) {
bitmap(file='test9.png')
plot(kp3:nmkm3,gqarr[,2], main='Goldfeld-Quandt test',ylab='2-sided p-value',xlab='breakpoint')
grid()
dev.off()
}
load(file='createtable')
a<-table.start()
a<-table.row.start(a)
a<-table.element(a, 'Multiple Linear Regression - Estimated Regression Equation', 1, TRUE)
a<-table.row.end(a)
myeq <- colnames(x)[1]
myeq <- paste(myeq, '[t] = ', sep='')
for (i in 1:k){
if (mysum$coefficients[i,1] > 0) myeq <- paste(myeq, '+', '')
myeq <- paste(myeq, mysum$coefficients[i,1], sep=' ')
if (rownames(mysum$coefficients)[i] != '(Intercept)') {
myeq <- paste(myeq, rownames(mysum$coefficients)[i], sep='')
if (rownames(mysum$coefficients)[i] != 't') myeq <- paste(myeq, '[t]', sep='')
}
}
myeq <- paste(myeq, ' + e[t]')
a<-table.row.start(a)
a<-table.element(a, myeq)
a<-table.row.end(a)
a<-table.end(a)
table.save(a,file='mytable1.tab')
a<-table.start()
a<-table.row.start(a)
a<-table.element(a,hyperlink('ols1.htm','Multiple Linear Regression - Ordinary Least Squares',''), 6, TRUE)
a<-table.row.end(a)
a<-table.row.start(a)
a<-table.element(a,'Variable',header=TRUE)
a<-table.element(a,'Parameter',header=TRUE)
a<-table.element(a,'S.D.',header=TRUE)
a<-table.element(a,'T-STAT
H0: parameter = 0',header=TRUE)
a<-table.element(a,'2-tail p-value',header=TRUE)
a<-table.element(a,'1-tail p-value',header=TRUE)
a<-table.row.end(a)
for (i in 1:k){
a<-table.row.start(a)
a<-table.element(a,rownames(mysum$coefficients)[i],header=TRUE)
a<-table.element(a,mysum$coefficients[i,1])
a<-table.element(a, round(mysum$coefficients[i,2],6))
a<-table.element(a, round(mysum$coefficients[i,3],4))
a<-table.element(a, round(mysum$coefficients[i,4],6))
a<-table.element(a, round(mysum$coefficients[i,4]/2,6))
a<-table.row.end(a)
}
a<-table.end(a)
table.save(a,file='mytable2.tab')
a<-table.start()
a<-table.row.start(a)
a<-table.element(a, 'Multiple Linear Regression - Regression Statistics', 2, TRUE)
a<-table.row.end(a)
a<-table.row.start(a)
a<-table.element(a, 'Multiple R',1,TRUE)
a<-table.element(a, sqrt(mysum$r.squared))
a<-table.row.end(a)
a<-table.row.start(a)
a<-table.element(a, 'R-squared',1,TRUE)
a<-table.element(a, mysum$r.squared)
a<-table.row.end(a)
a<-table.row.start(a)
a<-table.element(a, 'Adjusted R-squared',1,TRUE)
a<-table.element(a, mysum$adj.r.squared)
a<-table.row.end(a)
a<-table.row.start(a)
a<-table.element(a, 'F-TEST (value)',1,TRUE)
a<-table.element(a, mysum$fstatistic[1])
a<-table.row.end(a)
a<-table.row.start(a)
a<-table.element(a, 'F-TEST (DF numerator)',1,TRUE)
a<-table.element(a, mysum$fstatistic[2])
a<-table.row.end(a)
a<-table.row.start(a)
a<-table.element(a, 'F-TEST (DF denominator)',1,TRUE)
a<-table.element(a, mysum$fstatistic[3])
a<-table.row.end(a)
a<-table.row.start(a)
a<-table.element(a, 'p-value',1,TRUE)
a<-table.element(a, 1-pf(mysum$fstatistic[1],mysum$fstatistic[2],mysum$fstatistic[3]))
a<-table.row.end(a)
a<-table.row.start(a)
a<-table.element(a, 'Multiple Linear Regression - Residual Statistics', 2, TRUE)
a<-table.row.end(a)
a<-table.row.start(a)
a<-table.element(a, 'Residual Standard Deviation',1,TRUE)
a<-table.element(a, mysum$sigma)
a<-table.row.end(a)
a<-table.row.start(a)
a<-table.element(a, 'Sum Squared Residuals',1,TRUE)
a<-table.element(a, sum(myerror*myerror))
a<-table.row.end(a)
a<-table.end(a)
table.save(a,file='mytable3.tab')
a<-table.start()
a<-table.row.start(a)
a<-table.element(a, 'Multiple Linear Regression - Actuals, Interpolation, and Residuals', 4, TRUE)
a<-table.row.end(a)
a<-table.row.start(a)
a<-table.element(a, 'Time or Index', 1, TRUE)
a<-table.element(a, 'Actuals', 1, TRUE)
a<-table.element(a, 'Interpolation
Forecast', 1, TRUE)
a<-table.element(a, 'Residuals
Prediction Error', 1, TRUE)
a<-table.row.end(a)
for (i in 1:n) {
a<-table.row.start(a)
a<-table.element(a,i, 1, TRUE)
a<-table.element(a,x[i])
a<-table.element(a,x[i]-mysum$resid[i])
a<-table.element(a,mysum$resid[i])
a<-table.row.end(a)
}
a<-table.end(a)
table.save(a,file='mytable4.tab')
if (n > n25) {
a<-table.start()
a<-table.row.start(a)
a<-table.element(a,'Goldfeld-Quandt test for Heteroskedasticity',4,TRUE)
a<-table.row.end(a)
a<-table.row.start(a)
a<-table.element(a,'p-values',header=TRUE)
a<-table.element(a,'Alternative Hypothesis',3,header=TRUE)
a<-table.row.end(a)
a<-table.row.start(a)
a<-table.element(a,'breakpoint index',header=TRUE)
a<-table.element(a,'greater',header=TRUE)
a<-table.element(a,'2-sided',header=TRUE)
a<-table.element(a,'less',header=TRUE)
a<-table.row.end(a)
for (mypoint in kp3:nmkm3) {
a<-table.row.start(a)
a<-table.element(a,mypoint,header=TRUE)
a<-table.element(a,gqarr[mypoint-kp3+1,1])
a<-table.element(a,gqarr[mypoint-kp3+1,2])
a<-table.element(a,gqarr[mypoint-kp3+1,3])
a<-table.row.end(a)
}
a<-table.end(a)
table.save(a,file='mytable5.tab')
a<-table.start()
a<-table.row.start(a)
a<-table.element(a,'Meta Analysis of Goldfeld-Quandt test for Heteroskedasticity',4,TRUE)
a<-table.row.end(a)
a<-table.row.start(a)
a<-table.element(a,'Description',header=TRUE)
a<-table.element(a,'# significant tests',header=TRUE)
a<-table.element(a,'% significant tests',header=TRUE)
a<-table.element(a,'OK/NOK',header=TRUE)
a<-table.row.end(a)
a<-table.row.start(a)
a<-table.element(a,'1% type I error level',header=TRUE)
a<-table.element(a,numsignificant1)
a<-table.element(a,numsignificant1/numgqtests)
if (numsignificant1/numgqtests < 0.01) dum <- 'OK' else dum <- 'NOK'
a<-table.element(a,dum)
a<-table.row.end(a)
a<-table.row.start(a)
a<-table.element(a,'5% type I error level',header=TRUE)
a<-table.element(a,numsignificant5)
a<-table.element(a,numsignificant5/numgqtests)
if (numsignificant5/numgqtests < 0.05) dum <- 'OK' else dum <- 'NOK'
a<-table.element(a,dum)
a<-table.row.end(a)
a<-table.row.start(a)
a<-table.element(a,'10% type I error level',header=TRUE)
a<-table.element(a,numsignificant10)
a<-table.element(a,numsignificant10/numgqtests)
if (numsignificant10/numgqtests < 0.1) dum <- 'OK' else dum <- 'NOK'
a<-table.element(a,dum)
a<-table.row.end(a)
a<-table.end(a)
table.save(a,file='mytable6.tab')
}