| Multiple Linear Regression - Estimated Regression Equation |
| Y[t] = + 5039.52273540422 + 0.152568870939067X[t] + 1.21721358419328Y1[t] -0.158914826056032Y2[t] -0.133371695416324Y3[t] -0.125086641034477Y4[t] -1237.48667831291M1[t] -796.231551251808M2[t] -2800.83954489340M3[t] -3149.69928454874M4[t] -830.742747890353M5[t] -166.895192124954M6[t] -1271.27324638286M7[t] -1886.8123772962M8[t] -8925.71155554022M9[t] + 834.008192265998M10[t] -272.653196521483M11[t] -28.6099017672629t + e[t] |
| Multiple Linear Regression - Ordinary Least Squares | |||||
| Variable | Parameter | S.D. | T-STAT H0: parameter = 0 | 2-tail p-value | 1-tail p-value |
| (Intercept) | 5039.52273540422 | 4459.361381 | 1.1301 | 0.26612 | 0.13306 |
| X | 0.152568870939067 | 0.269625 | 0.5659 | 0.575101 | 0.287551 |
| Y1 | 1.21721358419328 | 0.177406 | 6.8612 | 0 | 0 |
| Y2 | -0.158914826056032 | 0.268997 | -0.5908 | 0.558471 | 0.279236 |
| Y3 | -0.133371695416324 | 0.193218 | -0.6903 | 0.49458 | 0.24729 |
| Y4 | -0.125086641034477 | 0.168057 | -0.7443 | 0.461657 | 0.230829 |
| M1 | -1237.48667831291 | 1506.315053 | -0.8215 | 0.416904 | 0.208452 |
| M2 | -796.231551251808 | 1599.277915 | -0.4979 | 0.62169 | 0.310845 |
| M3 | -2800.83954489340 | 1352.024178 | -2.0716 | 0.045737 | 0.022869 |
| M4 | -3149.69928454874 | 1070.086875 | -2.9434 | 0.005731 | 0.002865 |
| M5 | -830.742747890353 | 944.231106 | -0.8798 | 0.384964 | 0.192482 |
| M6 | -166.895192124954 | 1010.600647 | -0.1651 | 0.86978 | 0.43489 |
| M7 | -1271.27324638286 | 970.723979 | -1.3096 | 0.198858 | 0.099429 |
| M8 | -1886.8123772962 | 952.829009 | -1.9802 | 0.055583 | 0.027791 |
| M9 | -8925.71155554022 | 1009.261665 | -8.8438 | 0 | 0 |
| M10 | 834.008192265998 | 1625.622067 | 0.513 | 0.611147 | 0.305573 |
| M11 | -272.653196521483 | 1649.882392 | -0.1653 | 0.869693 | 0.434847 |
| t | -28.6099017672629 | 19.311086 | -1.4815 | 0.147414 | 0.073707 |
| Multiple Linear Regression - Regression Statistics | |
| Multiple R | 0.981518378713279 |
| R-squared | 0.963378327751944 |
| Adjusted R-squared | 0.945590658374316 |
| F-TEST (value) | 54.1598962348403 |
| F-TEST (DF numerator) | 17 |
| F-TEST (DF denominator) | 35 |
| p-value | 0 |
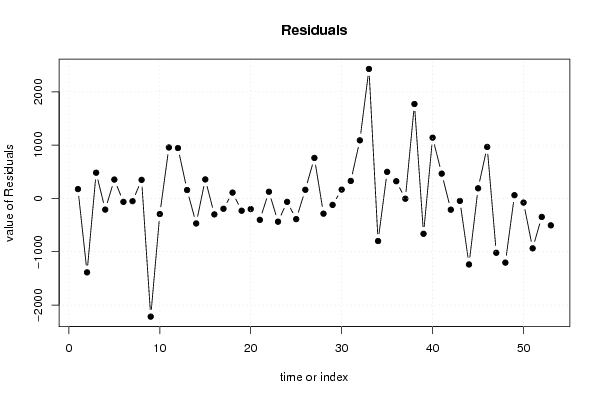
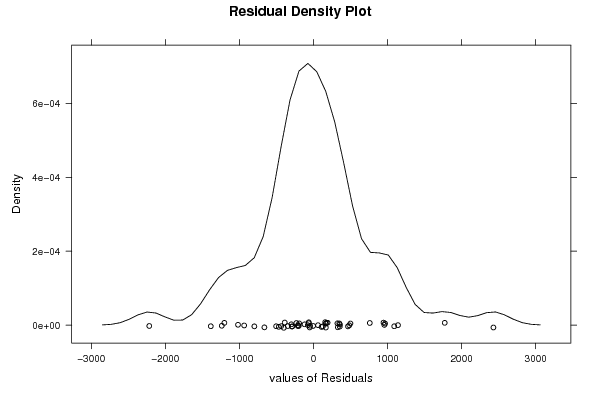
| Multiple Linear Regression - Residual Statistics | |
| Residual Standard Deviation | 937.106244215662 |
| Sum Squared Residuals | 30735883.9531794 |
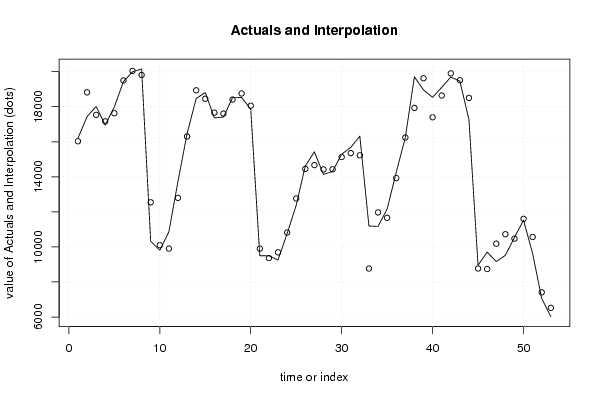
| Multiple Linear Regression - Actuals, Interpolation, and Residuals | |||
| Time or Index | Actuals | Interpolation Forecast | Residuals Prediction Error |
| 1 | 16203 | 16027.4740195250 | 175.525980475039 |
| 2 | 17432 | 18819.1842383708 | -1387.18423837085 |
| 3 | 18014 | 17531.1901193002 | 482.809880699819 |
| 4 | 16956 | 17164.9878649264 | -208.987864926352 |
| 5 | 17982 | 17627.8626492226 | 354.13735077738 |
| 6 | 19435 | 19499.2398142875 | -64.239814287504 |
| 7 | 19990 | 20041.3439641976 | -51.3439641976077 |
| 8 | 20154 | 19805.6132100469 | 348.386789953138 |
| 9 | 10327 | 12544.641744657 | -2217.64174465700 |
| 10 | 9807 | 10099.9474968022 | -292.947496802228 |
| 11 | 10862 | 9905.221651052 | 956.77834894800 |
| 12 | 13743 | 12797.7991405042 | 945.20085949582 |
| 13 | 16458 | 16300.3290739922 | 157.670926007802 |
| 14 | 18466 | 18935.2716758402 | -469.271675840165 |
| 15 | 18810 | 18453.3685169252 | 356.631483074835 |
| 16 | 17361 | 17659.9839229609 | -298.983922960897 |
| 17 | 17411 | 17604.8066864470 | -193.806686447044 |
| 18 | 18517 | 18407.5405552831 | 109.459444716898 |
| 19 | 18525 | 18755.5752988062 | -230.575298806196 |
| 20 | 17859 | 18058.8717489497 | -199.871748949702 |
| 21 | 9499 | 9900.52773700663 | -401.527737006635 |
| 22 | 9490 | 9364.40995648836 | 125.590043511638 |
| 23 | 9255 | 9691.06805817654 | -436.06805817654 |
| 24 | 10758 | 10822.3219761968 | -64.3219761967597 |
| 25 | 12375 | 12763.6238888048 | -388.623888804814 |
| 26 | 14617 | 14454.3196512665 | 162.680348733508 |
| 27 | 15427 | 14667.0457764288 | 759.954223571198 |
| 28 | 14136 | 14421.7684224102 | -285.768422410225 |
| 29 | 14308 | 14428.8768084923 | -120.876808492253 |
| 30 | 15293 | 15127.0576344725 | 165.942365527527 |
| 31 | 15679 | 15350.3798320845 | 328.620167915513 |
| 32 | 16319 | 15229.1178911202 | 1089.88210887983 |
| 33 | 11196 | 8766.8327938031 | 2429.16720619689 |
| 34 | 11169 | 11967.8784202523 | -798.878420252277 |
| 35 | 12158 | 11659.323943106 | 498.676056894004 |
| 36 | 14251 | 13928.0956611457 | 322.904338854314 |
| 37 | 16237 | 16242.301634772 | -5.30163477198586 |
| 38 | 19706 | 17934.4385019194 | 1771.56149808064 |
| 39 | 18960 | 19623.0672889446 | -663.067288944637 |
| 40 | 18537 | 17396.2577483807 | 1140.74225161928 |
| 41 | 19103 | 18637.8526348609 | 465.147365139086 |
| 42 | 19691 | 19902.1619959569 | -211.161995956921 |
| 43 | 19464 | 19510.7009049117 | -46.7009049117082 |
| 44 | 17264 | 18502.3971498833 | -1238.39714988326 |
| 45 | 8957 | 8766.99772453326 | 190.002275466745 |
| 46 | 9703 | 8736.76412645713 | 966.235873542868 |
| 47 | 9166 | 10185.3863476655 | -1019.38634766546 |
| 48 | 9519 | 10722.7832221534 | -1203.78322215337 |
| 49 | 10535 | 10474.2713829060 | 60.728617093958 |
| 50 | 11526 | 11603.7859326031 | -77.785932603132 |
| 51 | 9630 | 10566.3282984012 | -936.328298401214 |
| 52 | 7061 | 7408.0020413218 | -347.002041321807 |
| 53 | 6021 | 6525.60122097717 | -504.601220977169 |
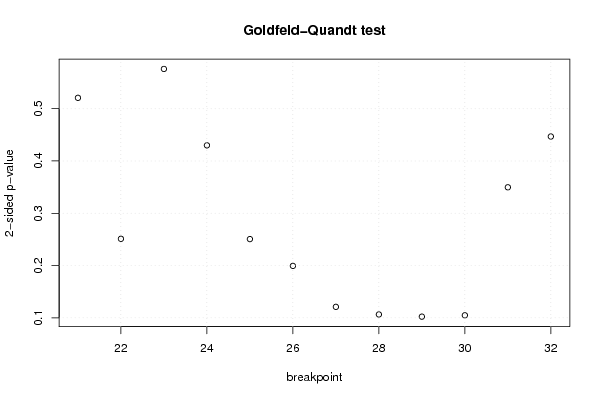
| Goldfeld-Quandt test for Heteroskedasticity | |||
| p-values | Alternative Hypothesis | ||
| breakpoint index | greater | 2-sided | less |
| 21 | 0.260372461019926 | 0.520744922039852 | 0.739627538980074 |
| 22 | 0.125585737230581 | 0.251171474461162 | 0.874414262769419 |
| 23 | 0.288000405471667 | 0.576000810943335 | 0.711999594528333 |
| 24 | 0.214972846470727 | 0.429945692941454 | 0.785027153529273 |
| 25 | 0.125331783622707 | 0.250663567245414 | 0.874668216377293 |
| 26 | 0.099686795981579 | 0.199373591963158 | 0.900313204018421 |
| 27 | 0.0605338391935816 | 0.121067678387163 | 0.939466160806418 |
| 28 | 0.0532561579975687 | 0.106512315995137 | 0.946743842002431 |
| 29 | 0.051160285762343 | 0.102320571524686 | 0.948839714237657 |
| 30 | 0.0524565534607948 | 0.104913106921590 | 0.947543446539205 |
| 31 | 0.17485183429285 | 0.3497036685857 | 0.82514816570715 |
| 32 | 0.223389711700403 | 0.446779423400805 | 0.776610288299597 |
| Meta Analysis of Goldfeld-Quandt test for Heteroskedasticity | |||
| Description | # significant tests | % significant tests | OK/NOK |
| 1% type I error level | 0 | 0 | OK |
| 5% type I error level | 0 | 0 | OK |
| 10% type I error level | 0 | 0 | OK |