| Multiple Linear Regression - Estimated Regression Equation |
| Y[t] = + 104.905263157895 -0.880938833570407X[t] + e[t] |
| Multiple Linear Regression - Ordinary Least Squares | |||||
| Variable | Parameter | S.D. | T-STAT H0: parameter = 0 | 2-tail p-value | 1-tail p-value |
| (Intercept) | 104.905263157895 | 2.277194 | 46.0678 | 0 | 0 |
| X | -0.880938833570407 | 2.801516 | -0.3145 | 0.75439 | 0.377195 |
| Multiple Linear Regression - Regression Statistics | |
| Multiple R | 0.0427522005347858 |
| R-squared | 0.00182775065056654 |
| Adjusted R-squared | -0.0166569206336824 |
| F-TEST (value) | 0.0988792617656127 |
| F-TEST (DF numerator) | 1 |
| F-TEST (DF denominator) | 54 |
| p-value | 0.754390470610119 |
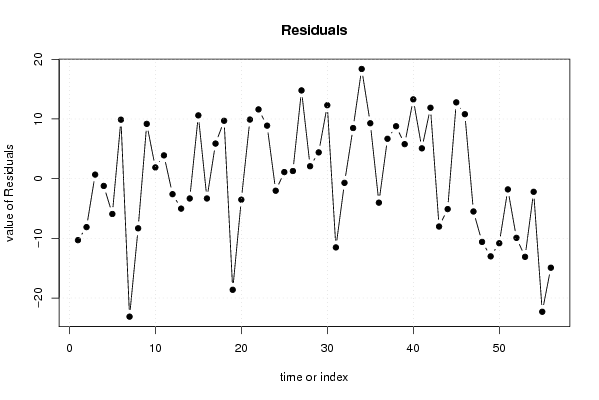
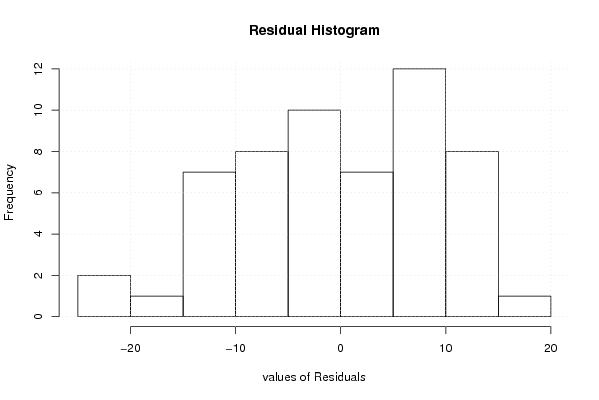
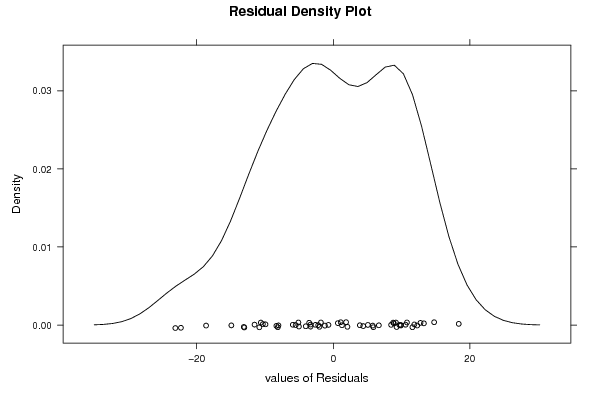
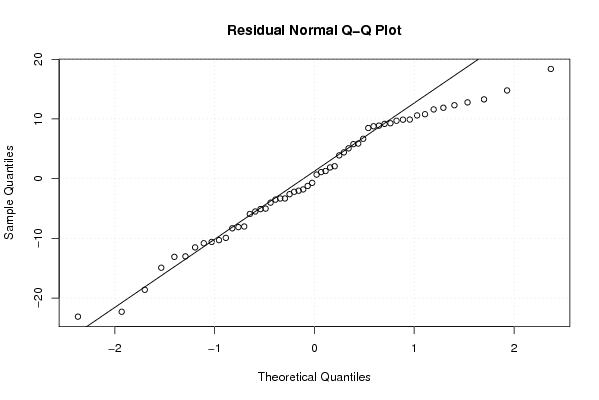
| Multiple Linear Regression - Residual Statistics | |
| Residual Standard Deviation | 9.9260577212226 |
| Sum Squared Residuals | 5320.43758179232 |
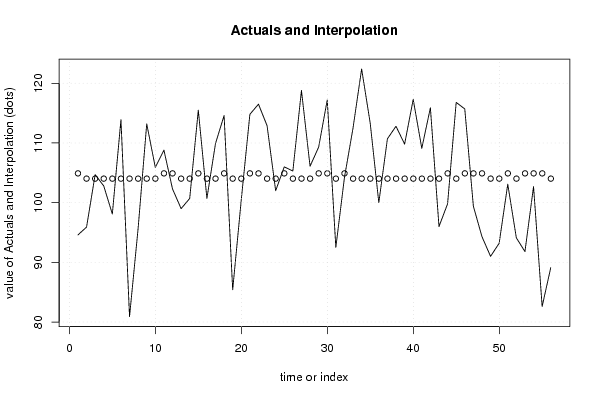
| Multiple Linear Regression - Actuals, Interpolation, and Residuals | |||
| Time or Index | Actuals | Interpolation Forecast | Residuals Prediction Error |
| 1 | 94.6 | 104.905263157895 | -10.3052631578949 |
| 2 | 95.9 | 104.024324324324 | -8.12432432432433 |
| 3 | 104.7 | 104.024324324324 | 0.675675675675677 |
| 4 | 102.8 | 104.024324324324 | -1.22432432432433 |
| 5 | 98.1 | 104.024324324324 | -5.92432432432433 |
| 6 | 113.9 | 104.024324324324 | 9.87567567567568 |
| 7 | 80.9 | 104.024324324324 | -23.1243243243243 |
| 8 | 95.7 | 104.024324324324 | -8.32432432432432 |
| 9 | 113.2 | 104.024324324324 | 9.17567567567568 |
| 10 | 105.9 | 104.024324324324 | 1.87567567567568 |
| 11 | 108.8 | 104.905263157895 | 3.89473684210527 |
| 12 | 102.3 | 104.905263157895 | -2.60526315789473 |
| 13 | 99 | 104.024324324324 | -5.02432432432433 |
| 14 | 100.7 | 104.024324324324 | -3.32432432432432 |
| 15 | 115.5 | 104.905263157895 | 10.5947368421053 |
| 16 | 100.7 | 104.024324324324 | -3.32432432432432 |
| 17 | 109.9 | 104.024324324324 | 5.87567567567568 |
| 18 | 114.6 | 104.905263157895 | 9.69473684210526 |
| 19 | 85.4 | 104.024324324324 | -18.6243243243243 |
| 20 | 100.5 | 104.024324324324 | -3.52432432432433 |
| 21 | 114.8 | 104.905263157895 | 9.89473684210527 |
| 22 | 116.5 | 104.905263157895 | 11.5947368421053 |
| 23 | 112.9 | 104.024324324324 | 8.87567567567568 |
| 24 | 102 | 104.024324324324 | -2.02432432432433 |
| 25 | 106 | 104.905263157895 | 1.09473684210527 |
| 26 | 105.3 | 104.024324324324 | 1.27567567567567 |
| 27 | 118.8 | 104.024324324324 | 14.7756756756757 |
| 28 | 106.1 | 104.024324324324 | 2.07567567567567 |
| 29 | 109.3 | 104.905263157895 | 4.39473684210527 |
| 30 | 117.2 | 104.905263157895 | 12.2947368421053 |
| 31 | 92.5 | 104.024324324324 | -11.5243243243243 |
| 32 | 104.2 | 104.905263157895 | -0.705263157894728 |
| 33 | 112.5 | 104.024324324324 | 8.47567567567567 |
| 34 | 122.4 | 104.024324324324 | 18.3756756756757 |
| 35 | 113.3 | 104.024324324324 | 9.27567567567567 |
| 36 | 100 | 104.024324324324 | -4.02432432432433 |
| 37 | 110.7 | 104.024324324324 | 6.67567567567568 |
| 38 | 112.8 | 104.024324324324 | 8.77567567567567 |
| 39 | 109.8 | 104.024324324324 | 5.77567567567567 |
| 40 | 117.3 | 104.024324324324 | 13.2756756756757 |
| 41 | 109.1 | 104.024324324324 | 5.07567567567567 |
| 42 | 115.9 | 104.024324324324 | 11.8756756756757 |
| 43 | 96 | 104.024324324324 | -8.02432432432433 |
| 44 | 99.8 | 104.905263157895 | -5.10526315789473 |
| 45 | 116.8 | 104.024324324324 | 12.7756756756757 |
| 46 | 115.7 | 104.905263157895 | 10.7947368421053 |
| 47 | 99.4 | 104.905263157895 | -5.50526315789472 |
| 48 | 94.3 | 104.905263157895 | -10.6052631578947 |
| 49 | 91 | 104.024324324324 | -13.0243243243243 |
| 50 | 93.2 | 104.024324324324 | -10.8243243243243 |
| 51 | 103.1 | 104.905263157895 | -1.80526315789474 |
| 52 | 94.1 | 104.024324324324 | -9.92432432432433 |
| 53 | 91.8 | 104.905263157895 | -13.1052631578947 |
| 54 | 102.7 | 104.905263157895 | -2.20526315789473 |
| 55 | 82.6 | 104.905263157895 | -22.3052631578947 |
| 56 | 89.1 | 104.024324324324 | -14.9243243243243 |
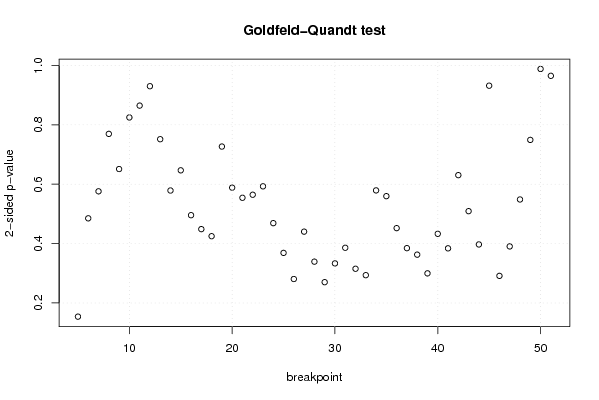
| Goldfeld-Quandt test for Heteroskedasticity | |||
| p-values | Alternative Hypothesis | ||
| breakpoint index | greater | 2-sided | less |
| 5 | 0.0769445609977064 | 0.153889121995413 | 0.923055439002294 |
| 6 | 0.242584774842380 | 0.485169549684759 | 0.75741522515762 |
| 7 | 0.71194176921252 | 0.576116461574961 | 0.288058230787481 |
| 8 | 0.615191684642902 | 0.769616630714196 | 0.384808315357098 |
| 9 | 0.67444073793005 | 0.6511185241399 | 0.32555926206995 |
| 10 | 0.58754701219993 | 0.82490597560014 | 0.41245298780007 |
| 11 | 0.567597664334845 | 0.86480467133031 | 0.432402335665155 |
| 12 | 0.465074326952916 | 0.930148653905831 | 0.534925673047084 |
| 13 | 0.375819259642542 | 0.751638519285083 | 0.624180740357458 |
| 14 | 0.289387510168005 | 0.578775020336009 | 0.710612489831995 |
| 15 | 0.323399985958005 | 0.64679997191601 | 0.676600014041995 |
| 16 | 0.247837963355304 | 0.495675926710608 | 0.752162036644696 |
| 17 | 0.224347393605276 | 0.448694787210552 | 0.775652606394724 |
| 18 | 0.212467008051156 | 0.424934016102313 | 0.787532991948844 |
| 19 | 0.363415338599363 | 0.726830677198727 | 0.636584661400637 |
| 20 | 0.2941976378515 | 0.5883952757030 | 0.7058023621485 |
| 21 | 0.277157501979427 | 0.554315003958854 | 0.722842498020573 |
| 22 | 0.282284241787079 | 0.564568483574158 | 0.717715758212921 |
| 23 | 0.296467008641802 | 0.592934017283605 | 0.703532991358198 |
| 24 | 0.234432659015944 | 0.468865318031888 | 0.765567340984056 |
| 25 | 0.184346437396219 | 0.368692874792437 | 0.815653562603781 |
| 26 | 0.140345602173351 | 0.280691204346703 | 0.859654397826649 |
| 27 | 0.220141584000948 | 0.440283168001896 | 0.779858415999052 |
| 28 | 0.169578728253236 | 0.339157456506471 | 0.830421271746764 |
| 29 | 0.135004121219399 | 0.270008242438799 | 0.8649958787806 |
| 30 | 0.166615811381745 | 0.333231622763491 | 0.833384188618255 |
| 31 | 0.192928567993643 | 0.385857135987286 | 0.807071432006357 |
| 32 | 0.157626244459011 | 0.315252488918021 | 0.84237375554099 |
| 33 | 0.146796196746138 | 0.293592393492276 | 0.853203803253862 |
| 34 | 0.289602131787374 | 0.579204263574748 | 0.710397868212626 |
| 35 | 0.279865126540874 | 0.559730253081748 | 0.720134873459126 |
| 36 | 0.226039466701503 | 0.452078933403005 | 0.773960533298497 |
| 37 | 0.192312621891145 | 0.38462524378229 | 0.807687378108855 |
| 38 | 0.181353128916851 | 0.362706257833702 | 0.81864687108315 |
| 39 | 0.149887674707983 | 0.299775349415967 | 0.850112325292017 |
| 40 | 0.216475449324352 | 0.432950898648705 | 0.783524550675648 |
| 41 | 0.192022245302091 | 0.384044490604182 | 0.80797775469791 |
| 42 | 0.315265681679281 | 0.630531363358562 | 0.684734318320719 |
| 43 | 0.254610075860285 | 0.50922015172057 | 0.745389924139715 |
| 44 | 0.198559934029665 | 0.397119868059329 | 0.801440065970335 |
| 45 | 0.534048722569906 | 0.931902554860188 | 0.465951277430094 |
| 46 | 0.854343265629178 | 0.291313468741643 | 0.145656734370822 |
| 47 | 0.804757688849777 | 0.390484622300446 | 0.195242311150223 |
| 48 | 0.7256806939706 | 0.5486386120588 | 0.2743193060294 |
| 49 | 0.625354213589077 | 0.749291572821846 | 0.374645786410923 |
| 50 | 0.494142039836367 | 0.988284079672733 | 0.505857960163633 |
| 51 | 0.482584036656949 | 0.965168073313897 | 0.517415963343051 |
| Meta Analysis of Goldfeld-Quandt test for Heteroskedasticity | |||
| Description | # significant tests | % significant tests | OK/NOK |
| 1% type I error level | 0 | 0 | OK |
| 5% type I error level | 0 | 0 | OK |
| 10% type I error level | 0 | 0 | OK |