Free Statistics

of Irreproducible Research!

Author's title

Author*The author of this computation has been verified*
R Software Modulerwasp_multipleregression.wasp
Title produced by softwareMultiple Regression
Date of computationFri, 20 Nov 2009 07:20:51 -0700
Cite this page as followsStatistical Computations at FreeStatistics.org, Office for Research Development and Education, URL https://freestatistics.org/blog/index.php?v=date/2009/Nov/20/t1258726980fg6dws72zz72gna.htm/, Retrieved Sat, 20 Apr 2024 02:54:37 +0000
Statistical Computations at FreeStatistics.org, Office for Research Development and Education, URL https://freestatistics.org/blog/index.php?pk=58200, Retrieved Sat, 20 Apr 2024 02:54:37 +0000
QR Codes:

Original text written by user:
IsPrivate?No (this computation is public)
User-defined keywords
Estimated Impact138
Family? (F = Feedback message, R = changed R code, M = changed R Module, P = changed Parameters, D = changed Data)
-     [Multiple Regression] [Q1 The Seatbeltlaw] [2007-11-14 19:27:43] [8cd6641b921d30ebe00b648d1481bba0]
- RMPD  [Multiple Regression] [Seatbelt] [2009-11-12 14:03:14] [b98453cac15ba1066b407e146608df68]
-    D      [Multiple Regression] [] [2009-11-20 14:20:51] [865cd78857e928bd6e7d79509c6cdcc5] [Current]
-   PD        [Multiple Regression] [] [2009-11-20 17:41:18] [fa44bc1b850de3469c0e3e9a5981c418]
Feedback Forum

Post a new message
Dataseries X:
20.3	3016
20	2155
19.2	2172
21.8	2150
21.3	2533
21.5	2058
19.5	2160
19.5	2260
19.7	2498
18.7	2695
19.7	2799
20	2946
19.7	2930
19.2	2318
19.7	2540
22	2570
21.8	2669
22.8	2450
21	2842
25	3440
23.3	2678
25	2981
26.8	2260
25.3	2844
26.5	2546
27.8	2456
22	2295
22.3	2379
28	2479
25	2057
27.3	2280
25.8	2351
27.3	2276
23.5	2548
24.5	2311
18	2201
21.3	2725
21.8	2408
20.5	2139
22.3	1898
18.7	2537
22.3	2068
17.7	2063
19.7	2520
20.5	2434
18.5	2190
10	2794
14.2	2070
15.5	2615
16.5	2265
20.5	2139
15.7	2428
11.7	2137
7.5	1823
3.5	2063
4.5	1806
2.2	1758
5	2243
2.3	1993
6.1	1932
3.3	2465


Summary of computational transaction
Raw Inputview raw input (R code)
Raw Outputview raw output of R engine
Computing time3 seconds
R Server'Gwilym Jenkins' @ 72.249.127.135

\begin{tabular}{lllllllll}
\hline
Summary of computational transaction \tabularnewline
Raw Input & view raw input (R code)  \tabularnewline
Raw Output & view raw output of R engine  \tabularnewline
Computing time & 3 seconds \tabularnewline
R Server & 'Gwilym Jenkins' @ 72.249.127.135 \tabularnewline
\hline
\end{tabular}
%Source: https://freestatistics.org/blog/index.php?pk=58200&T=0

[TABLE]
[ROW][C]Summary of computational transaction[/C][/ROW]
[ROW][C]Raw Input[/C][C]view raw input (R code) [/C][/ROW]
[ROW][C]Raw Output[/C][C]view raw output of R engine [/C][/ROW]
[ROW][C]Computing time[/C][C]3 seconds[/C][/ROW]
[ROW][C]R Server[/C][C]'Gwilym Jenkins' @ 72.249.127.135[/C][/ROW]
[/TABLE]
Source: https://freestatistics.org/blog/index.php?pk=58200&T=0

Globally Unique Identifier (entire table): ba.freestatistics.org/blog/index.php?pk=58200&T=0

As an alternative you can also use a QR Code:  

The GUIDs for individual cells are displayed in the table below:

Summary of computational transaction
Raw Inputview raw input (R code)
Raw Outputview raw output of R engine
Computing time3 seconds
R Server'Gwilym Jenkins' @ 72.249.127.135


Multiple Linear Regression - Estimated Regression Equation
Y[t] = -11.7933478162042 + 0.0118874959627300X[t] -2.72840580123097M1[t] + 5.26960218428549M2[t] + 5.34326942832257M3[t] + 5.45041954136613M4[t] + 2.71934529229835M5[t] + 6.7542162589432M6[t] + 2.47083702763941M7[t] + 1.26704031006233M8[t] + 2.70974721819855M9[t] -0.158659463850549M10[t] -0.449909867577547M11[t] + e[t]

\begin{tabular}{lllllllll}
\hline
Multiple Linear Regression - Estimated Regression Equation \tabularnewline
Y[t] =  -11.7933478162042 +  0.0118874959627300X[t] -2.72840580123097M1[t] +  5.26960218428549M2[t] +  5.34326942832257M3[t] +  5.45041954136613M4[t] +  2.71934529229835M5[t] +  6.7542162589432M6[t] +  2.47083702763941M7[t] +  1.26704031006233M8[t] +  2.70974721819855M9[t] -0.158659463850549M10[t] -0.449909867577547M11[t]  + e[t] \tabularnewline
\hline
\end{tabular}
%Source: https://freestatistics.org/blog/index.php?pk=58200&T=1

[TABLE]
[ROW][C]Multiple Linear Regression - Estimated Regression Equation[/C][/ROW]
[ROW][C]Y[t] =  -11.7933478162042 +  0.0118874959627300X[t] -2.72840580123097M1[t] +  5.26960218428549M2[t] +  5.34326942832257M3[t] +  5.45041954136613M4[t] +  2.71934529229835M5[t] +  6.7542162589432M6[t] +  2.47083702763941M7[t] +  1.26704031006233M8[t] +  2.70974721819855M9[t] -0.158659463850549M10[t] -0.449909867577547M11[t]  + e[t][/C][/ROW]
[/TABLE]
Source: https://freestatistics.org/blog/index.php?pk=58200&T=1

Globally Unique Identifier (entire table): ba.freestatistics.org/blog/index.php?pk=58200&T=1

As an alternative you can also use a QR Code:  

The GUIDs for individual cells are displayed in the table below:

Multiple Linear Regression - Estimated Regression Equation
Y[t] = -11.7933478162042 + 0.0118874959627300X[t] -2.72840580123097M1[t] + 5.26960218428549M2[t] + 5.34326942832257M3[t] + 5.45041954136613M4[t] + 2.71934529229835M5[t] + 6.7542162589432M6[t] + 2.47083702763941M7[t] + 1.26704031006233M8[t] + 2.70974721819855M9[t] -0.158659463850549M10[t] -0.449909867577547M11[t] + e[t]


Multiple Linear Regression - Ordinary Least Squares
VariableParameterS.D.T-STATH0: parameter = 02-tail p-value1-tail p-value
(Intercept)-11.79334781620427.137969-1.65220.1050220.052511
X0.01188749596273000.0027384.34097.3e-053.6e-05
M1-2.728405801230973.88133-0.7030.4854780.242739
M25.269602184285493.9566461.33180.1892040.094602
M35.343269428322573.969831.3460.1846350.092318
M45.450419541366133.9630751.37530.1754230.087712
M52.719345292298353.9558180.68740.4951210.24756
M66.75421625894324.0395341.6720.1010260.050513
M72.470837027639413.9638170.62330.5360070.268003
M81.267040310062333.956440.32020.7501710.375085
M92.709747218198553.9554670.68510.4965990.248299
M10-0.1586594638505493.967549-0.040.9682680.484134
M11-0.4499098675775473.951867-0.11380.9098340.454917

\begin{tabular}{lllllllll}
\hline
Multiple Linear Regression - Ordinary Least Squares \tabularnewline
Variable & Parameter & S.D. & T-STATH0: parameter = 0 & 2-tail p-value & 1-tail p-value \tabularnewline
(Intercept) & -11.7933478162042 & 7.137969 & -1.6522 & 0.105022 & 0.052511 \tabularnewline
X & 0.0118874959627300 & 0.002738 & 4.3409 & 7.3e-05 & 3.6e-05 \tabularnewline
M1 & -2.72840580123097 & 3.88133 & -0.703 & 0.485478 & 0.242739 \tabularnewline
M2 & 5.26960218428549 & 3.956646 & 1.3318 & 0.189204 & 0.094602 \tabularnewline
M3 & 5.34326942832257 & 3.96983 & 1.346 & 0.184635 & 0.092318 \tabularnewline
M4 & 5.45041954136613 & 3.963075 & 1.3753 & 0.175423 & 0.087712 \tabularnewline
M5 & 2.71934529229835 & 3.955818 & 0.6874 & 0.495121 & 0.24756 \tabularnewline
M6 & 6.7542162589432 & 4.039534 & 1.672 & 0.101026 & 0.050513 \tabularnewline
M7 & 2.47083702763941 & 3.963817 & 0.6233 & 0.536007 & 0.268003 \tabularnewline
M8 & 1.26704031006233 & 3.95644 & 0.3202 & 0.750171 & 0.375085 \tabularnewline
M9 & 2.70974721819855 & 3.955467 & 0.6851 & 0.496599 & 0.248299 \tabularnewline
M10 & -0.158659463850549 & 3.967549 & -0.04 & 0.968268 & 0.484134 \tabularnewline
M11 & -0.449909867577547 & 3.951867 & -0.1138 & 0.909834 & 0.454917 \tabularnewline
\hline
\end{tabular}
%Source: https://freestatistics.org/blog/index.php?pk=58200&T=2

[TABLE]
[ROW][C]Multiple Linear Regression - Ordinary Least Squares[/C][/ROW]
[ROW][C]Variable[/C][C]Parameter[/C][C]S.D.[/C][C]T-STATH0: parameter = 0[/C][C]2-tail p-value[/C][C]1-tail p-value[/C][/ROW]
[ROW][C](Intercept)[/C][C]-11.7933478162042[/C][C]7.137969[/C][C]-1.6522[/C][C]0.105022[/C][C]0.052511[/C][/ROW]
[ROW][C]X[/C][C]0.0118874959627300[/C][C]0.002738[/C][C]4.3409[/C][C]7.3e-05[/C][C]3.6e-05[/C][/ROW]
[ROW][C]M1[/C][C]-2.72840580123097[/C][C]3.88133[/C][C]-0.703[/C][C]0.485478[/C][C]0.242739[/C][/ROW]
[ROW][C]M2[/C][C]5.26960218428549[/C][C]3.956646[/C][C]1.3318[/C][C]0.189204[/C][C]0.094602[/C][/ROW]
[ROW][C]M3[/C][C]5.34326942832257[/C][C]3.96983[/C][C]1.346[/C][C]0.184635[/C][C]0.092318[/C][/ROW]
[ROW][C]M4[/C][C]5.45041954136613[/C][C]3.963075[/C][C]1.3753[/C][C]0.175423[/C][C]0.087712[/C][/ROW]
[ROW][C]M5[/C][C]2.71934529229835[/C][C]3.955818[/C][C]0.6874[/C][C]0.495121[/C][C]0.24756[/C][/ROW]
[ROW][C]M6[/C][C]6.7542162589432[/C][C]4.039534[/C][C]1.672[/C][C]0.101026[/C][C]0.050513[/C][/ROW]
[ROW][C]M7[/C][C]2.47083702763941[/C][C]3.963817[/C][C]0.6233[/C][C]0.536007[/C][C]0.268003[/C][/ROW]
[ROW][C]M8[/C][C]1.26704031006233[/C][C]3.95644[/C][C]0.3202[/C][C]0.750171[/C][C]0.375085[/C][/ROW]
[ROW][C]M9[/C][C]2.70974721819855[/C][C]3.955467[/C][C]0.6851[/C][C]0.496599[/C][C]0.248299[/C][/ROW]
[ROW][C]M10[/C][C]-0.158659463850549[/C][C]3.967549[/C][C]-0.04[/C][C]0.968268[/C][C]0.484134[/C][/ROW]
[ROW][C]M11[/C][C]-0.449909867577547[/C][C]3.951867[/C][C]-0.1138[/C][C]0.909834[/C][C]0.454917[/C][/ROW]
[/TABLE]
Source: https://freestatistics.org/blog/index.php?pk=58200&T=2

Globally Unique Identifier (entire table): ba.freestatistics.org/blog/index.php?pk=58200&T=2

As an alternative you can also use a QR Code:  

The GUIDs for individual cells are displayed in the table below:

Multiple Linear Regression - Ordinary Least Squares
VariableParameterS.D.T-STATH0: parameter = 02-tail p-value1-tail p-value
(Intercept)-11.79334781620427.137969-1.65220.1050220.052511
X0.01188749596273000.0027384.34097.3e-053.6e-05
M1-2.728405801230973.88133-0.7030.4854780.242739
M25.269602184285493.9566461.33180.1892040.094602
M35.343269428322573.969831.3460.1846350.092318
M45.450419541366133.9630751.37530.1754230.087712
M52.719345292298353.9558180.68740.4951210.24756
M66.75421625894324.0395341.6720.1010260.050513
M72.470837027639413.9638170.62330.5360070.268003
M81.267040310062333.956440.32020.7501710.375085
M92.709747218198553.9554670.68510.4965990.248299
M10-0.1586594638505493.967549-0.040.9682680.484134
M11-0.4499098675775473.951867-0.11380.9098340.454917


Multiple Linear Regression - Regression Statistics
Multiple R0.562727797596643
R-squared0.316662574187969
Adjusted R-squared0.145828217734961
F-TEST (value)1.85362347927406
F-TEST (DF numerator)12
F-TEST (DF denominator)48
p-value0.0656190615320313
Multiple Linear Regression - Residual Statistics
Residual Standard Deviation6.24683593753813
Sum Squared Residuals1873.10204306486

\begin{tabular}{lllllllll}
\hline
Multiple Linear Regression - Regression Statistics \tabularnewline
Multiple R & 0.562727797596643 \tabularnewline
R-squared & 0.316662574187969 \tabularnewline
Adjusted R-squared & 0.145828217734961 \tabularnewline
F-TEST (value) & 1.85362347927406 \tabularnewline
F-TEST (DF numerator) & 12 \tabularnewline
F-TEST (DF denominator) & 48 \tabularnewline
p-value & 0.0656190615320313 \tabularnewline
Multiple Linear Regression - Residual Statistics \tabularnewline
Residual Standard Deviation & 6.24683593753813 \tabularnewline
Sum Squared Residuals & 1873.10204306486 \tabularnewline
\hline
\end{tabular}
%Source: https://freestatistics.org/blog/index.php?pk=58200&T=3

[TABLE]
[ROW][C]Multiple Linear Regression - Regression Statistics[/C][/ROW]
[ROW][C]Multiple R[/C][C]0.562727797596643[/C][/ROW]
[ROW][C]R-squared[/C][C]0.316662574187969[/C][/ROW]
[ROW][C]Adjusted R-squared[/C][C]0.145828217734961[/C][/ROW]
[ROW][C]F-TEST (value)[/C][C]1.85362347927406[/C][/ROW]
[ROW][C]F-TEST (DF numerator)[/C][C]12[/C][/ROW]
[ROW][C]F-TEST (DF denominator)[/C][C]48[/C][/ROW]
[ROW][C]p-value[/C][C]0.0656190615320313[/C][/ROW]
[ROW][C]Multiple Linear Regression - Residual Statistics[/C][/ROW]
[ROW][C]Residual Standard Deviation[/C][C]6.24683593753813[/C][/ROW]
[ROW][C]Sum Squared Residuals[/C][C]1873.10204306486[/C][/ROW]
[/TABLE]
Source: https://freestatistics.org/blog/index.php?pk=58200&T=3

Globally Unique Identifier (entire table): ba.freestatistics.org/blog/index.php?pk=58200&T=3

As an alternative you can also use a QR Code:  

The GUIDs for individual cells are displayed in the table below:

Multiple Linear Regression - Regression Statistics
Multiple R0.562727797596643
R-squared0.316662574187969
Adjusted R-squared0.145828217734961
F-TEST (value)1.85362347927406
F-TEST (DF numerator)12
F-TEST (DF denominator)48
p-value0.0656190615320313
Multiple Linear Regression - Residual Statistics
Residual Standard Deviation6.24683593753813
Sum Squared Residuals1873.10204306486


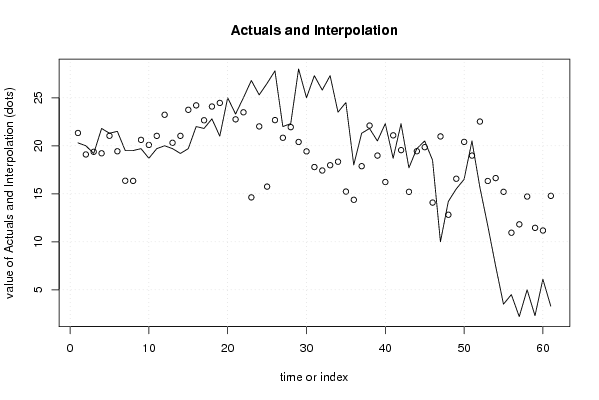
Multiple Linear Regression - Actuals, Interpolation, and Residuals
Time or IndexActualsInterpolationForecastResidualsPrediction Error
120.321.3309342061586-1.03093420615859
22019.09380816776450.90619183223555
319.219.3695628431679-0.169562843167947
421.819.21518804503142.58481195496855
521.321.03702474968930.262975250310743
621.519.42533513403742.07466486596263
719.516.35448049093203.14551950906797
819.516.33943336962803.16056663037205
919.720.6113643168939-0.911364316893922
1018.720.0847943395026-1.38479433950263
1119.721.0298435158996-1.32984351589956
122023.2272152899984-3.22721528999842
1319.720.3086095533638-0.608609553363768
1419.221.0314700096894-1.83147000968945
1519.723.7441613574526-4.0441613574526
162224.2079363493781-2.20793634937806
1721.822.6537242006205-0.853724200620545
1822.824.0852335514275-1.28523355142753
192124.4617527375139-3.46175273751391
202530.3666786056494-5.36667860564939
2123.322.75111359018530.548886409814676
222523.48461818484341.51538181515658
2326.814.622483191988112.1775168080119
2425.322.01469070180003.28530929820005
2526.515.743811103675410.7561888963246
2627.822.67194445254625.12805554745381
272220.83172484658371.16827515341626
2822.321.93742462049660.362575379503377
292820.39509996770187.60490003229815
302519.41344763807465.58655236192537
3127.317.78098000645969.51901999354037
3225.817.42119550223648.37880449776362
3327.317.97234021316799.32765978683215
3423.518.33733243298135.16266756701868
3524.515.22874548608739.2712545139127
361814.37103079776453.62896920223545
3721.317.87167288100413.42832711899589
3821.822.1013446463351-0.301344646335149
3920.518.97727547639791.52272452360214
4022.316.21953906242356.08046093757652
4118.721.0845747335402-2.38457473354018
4222.319.54421009366472.75578990633534
4317.715.20139338254722.49860661745278
4419.719.43018231993780.269817680062238
4520.519.85056457527920.649435424720801
4618.514.08160887832404.41839112167603
471020.9704060360859-10.9704060360859
4814.212.81376882664691.38623117335308
4915.516.5640483251038-1.06404832510381
5016.520.4014327236648-3.90143272366476
5120.518.97727547639791.52272452360214
5215.722.5199119226704-6.8199119226704
5311.716.3295763484482-4.62957634844817
547.516.6317735827958-9.1317735827958
553.515.2013933825472-11.7013933825472
564.510.9425102025485-6.44251020254852
572.211.8146173044737-9.6146173044737
58514.7116461643487-9.71164616434866
592.311.4485217699392-9.14852176993915
606.111.1732943837902-5.07329438379017
613.314.7809239306943-11.4809239306943

\begin{tabular}{lllllllll}
\hline
Multiple Linear Regression - Actuals, Interpolation, and Residuals \tabularnewline
Time or Index & Actuals & InterpolationForecast & ResidualsPrediction Error \tabularnewline
1 & 20.3 & 21.3309342061586 & -1.03093420615859 \tabularnewline
2 & 20 & 19.0938081677645 & 0.90619183223555 \tabularnewline
3 & 19.2 & 19.3695628431679 & -0.169562843167947 \tabularnewline
4 & 21.8 & 19.2151880450314 & 2.58481195496855 \tabularnewline
5 & 21.3 & 21.0370247496893 & 0.262975250310743 \tabularnewline
6 & 21.5 & 19.4253351340374 & 2.07466486596263 \tabularnewline
7 & 19.5 & 16.3544804909320 & 3.14551950906797 \tabularnewline
8 & 19.5 & 16.3394333696280 & 3.16056663037205 \tabularnewline
9 & 19.7 & 20.6113643168939 & -0.911364316893922 \tabularnewline
10 & 18.7 & 20.0847943395026 & -1.38479433950263 \tabularnewline
11 & 19.7 & 21.0298435158996 & -1.32984351589956 \tabularnewline
12 & 20 & 23.2272152899984 & -3.22721528999842 \tabularnewline
13 & 19.7 & 20.3086095533638 & -0.608609553363768 \tabularnewline
14 & 19.2 & 21.0314700096894 & -1.83147000968945 \tabularnewline
15 & 19.7 & 23.7441613574526 & -4.0441613574526 \tabularnewline
16 & 22 & 24.2079363493781 & -2.20793634937806 \tabularnewline
17 & 21.8 & 22.6537242006205 & -0.853724200620545 \tabularnewline
18 & 22.8 & 24.0852335514275 & -1.28523355142753 \tabularnewline
19 & 21 & 24.4617527375139 & -3.46175273751391 \tabularnewline
20 & 25 & 30.3666786056494 & -5.36667860564939 \tabularnewline
21 & 23.3 & 22.7511135901853 & 0.548886409814676 \tabularnewline
22 & 25 & 23.4846181848434 & 1.51538181515658 \tabularnewline
23 & 26.8 & 14.6224831919881 & 12.1775168080119 \tabularnewline
24 & 25.3 & 22.0146907018000 & 3.28530929820005 \tabularnewline
25 & 26.5 & 15.7438111036754 & 10.7561888963246 \tabularnewline
26 & 27.8 & 22.6719444525462 & 5.12805554745381 \tabularnewline
27 & 22 & 20.8317248465837 & 1.16827515341626 \tabularnewline
28 & 22.3 & 21.9374246204966 & 0.362575379503377 \tabularnewline
29 & 28 & 20.3950999677018 & 7.60490003229815 \tabularnewline
30 & 25 & 19.4134476380746 & 5.58655236192537 \tabularnewline
31 & 27.3 & 17.7809800064596 & 9.51901999354037 \tabularnewline
32 & 25.8 & 17.4211955022364 & 8.37880449776362 \tabularnewline
33 & 27.3 & 17.9723402131679 & 9.32765978683215 \tabularnewline
34 & 23.5 & 18.3373324329813 & 5.16266756701868 \tabularnewline
35 & 24.5 & 15.2287454860873 & 9.2712545139127 \tabularnewline
36 & 18 & 14.3710307977645 & 3.62896920223545 \tabularnewline
37 & 21.3 & 17.8716728810041 & 3.42832711899589 \tabularnewline
38 & 21.8 & 22.1013446463351 & -0.301344646335149 \tabularnewline
39 & 20.5 & 18.9772754763979 & 1.52272452360214 \tabularnewline
40 & 22.3 & 16.2195390624235 & 6.08046093757652 \tabularnewline
41 & 18.7 & 21.0845747335402 & -2.38457473354018 \tabularnewline
42 & 22.3 & 19.5442100936647 & 2.75578990633534 \tabularnewline
43 & 17.7 & 15.2013933825472 & 2.49860661745278 \tabularnewline
44 & 19.7 & 19.4301823199378 & 0.269817680062238 \tabularnewline
45 & 20.5 & 19.8505645752792 & 0.649435424720801 \tabularnewline
46 & 18.5 & 14.0816088783240 & 4.41839112167603 \tabularnewline
47 & 10 & 20.9704060360859 & -10.9704060360859 \tabularnewline
48 & 14.2 & 12.8137688266469 & 1.38623117335308 \tabularnewline
49 & 15.5 & 16.5640483251038 & -1.06404832510381 \tabularnewline
50 & 16.5 & 20.4014327236648 & -3.90143272366476 \tabularnewline
51 & 20.5 & 18.9772754763979 & 1.52272452360214 \tabularnewline
52 & 15.7 & 22.5199119226704 & -6.8199119226704 \tabularnewline
53 & 11.7 & 16.3295763484482 & -4.62957634844817 \tabularnewline
54 & 7.5 & 16.6317735827958 & -9.1317735827958 \tabularnewline
55 & 3.5 & 15.2013933825472 & -11.7013933825472 \tabularnewline
56 & 4.5 & 10.9425102025485 & -6.44251020254852 \tabularnewline
57 & 2.2 & 11.8146173044737 & -9.6146173044737 \tabularnewline
58 & 5 & 14.7116461643487 & -9.71164616434866 \tabularnewline
59 & 2.3 & 11.4485217699392 & -9.14852176993915 \tabularnewline
60 & 6.1 & 11.1732943837902 & -5.07329438379017 \tabularnewline
61 & 3.3 & 14.7809239306943 & -11.4809239306943 \tabularnewline
\hline
\end{tabular}
%Source: https://freestatistics.org/blog/index.php?pk=58200&T=4

[TABLE]
[ROW][C]Multiple Linear Regression - Actuals, Interpolation, and Residuals[/C][/ROW]
[ROW][C]Time or Index[/C][C]Actuals[/C][C]InterpolationForecast[/C][C]ResidualsPrediction Error[/C][/ROW]
[ROW][C]1[/C][C]20.3[/C][C]21.3309342061586[/C][C]-1.03093420615859[/C][/ROW]
[ROW][C]2[/C][C]20[/C][C]19.0938081677645[/C][C]0.90619183223555[/C][/ROW]
[ROW][C]3[/C][C]19.2[/C][C]19.3695628431679[/C][C]-0.169562843167947[/C][/ROW]
[ROW][C]4[/C][C]21.8[/C][C]19.2151880450314[/C][C]2.58481195496855[/C][/ROW]
[ROW][C]5[/C][C]21.3[/C][C]21.0370247496893[/C][C]0.262975250310743[/C][/ROW]
[ROW][C]6[/C][C]21.5[/C][C]19.4253351340374[/C][C]2.07466486596263[/C][/ROW]
[ROW][C]7[/C][C]19.5[/C][C]16.3544804909320[/C][C]3.14551950906797[/C][/ROW]
[ROW][C]8[/C][C]19.5[/C][C]16.3394333696280[/C][C]3.16056663037205[/C][/ROW]
[ROW][C]9[/C][C]19.7[/C][C]20.6113643168939[/C][C]-0.911364316893922[/C][/ROW]
[ROW][C]10[/C][C]18.7[/C][C]20.0847943395026[/C][C]-1.38479433950263[/C][/ROW]
[ROW][C]11[/C][C]19.7[/C][C]21.0298435158996[/C][C]-1.32984351589956[/C][/ROW]
[ROW][C]12[/C][C]20[/C][C]23.2272152899984[/C][C]-3.22721528999842[/C][/ROW]
[ROW][C]13[/C][C]19.7[/C][C]20.3086095533638[/C][C]-0.608609553363768[/C][/ROW]
[ROW][C]14[/C][C]19.2[/C][C]21.0314700096894[/C][C]-1.83147000968945[/C][/ROW]
[ROW][C]15[/C][C]19.7[/C][C]23.7441613574526[/C][C]-4.0441613574526[/C][/ROW]
[ROW][C]16[/C][C]22[/C][C]24.2079363493781[/C][C]-2.20793634937806[/C][/ROW]
[ROW][C]17[/C][C]21.8[/C][C]22.6537242006205[/C][C]-0.853724200620545[/C][/ROW]
[ROW][C]18[/C][C]22.8[/C][C]24.0852335514275[/C][C]-1.28523355142753[/C][/ROW]
[ROW][C]19[/C][C]21[/C][C]24.4617527375139[/C][C]-3.46175273751391[/C][/ROW]
[ROW][C]20[/C][C]25[/C][C]30.3666786056494[/C][C]-5.36667860564939[/C][/ROW]
[ROW][C]21[/C][C]23.3[/C][C]22.7511135901853[/C][C]0.548886409814676[/C][/ROW]
[ROW][C]22[/C][C]25[/C][C]23.4846181848434[/C][C]1.51538181515658[/C][/ROW]
[ROW][C]23[/C][C]26.8[/C][C]14.6224831919881[/C][C]12.1775168080119[/C][/ROW]
[ROW][C]24[/C][C]25.3[/C][C]22.0146907018000[/C][C]3.28530929820005[/C][/ROW]
[ROW][C]25[/C][C]26.5[/C][C]15.7438111036754[/C][C]10.7561888963246[/C][/ROW]
[ROW][C]26[/C][C]27.8[/C][C]22.6719444525462[/C][C]5.12805554745381[/C][/ROW]
[ROW][C]27[/C][C]22[/C][C]20.8317248465837[/C][C]1.16827515341626[/C][/ROW]
[ROW][C]28[/C][C]22.3[/C][C]21.9374246204966[/C][C]0.362575379503377[/C][/ROW]
[ROW][C]29[/C][C]28[/C][C]20.3950999677018[/C][C]7.60490003229815[/C][/ROW]
[ROW][C]30[/C][C]25[/C][C]19.4134476380746[/C][C]5.58655236192537[/C][/ROW]
[ROW][C]31[/C][C]27.3[/C][C]17.7809800064596[/C][C]9.51901999354037[/C][/ROW]
[ROW][C]32[/C][C]25.8[/C][C]17.4211955022364[/C][C]8.37880449776362[/C][/ROW]
[ROW][C]33[/C][C]27.3[/C][C]17.9723402131679[/C][C]9.32765978683215[/C][/ROW]
[ROW][C]34[/C][C]23.5[/C][C]18.3373324329813[/C][C]5.16266756701868[/C][/ROW]
[ROW][C]35[/C][C]24.5[/C][C]15.2287454860873[/C][C]9.2712545139127[/C][/ROW]
[ROW][C]36[/C][C]18[/C][C]14.3710307977645[/C][C]3.62896920223545[/C][/ROW]
[ROW][C]37[/C][C]21.3[/C][C]17.8716728810041[/C][C]3.42832711899589[/C][/ROW]
[ROW][C]38[/C][C]21.8[/C][C]22.1013446463351[/C][C]-0.301344646335149[/C][/ROW]
[ROW][C]39[/C][C]20.5[/C][C]18.9772754763979[/C][C]1.52272452360214[/C][/ROW]
[ROW][C]40[/C][C]22.3[/C][C]16.2195390624235[/C][C]6.08046093757652[/C][/ROW]
[ROW][C]41[/C][C]18.7[/C][C]21.0845747335402[/C][C]-2.38457473354018[/C][/ROW]
[ROW][C]42[/C][C]22.3[/C][C]19.5442100936647[/C][C]2.75578990633534[/C][/ROW]
[ROW][C]43[/C][C]17.7[/C][C]15.2013933825472[/C][C]2.49860661745278[/C][/ROW]
[ROW][C]44[/C][C]19.7[/C][C]19.4301823199378[/C][C]0.269817680062238[/C][/ROW]
[ROW][C]45[/C][C]20.5[/C][C]19.8505645752792[/C][C]0.649435424720801[/C][/ROW]
[ROW][C]46[/C][C]18.5[/C][C]14.0816088783240[/C][C]4.41839112167603[/C][/ROW]
[ROW][C]47[/C][C]10[/C][C]20.9704060360859[/C][C]-10.9704060360859[/C][/ROW]
[ROW][C]48[/C][C]14.2[/C][C]12.8137688266469[/C][C]1.38623117335308[/C][/ROW]
[ROW][C]49[/C][C]15.5[/C][C]16.5640483251038[/C][C]-1.06404832510381[/C][/ROW]
[ROW][C]50[/C][C]16.5[/C][C]20.4014327236648[/C][C]-3.90143272366476[/C][/ROW]
[ROW][C]51[/C][C]20.5[/C][C]18.9772754763979[/C][C]1.52272452360214[/C][/ROW]
[ROW][C]52[/C][C]15.7[/C][C]22.5199119226704[/C][C]-6.8199119226704[/C][/ROW]
[ROW][C]53[/C][C]11.7[/C][C]16.3295763484482[/C][C]-4.62957634844817[/C][/ROW]
[ROW][C]54[/C][C]7.5[/C][C]16.6317735827958[/C][C]-9.1317735827958[/C][/ROW]
[ROW][C]55[/C][C]3.5[/C][C]15.2013933825472[/C][C]-11.7013933825472[/C][/ROW]
[ROW][C]56[/C][C]4.5[/C][C]10.9425102025485[/C][C]-6.44251020254852[/C][/ROW]
[ROW][C]57[/C][C]2.2[/C][C]11.8146173044737[/C][C]-9.6146173044737[/C][/ROW]
[ROW][C]58[/C][C]5[/C][C]14.7116461643487[/C][C]-9.71164616434866[/C][/ROW]
[ROW][C]59[/C][C]2.3[/C][C]11.4485217699392[/C][C]-9.14852176993915[/C][/ROW]
[ROW][C]60[/C][C]6.1[/C][C]11.1732943837902[/C][C]-5.07329438379017[/C][/ROW]
[ROW][C]61[/C][C]3.3[/C][C]14.7809239306943[/C][C]-11.4809239306943[/C][/ROW]
[/TABLE]
Source: https://freestatistics.org/blog/index.php?pk=58200&T=4

Globally Unique Identifier (entire table): ba.freestatistics.org/blog/index.php?pk=58200&T=4

As an alternative you can also use a QR Code:  

The GUIDs for individual cells are displayed in the table below:

Multiple Linear Regression - Actuals, Interpolation, and Residuals
Time or IndexActualsInterpolationForecastResidualsPrediction Error
120.321.3309342061586-1.03093420615859
22019.09380816776450.90619183223555
319.219.3695628431679-0.169562843167947
421.819.21518804503142.58481195496855
521.321.03702474968930.262975250310743
621.519.42533513403742.07466486596263
719.516.35448049093203.14551950906797
819.516.33943336962803.16056663037205
919.720.6113643168939-0.911364316893922
1018.720.0847943395026-1.38479433950263
1119.721.0298435158996-1.32984351589956
122023.2272152899984-3.22721528999842
1319.720.3086095533638-0.608609553363768
1419.221.0314700096894-1.83147000968945
1519.723.7441613574526-4.0441613574526
162224.2079363493781-2.20793634937806
1721.822.6537242006205-0.853724200620545
1822.824.0852335514275-1.28523355142753
192124.4617527375139-3.46175273751391
202530.3666786056494-5.36667860564939
2123.322.75111359018530.548886409814676
222523.48461818484341.51538181515658
2326.814.622483191988112.1775168080119
2425.322.01469070180003.28530929820005
2526.515.743811103675410.7561888963246
2627.822.67194445254625.12805554745381
272220.83172484658371.16827515341626
2822.321.93742462049660.362575379503377
292820.39509996770187.60490003229815
302519.41344763807465.58655236192537
3127.317.78098000645969.51901999354037
3225.817.42119550223648.37880449776362
3327.317.97234021316799.32765978683215
3423.518.33733243298135.16266756701868
3524.515.22874548608739.2712545139127
361814.37103079776453.62896920223545
3721.317.87167288100413.42832711899589
3821.822.1013446463351-0.301344646335149
3920.518.97727547639791.52272452360214
4022.316.21953906242356.08046093757652
4118.721.0845747335402-2.38457473354018
4222.319.54421009366472.75578990633534
4317.715.20139338254722.49860661745278
4419.719.43018231993780.269817680062238
4520.519.85056457527920.649435424720801
4618.514.08160887832404.41839112167603
471020.9704060360859-10.9704060360859
4814.212.81376882664691.38623117335308
4915.516.5640483251038-1.06404832510381
5016.520.4014327236648-3.90143272366476
5120.518.97727547639791.52272452360214
5215.722.5199119226704-6.8199119226704
5311.716.3295763484482-4.62957634844817
547.516.6317735827958-9.1317735827958
553.515.2013933825472-11.7013933825472
564.510.9425102025485-6.44251020254852
572.211.8146173044737-9.6146173044737
58514.7116461643487-9.71164616434866
592.311.4485217699392-9.14852176993915
606.111.1732943837902-5.07329438379017
613.314.7809239306943-11.4809239306943


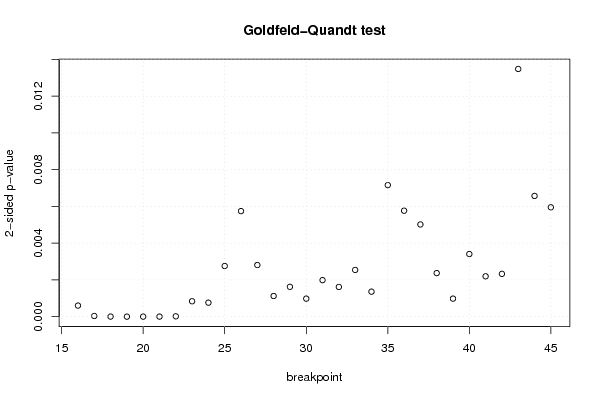
Goldfeld-Quandt test for Heteroskedasticity
p-valuesAlternative Hypothesis
breakpoint indexgreater2-sidedless
160.0003015528090645240.0006031056181290480.999698447190935
171.88149035008250e-053.76298070016499e-050.999981185096499
182.52142447205668e-065.04284894411336e-060.999997478575528
191.58881285602661e-073.17762571205321e-070.999999841118714
204.85145410800488e-079.70290821600976e-070.99999951485459
211.01889402747616e-062.03778805495233e-060.999998981105973
229.23095697472539e-061.84619139494508e-050.999990769043025
230.0004191904145767970.0008383808291535940.999580809585423
240.0003808165019679280.0007616330039358560.999619183498032
250.001378375524184690.002756751048369380.998621624475815
260.002873486734731480.005746973469462960.997126513265268
270.001404790189167470.002809580378334940.998595209810833
280.0005617167945224870.001123433589044970.999438283205478
290.000811964579301090.001623929158602180.999188035420699
300.0004903206718693490.0009806413437386980.99950967932813
310.0009945831291934210.001989166258386840.999005416870807
320.0008082504087775780.001616500817555160.999191749591222
330.001271174752922520.002542349505845040.998728825247077
340.0006802227060573480.001360445412114700.999319777293943
350.003580394749253630.007160789498507270.996419605250746
360.002884119377684090.005768238755368180.997115880622316
370.002509888967471960.005019777934943910.997490111032528
380.001186034503194900.002372069006389800.998813965496805
390.0004906025898625170.0009812051797250340.999509397410137
400.00170513552759550.0034102710551910.998294864472405
410.001098214676292870.002196429352585740.998901785323707
420.001164967698424030.002329935396848050.998835032301576
430.006742712233249740.01348542446649950.99325728776675
440.003286628180444310.006573256360888630.996713371819556
450.002976573202548010.005953146405096020.997023426797452

\begin{tabular}{lllllllll}
\hline
Goldfeld-Quandt test for Heteroskedasticity \tabularnewline
p-values & Alternative Hypothesis \tabularnewline
breakpoint index & greater & 2-sided & less \tabularnewline
16 & 0.000301552809064524 & 0.000603105618129048 & 0.999698447190935 \tabularnewline
17 & 1.88149035008250e-05 & 3.76298070016499e-05 & 0.999981185096499 \tabularnewline
18 & 2.52142447205668e-06 & 5.04284894411336e-06 & 0.999997478575528 \tabularnewline
19 & 1.58881285602661e-07 & 3.17762571205321e-07 & 0.999999841118714 \tabularnewline
20 & 4.85145410800488e-07 & 9.70290821600976e-07 & 0.99999951485459 \tabularnewline
21 & 1.01889402747616e-06 & 2.03778805495233e-06 & 0.999998981105973 \tabularnewline
22 & 9.23095697472539e-06 & 1.84619139494508e-05 & 0.999990769043025 \tabularnewline
23 & 0.000419190414576797 & 0.000838380829153594 & 0.999580809585423 \tabularnewline
24 & 0.000380816501967928 & 0.000761633003935856 & 0.999619183498032 \tabularnewline
25 & 0.00137837552418469 & 0.00275675104836938 & 0.998621624475815 \tabularnewline
26 & 0.00287348673473148 & 0.00574697346946296 & 0.997126513265268 \tabularnewline
27 & 0.00140479018916747 & 0.00280958037833494 & 0.998595209810833 \tabularnewline
28 & 0.000561716794522487 & 0.00112343358904497 & 0.999438283205478 \tabularnewline
29 & 0.00081196457930109 & 0.00162392915860218 & 0.999188035420699 \tabularnewline
30 & 0.000490320671869349 & 0.000980641343738698 & 0.99950967932813 \tabularnewline
31 & 0.000994583129193421 & 0.00198916625838684 & 0.999005416870807 \tabularnewline
32 & 0.000808250408777578 & 0.00161650081755516 & 0.999191749591222 \tabularnewline
33 & 0.00127117475292252 & 0.00254234950584504 & 0.998728825247077 \tabularnewline
34 & 0.000680222706057348 & 0.00136044541211470 & 0.999319777293943 \tabularnewline
35 & 0.00358039474925363 & 0.00716078949850727 & 0.996419605250746 \tabularnewline
36 & 0.00288411937768409 & 0.00576823875536818 & 0.997115880622316 \tabularnewline
37 & 0.00250988896747196 & 0.00501977793494391 & 0.997490111032528 \tabularnewline
38 & 0.00118603450319490 & 0.00237206900638980 & 0.998813965496805 \tabularnewline
39 & 0.000490602589862517 & 0.000981205179725034 & 0.999509397410137 \tabularnewline
40 & 0.0017051355275955 & 0.003410271055191 & 0.998294864472405 \tabularnewline
41 & 0.00109821467629287 & 0.00219642935258574 & 0.998901785323707 \tabularnewline
42 & 0.00116496769842403 & 0.00232993539684805 & 0.998835032301576 \tabularnewline
43 & 0.00674271223324974 & 0.0134854244664995 & 0.99325728776675 \tabularnewline
44 & 0.00328662818044431 & 0.00657325636088863 & 0.996713371819556 \tabularnewline
45 & 0.00297657320254801 & 0.00595314640509602 & 0.997023426797452 \tabularnewline
\hline
\end{tabular}
%Source: https://freestatistics.org/blog/index.php?pk=58200&T=5

[TABLE]
[ROW][C]Goldfeld-Quandt test for Heteroskedasticity[/C][/ROW]
[ROW][C]p-values[/C][C]Alternative Hypothesis[/C][/ROW]
[ROW][C]breakpoint index[/C][C]greater[/C][C]2-sided[/C][C]less[/C][/ROW]
[ROW][C]16[/C][C]0.000301552809064524[/C][C]0.000603105618129048[/C][C]0.999698447190935[/C][/ROW]
[ROW][C]17[/C][C]1.88149035008250e-05[/C][C]3.76298070016499e-05[/C][C]0.999981185096499[/C][/ROW]
[ROW][C]18[/C][C]2.52142447205668e-06[/C][C]5.04284894411336e-06[/C][C]0.999997478575528[/C][/ROW]
[ROW][C]19[/C][C]1.58881285602661e-07[/C][C]3.17762571205321e-07[/C][C]0.999999841118714[/C][/ROW]
[ROW][C]20[/C][C]4.85145410800488e-07[/C][C]9.70290821600976e-07[/C][C]0.99999951485459[/C][/ROW]
[ROW][C]21[/C][C]1.01889402747616e-06[/C][C]2.03778805495233e-06[/C][C]0.999998981105973[/C][/ROW]
[ROW][C]22[/C][C]9.23095697472539e-06[/C][C]1.84619139494508e-05[/C][C]0.999990769043025[/C][/ROW]
[ROW][C]23[/C][C]0.000419190414576797[/C][C]0.000838380829153594[/C][C]0.999580809585423[/C][/ROW]
[ROW][C]24[/C][C]0.000380816501967928[/C][C]0.000761633003935856[/C][C]0.999619183498032[/C][/ROW]
[ROW][C]25[/C][C]0.00137837552418469[/C][C]0.00275675104836938[/C][C]0.998621624475815[/C][/ROW]
[ROW][C]26[/C][C]0.00287348673473148[/C][C]0.00574697346946296[/C][C]0.997126513265268[/C][/ROW]
[ROW][C]27[/C][C]0.00140479018916747[/C][C]0.00280958037833494[/C][C]0.998595209810833[/C][/ROW]
[ROW][C]28[/C][C]0.000561716794522487[/C][C]0.00112343358904497[/C][C]0.999438283205478[/C][/ROW]
[ROW][C]29[/C][C]0.00081196457930109[/C][C]0.00162392915860218[/C][C]0.999188035420699[/C][/ROW]
[ROW][C]30[/C][C]0.000490320671869349[/C][C]0.000980641343738698[/C][C]0.99950967932813[/C][/ROW]
[ROW][C]31[/C][C]0.000994583129193421[/C][C]0.00198916625838684[/C][C]0.999005416870807[/C][/ROW]
[ROW][C]32[/C][C]0.000808250408777578[/C][C]0.00161650081755516[/C][C]0.999191749591222[/C][/ROW]
[ROW][C]33[/C][C]0.00127117475292252[/C][C]0.00254234950584504[/C][C]0.998728825247077[/C][/ROW]
[ROW][C]34[/C][C]0.000680222706057348[/C][C]0.00136044541211470[/C][C]0.999319777293943[/C][/ROW]
[ROW][C]35[/C][C]0.00358039474925363[/C][C]0.00716078949850727[/C][C]0.996419605250746[/C][/ROW]
[ROW][C]36[/C][C]0.00288411937768409[/C][C]0.00576823875536818[/C][C]0.997115880622316[/C][/ROW]
[ROW][C]37[/C][C]0.00250988896747196[/C][C]0.00501977793494391[/C][C]0.997490111032528[/C][/ROW]
[ROW][C]38[/C][C]0.00118603450319490[/C][C]0.00237206900638980[/C][C]0.998813965496805[/C][/ROW]
[ROW][C]39[/C][C]0.000490602589862517[/C][C]0.000981205179725034[/C][C]0.999509397410137[/C][/ROW]
[ROW][C]40[/C][C]0.0017051355275955[/C][C]0.003410271055191[/C][C]0.998294864472405[/C][/ROW]
[ROW][C]41[/C][C]0.00109821467629287[/C][C]0.00219642935258574[/C][C]0.998901785323707[/C][/ROW]
[ROW][C]42[/C][C]0.00116496769842403[/C][C]0.00232993539684805[/C][C]0.998835032301576[/C][/ROW]
[ROW][C]43[/C][C]0.00674271223324974[/C][C]0.0134854244664995[/C][C]0.99325728776675[/C][/ROW]
[ROW][C]44[/C][C]0.00328662818044431[/C][C]0.00657325636088863[/C][C]0.996713371819556[/C][/ROW]
[ROW][C]45[/C][C]0.00297657320254801[/C][C]0.00595314640509602[/C][C]0.997023426797452[/C][/ROW]
[/TABLE]
Source: https://freestatistics.org/blog/index.php?pk=58200&T=5

Globally Unique Identifier (entire table): ba.freestatistics.org/blog/index.php?pk=58200&T=5

As an alternative you can also use a QR Code:  

The GUIDs for individual cells are displayed in the table below:

Goldfeld-Quandt test for Heteroskedasticity
p-valuesAlternative Hypothesis
breakpoint indexgreater2-sidedless
160.0003015528090645240.0006031056181290480.999698447190935
171.88149035008250e-053.76298070016499e-050.999981185096499
182.52142447205668e-065.04284894411336e-060.999997478575528
191.58881285602661e-073.17762571205321e-070.999999841118714
204.85145410800488e-079.70290821600976e-070.99999951485459
211.01889402747616e-062.03778805495233e-060.999998981105973
229.23095697472539e-061.84619139494508e-050.999990769043025
230.0004191904145767970.0008383808291535940.999580809585423
240.0003808165019679280.0007616330039358560.999619183498032
250.001378375524184690.002756751048369380.998621624475815
260.002873486734731480.005746973469462960.997126513265268
270.001404790189167470.002809580378334940.998595209810833
280.0005617167945224870.001123433589044970.999438283205478
290.000811964579301090.001623929158602180.999188035420699
300.0004903206718693490.0009806413437386980.99950967932813
310.0009945831291934210.001989166258386840.999005416870807
320.0008082504087775780.001616500817555160.999191749591222
330.001271174752922520.002542349505845040.998728825247077
340.0006802227060573480.001360445412114700.999319777293943
350.003580394749253630.007160789498507270.996419605250746
360.002884119377684090.005768238755368180.997115880622316
370.002509888967471960.005019777934943910.997490111032528
380.001186034503194900.002372069006389800.998813965496805
390.0004906025898625170.0009812051797250340.999509397410137
400.00170513552759550.0034102710551910.998294864472405
410.001098214676292870.002196429352585740.998901785323707
420.001164967698424030.002329935396848050.998835032301576
430.006742712233249740.01348542446649950.99325728776675
440.003286628180444310.006573256360888630.996713371819556
450.002976573202548010.005953146405096020.997023426797452


Meta Analysis of Goldfeld-Quandt test for Heteroskedasticity
Description# significant tests% significant testsOK/NOK
1% type I error level290.966666666666667NOK
5% type I error level301NOK
10% type I error level301NOK

\begin{tabular}{lllllllll}
\hline
Meta Analysis of Goldfeld-Quandt test for Heteroskedasticity \tabularnewline
Description & # significant tests & % significant tests & OK/NOK \tabularnewline
1% type I error level & 29 & 0.966666666666667 & NOK \tabularnewline
5% type I error level & 30 & 1 & NOK \tabularnewline
10% type I error level & 30 & 1 & NOK \tabularnewline
\hline
\end{tabular}
%Source: https://freestatistics.org/blog/index.php?pk=58200&T=6

[TABLE]
[ROW][C]Meta Analysis of Goldfeld-Quandt test for Heteroskedasticity[/C][/ROW]
[ROW][C]Description[/C][C]# significant tests[/C][C]% significant tests[/C][C]OK/NOK[/C][/ROW]
[ROW][C]1% type I error level[/C][C]29[/C][C]0.966666666666667[/C][C]NOK[/C][/ROW]
[ROW][C]5% type I error level[/C][C]30[/C][C]1[/C][C]NOK[/C][/ROW]
[ROW][C]10% type I error level[/C][C]30[/C][C]1[/C][C]NOK[/C][/ROW]
[/TABLE]
Source: https://freestatistics.org/blog/index.php?pk=58200&T=6

Globally Unique Identifier (entire table): ba.freestatistics.org/blog/index.php?pk=58200&T=6

As an alternative you can also use a QR Code:  

The GUIDs for individual cells are displayed in the table below:

Meta Analysis of Goldfeld-Quandt test for Heteroskedasticity
Description# significant tests% significant testsOK/NOK
1% type I error level290.966666666666667NOK
5% type I error level301NOK
10% type I error level301NOK


Parameters (Session):
par1 = 1 ; par2 = Include Monthly Dummies ; par3 = No Linear Trend ;
Parameters (R input):
par1 = 1 ; par2 = Include Monthly Dummies ; par3 = No Linear Trend ;
R code (references can be found in the software module):
library(lattice)
library(lmtest)
n25 <- 25 #minimum number of obs. for Goldfeld-Quandt test
par1 <- as.numeric(par1)
x <- t(y)
k <- length(x[1,])
n <- length(x[,1])
x1 <- cbind(x[,par1], x[,1:k!=par1])
mycolnames <- c(colnames(x)[par1], colnames(x)[1:k!=par1])
colnames(x1) <- mycolnames #colnames(x)[par1]
x <- x1
if (par3 == 'First Differences'){
x2 <- array(0, dim=c(n-1,k), dimnames=list(1:(n-1), paste('(1-B)',colnames(x),sep='')))
for (i in 1:n-1) {
for (j in 1:k) {
x2[i,j] <- x[i+1,j] - x[i,j]
}
}
x <- x2
}
if (par2 == 'Include Monthly Dummies'){
x2 <- array(0, dim=c(n,11), dimnames=list(1:n, paste('M', seq(1:11), sep ='')))
for (i in 1:11){
x2[seq(i,n,12),i] <- 1
}
x <- cbind(x, x2)
}
if (par2 == 'Include Quarterly Dummies'){
x2 <- array(0, dim=c(n,3), dimnames=list(1:n, paste('Q', seq(1:3), sep ='')))
for (i in 1:3){
x2[seq(i,n,4),i] <- 1
}
x <- cbind(x, x2)
}
k <- length(x[1,])
if (par3 == 'Linear Trend'){
x <- cbind(x, c(1:n))
colnames(x)[k+1] <- 't'
}
x
k <- length(x[1,])
df <- as.data.frame(x)
(mylm <- lm(df))
(mysum <- summary(mylm))
if (n > n25) {
kp3 <- k + 3
nmkm3 <- n - k - 3
gqarr <- array(NA, dim=c(nmkm3-kp3+1,3))
numgqtests <- 0
numsignificant1 <- 0
numsignificant5 <- 0
numsignificant10 <- 0
for (mypoint in kp3:nmkm3) {
j <- 0
numgqtests <- numgqtests + 1
for (myalt in c('greater', 'two.sided', 'less')) {
j <- j + 1
gqarr[mypoint-kp3+1,j] <- gqtest(mylm, point=mypoint, alternative=myalt)$p.value
}
if (gqarr[mypoint-kp3+1,2] < 0.01) numsignificant1 <- numsignificant1 + 1
if (gqarr[mypoint-kp3+1,2] < 0.05) numsignificant5 <- numsignificant5 + 1
if (gqarr[mypoint-kp3+1,2] < 0.10) numsignificant10 <- numsignificant10 + 1
}
gqarr
}
bitmap(file='test0.png')
plot(x[,1], type='l', main='Actuals and Interpolation', ylab='value of Actuals and Interpolation (dots)', xlab='time or index')
points(x[,1]-mysum$resid)
grid()
dev.off()
bitmap(file='test1.png')
plot(mysum$resid, type='b', pch=19, main='Residuals', ylab='value of Residuals', xlab='time or index')
grid()
dev.off()
bitmap(file='test2.png')
hist(mysum$resid, main='Residual Histogram', xlab='values of Residuals')
grid()
dev.off()
bitmap(file='test3.png')
densityplot(~mysum$resid,col='black',main='Residual Density Plot', xlab='values of Residuals')
dev.off()
bitmap(file='test4.png')
qqnorm(mysum$resid, main='Residual Normal Q-Q Plot')
qqline(mysum$resid)
grid()
dev.off()
(myerror <- as.ts(mysum$resid))
bitmap(file='test5.png')
dum <- cbind(lag(myerror,k=1),myerror)
dum
dum1 <- dum[2:length(myerror),]
dum1
z <- as.data.frame(dum1)
z
plot(z,main=paste('Residual Lag plot, lowess, and regression line'), ylab='values of Residuals', xlab='lagged values of Residuals')
lines(lowess(z))
abline(lm(z))
grid()
dev.off()
bitmap(file='test6.png')
acf(mysum$resid, lag.max=length(mysum$resid)/2, main='Residual Autocorrelation Function')
grid()
dev.off()
bitmap(file='test7.png')
pacf(mysum$resid, lag.max=length(mysum$resid)/2, main='Residual Partial Autocorrelation Function')
grid()
dev.off()
bitmap(file='test8.png')
opar <- par(mfrow = c(2,2), oma = c(0, 0, 1.1, 0))
plot(mylm, las = 1, sub='Residual Diagnostics')
par(opar)
dev.off()
if (n > n25) {
bitmap(file='test9.png')
plot(kp3:nmkm3,gqarr[,2], main='Goldfeld-Quandt test',ylab='2-sided p-value',xlab='breakpoint')
grid()
dev.off()
}
load(file='createtable')
a<-table.start()
a<-table.row.start(a)
a<-table.element(a, 'Multiple Linear Regression - Estimated Regression Equation', 1, TRUE)
a<-table.row.end(a)
myeq <- colnames(x)[1]
myeq <- paste(myeq, '[t] = ', sep='')
for (i in 1:k){
if (mysum$coefficients[i,1] > 0) myeq <- paste(myeq, '+', '')
myeq <- paste(myeq, mysum$coefficients[i,1], sep=' ')
if (rownames(mysum$coefficients)[i] != '(Intercept)') {
myeq <- paste(myeq, rownames(mysum$coefficients)[i], sep='')
if (rownames(mysum$coefficients)[i] != 't') myeq <- paste(myeq, '[t]', sep='')
}
}
myeq <- paste(myeq, ' + e[t]')
a<-table.row.start(a)
a<-table.element(a, myeq)
a<-table.row.end(a)
a<-table.end(a)
table.save(a,file='mytable1.tab')
a<-table.start()
a<-table.row.start(a)
a<-table.element(a,hyperlink('ols1.htm','Multiple Linear Regression - Ordinary Least Squares',''), 6, TRUE)
a<-table.row.end(a)
a<-table.row.start(a)
a<-table.element(a,'Variable',header=TRUE)
a<-table.element(a,'Parameter',header=TRUE)
a<-table.element(a,'S.D.',header=TRUE)
a<-table.element(a,'T-STAT
H0: parameter = 0',header=TRUE)
a<-table.element(a,'2-tail p-value',header=TRUE)
a<-table.element(a,'1-tail p-value',header=TRUE)
a<-table.row.end(a)
for (i in 1:k){
a<-table.row.start(a)
a<-table.element(a,rownames(mysum$coefficients)[i],header=TRUE)
a<-table.element(a,mysum$coefficients[i,1])
a<-table.element(a, round(mysum$coefficients[i,2],6))
a<-table.element(a, round(mysum$coefficients[i,3],4))
a<-table.element(a, round(mysum$coefficients[i,4],6))
a<-table.element(a, round(mysum$coefficients[i,4]/2,6))
a<-table.row.end(a)
}
a<-table.end(a)
table.save(a,file='mytable2.tab')
a<-table.start()
a<-table.row.start(a)
a<-table.element(a, 'Multiple Linear Regression - Regression Statistics', 2, TRUE)
a<-table.row.end(a)
a<-table.row.start(a)
a<-table.element(a, 'Multiple R',1,TRUE)
a<-table.element(a, sqrt(mysum$r.squared))
a<-table.row.end(a)
a<-table.row.start(a)
a<-table.element(a, 'R-squared',1,TRUE)
a<-table.element(a, mysum$r.squared)
a<-table.row.end(a)
a<-table.row.start(a)
a<-table.element(a, 'Adjusted R-squared',1,TRUE)
a<-table.element(a, mysum$adj.r.squared)
a<-table.row.end(a)
a<-table.row.start(a)
a<-table.element(a, 'F-TEST (value)',1,TRUE)
a<-table.element(a, mysum$fstatistic[1])
a<-table.row.end(a)
a<-table.row.start(a)
a<-table.element(a, 'F-TEST (DF numerator)',1,TRUE)
a<-table.element(a, mysum$fstatistic[2])
a<-table.row.end(a)
a<-table.row.start(a)
a<-table.element(a, 'F-TEST (DF denominator)',1,TRUE)
a<-table.element(a, mysum$fstatistic[3])
a<-table.row.end(a)
a<-table.row.start(a)
a<-table.element(a, 'p-value',1,TRUE)
a<-table.element(a, 1-pf(mysum$fstatistic[1],mysum$fstatistic[2],mysum$fstatistic[3]))
a<-table.row.end(a)
a<-table.row.start(a)
a<-table.element(a, 'Multiple Linear Regression - Residual Statistics', 2, TRUE)
a<-table.row.end(a)
a<-table.row.start(a)
a<-table.element(a, 'Residual Standard Deviation',1,TRUE)
a<-table.element(a, mysum$sigma)
a<-table.row.end(a)
a<-table.row.start(a)
a<-table.element(a, 'Sum Squared Residuals',1,TRUE)
a<-table.element(a, sum(myerror*myerror))
a<-table.row.end(a)
a<-table.end(a)
table.save(a,file='mytable3.tab')
a<-table.start()
a<-table.row.start(a)
a<-table.element(a, 'Multiple Linear Regression - Actuals, Interpolation, and Residuals', 4, TRUE)
a<-table.row.end(a)
a<-table.row.start(a)
a<-table.element(a, 'Time or Index', 1, TRUE)
a<-table.element(a, 'Actuals', 1, TRUE)
a<-table.element(a, 'Interpolation
Forecast', 1, TRUE)
a<-table.element(a, 'Residuals
Prediction Error', 1, TRUE)
a<-table.row.end(a)
for (i in 1:n) {
a<-table.row.start(a)
a<-table.element(a,i, 1, TRUE)
a<-table.element(a,x[i])
a<-table.element(a,x[i]-mysum$resid[i])
a<-table.element(a,mysum$resid[i])
a<-table.row.end(a)
}
a<-table.end(a)
table.save(a,file='mytable4.tab')
if (n > n25) {
a<-table.start()
a<-table.row.start(a)
a<-table.element(a,'Goldfeld-Quandt test for Heteroskedasticity',4,TRUE)
a<-table.row.end(a)
a<-table.row.start(a)
a<-table.element(a,'p-values',header=TRUE)
a<-table.element(a,'Alternative Hypothesis',3,header=TRUE)
a<-table.row.end(a)
a<-table.row.start(a)
a<-table.element(a,'breakpoint index',header=TRUE)
a<-table.element(a,'greater',header=TRUE)
a<-table.element(a,'2-sided',header=TRUE)
a<-table.element(a,'less',header=TRUE)
a<-table.row.end(a)
for (mypoint in kp3:nmkm3) {
a<-table.row.start(a)
a<-table.element(a,mypoint,header=TRUE)
a<-table.element(a,gqarr[mypoint-kp3+1,1])
a<-table.element(a,gqarr[mypoint-kp3+1,2])
a<-table.element(a,gqarr[mypoint-kp3+1,3])
a<-table.row.end(a)
}
a<-table.end(a)
table.save(a,file='mytable5.tab')
a<-table.start()
a<-table.row.start(a)
a<-table.element(a,'Meta Analysis of Goldfeld-Quandt test for Heteroskedasticity',4,TRUE)
a<-table.row.end(a)
a<-table.row.start(a)
a<-table.element(a,'Description',header=TRUE)
a<-table.element(a,'# significant tests',header=TRUE)
a<-table.element(a,'% significant tests',header=TRUE)
a<-table.element(a,'OK/NOK',header=TRUE)
a<-table.row.end(a)
a<-table.row.start(a)
a<-table.element(a,'1% type I error level',header=TRUE)
a<-table.element(a,numsignificant1)
a<-table.element(a,numsignificant1/numgqtests)
if (numsignificant1/numgqtests < 0.01) dum <- 'OK' else dum <- 'NOK'
a<-table.element(a,dum)
a<-table.row.end(a)
a<-table.row.start(a)
a<-table.element(a,'5% type I error level',header=TRUE)
a<-table.element(a,numsignificant5)
a<-table.element(a,numsignificant5/numgqtests)
if (numsignificant5/numgqtests < 0.05) dum <- 'OK' else dum <- 'NOK'
a<-table.element(a,dum)
a<-table.row.end(a)
a<-table.row.start(a)
a<-table.element(a,'10% type I error level',header=TRUE)
a<-table.element(a,numsignificant10)
a<-table.element(a,numsignificant10/numgqtests)
if (numsignificant10/numgqtests < 0.1) dum <- 'OK' else dum <- 'NOK'
a<-table.element(a,dum)
a<-table.row.end(a)
a<-table.end(a)
table.save(a,file='mytable6.tab')
}