| Multiple Linear Regression - Estimated Regression Equation |
| Y[t] = + 7.22953434391532 + 0.00648463349489511X[t] -1.85480014419147M1[t] + 3.16277160464226M2[t] + 3.06233004168446M3[t] + 3.48919297729325M4[t] + 1.93148382070862M5[t] + 4.08278029553563M6[t] + 0.996538751573457M7[t] + 1.00824945372864M8[t] + 1.82732939754611M9[t] + 0.221975324946219M10[t] -0.441128652098417M11[t] -0.168432673465854t + e[t] |
| Multiple Linear Regression - Ordinary Least Squares | |||||
| Variable | Parameter | S.D. | T-STAT H0: parameter = 0 | 2-tail p-value | 1-tail p-value |
| (Intercept) | 7.22953434391532 | 8.554042 | 0.8452 | 0.402304 | 0.201152 |
| X | 0.00648463349489511 | 0.002947 | 2.2008 | 0.032702 | 0.016351 |
| M1 | -1.85480014419147 | 3.524316 | -0.5263 | 0.601164 | 0.300582 |
| M2 | 3.16277160464226 | 3.636444 | 0.8697 | 0.388861 | 0.194431 |
| M3 | 3.06233004168446 | 3.65728 | 0.8373 | 0.406648 | 0.203324 |
| M4 | 3.48919297729325 | 3.635122 | 0.9599 | 0.34204 | 0.17102 |
| M5 | 1.93148382070862 | 3.589874 | 0.538 | 0.593091 | 0.296545 |
| M6 | 4.08278029553563 | 3.741828 | 1.0911 | 0.280783 | 0.140391 |
| M7 | 0.996538751573457 | 3.615776 | 0.2756 | 0.784057 | 0.392028 |
| M8 | 1.00824945372864 | 3.583742 | 0.2813 | 0.779685 | 0.389842 |
| M9 | 1.82732939754611 | 3.591465 | 0.5088 | 0.613274 | 0.306637 |
| M10 | 0.221975324946219 | 3.594739 | 0.0618 | 0.951024 | 0.475512 |
| M11 | -0.441128652098417 | 3.578791 | -0.1233 | 0.902425 | 0.451213 |
| t | -0.168432673465854 | 0.049605 | -3.3955 | 0.001402 | 0.000701 |
| Multiple Linear Regression - Regression Statistics | |
| Multiple R | 0.671765465070318 |
| R-squared | 0.45126884006114 |
| Adjusted R-squared | 0.299492136248264 |
| F-TEST (value) | 2.97324180012174 |
| F-TEST (DF numerator) | 13 |
| F-TEST (DF denominator) | 47 |
| p-value | 0.00308389822045241 |
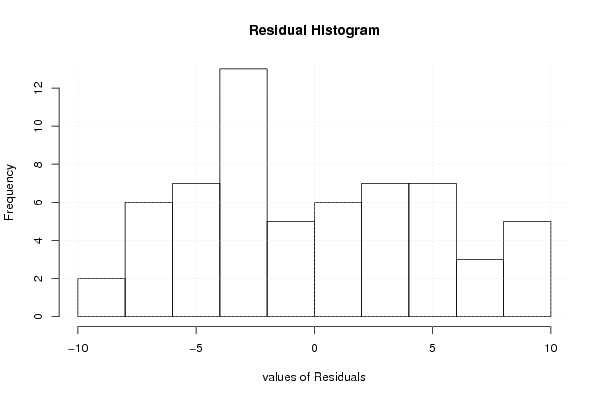
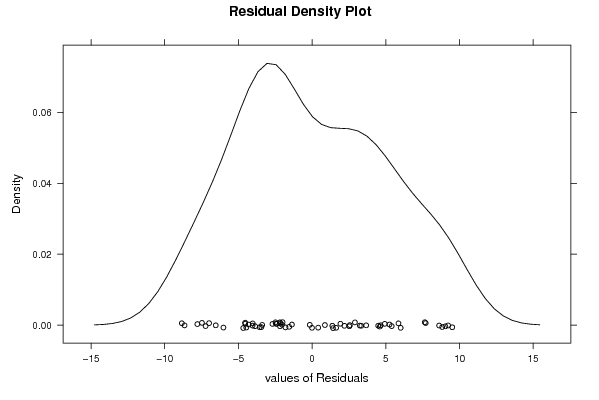
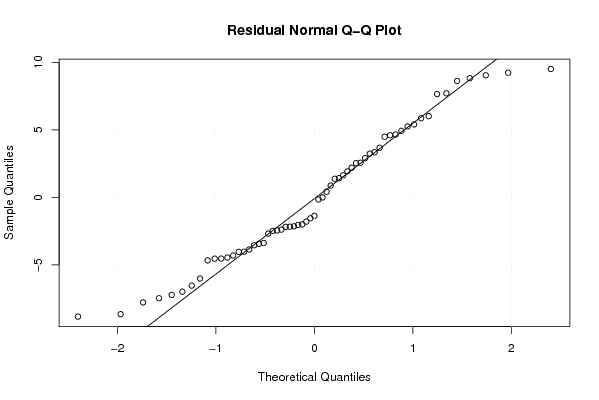
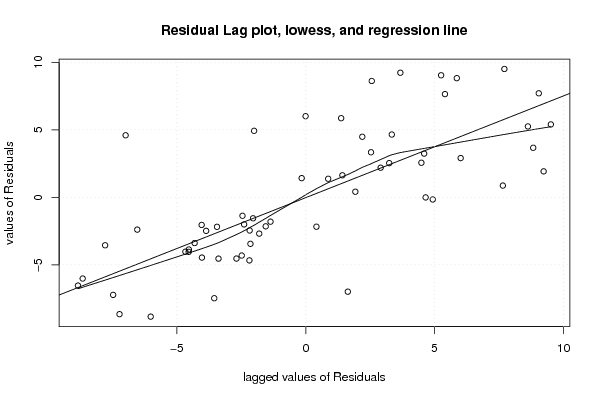
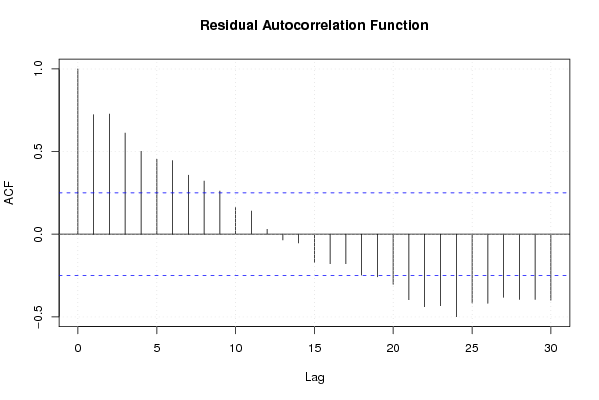
| Multiple Linear Regression - Residual Statistics | |
| Residual Standard Deviation | 5.65710184469093 |
| Sum Squared Residuals | 1504.13166021666 |
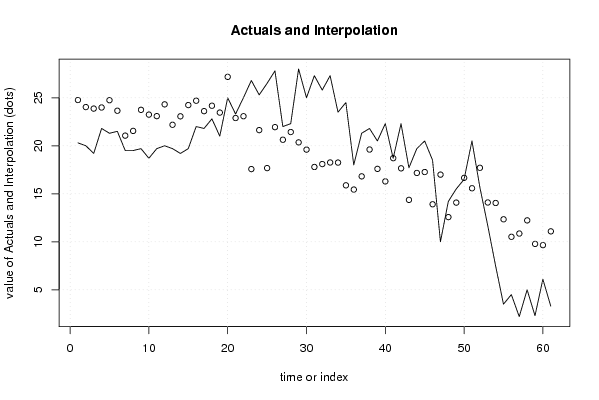
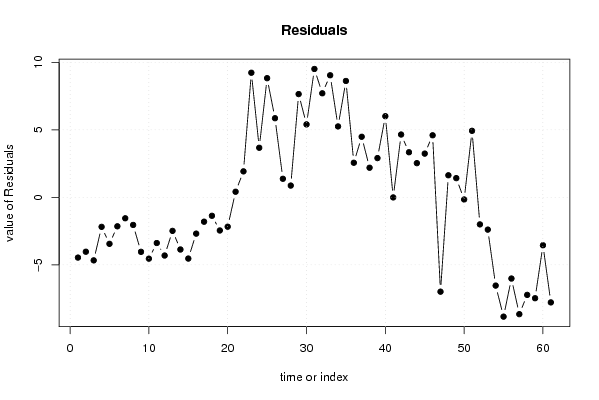
| Multiple Linear Regression - Actuals, Interpolation, and Residuals | |||
| Time or Index | Actuals | Interpolation Forecast | Residuals Prediction Error |
| 1 | 20.3 | 24.7639561468617 | -4.46395614686168 |
| 2 | 20 | 24.0298257831248 | -4.02982578312484 |
| 3 | 19.2 | 23.8711903161144 | -4.67119031611441 |
| 4 | 21.8 | 23.9869586413697 | -2.18695864136965 |
| 5 | 21.3 | 24.744431439864 | -3.44443143986399 |
| 6 | 21.5 | 23.6470943311500 | -2.14709433114998 |
| 7 | 19.5 | 21.0538527302012 | -1.55385273020125 |
| 8 | 19.5 | 21.5455941083801 | -2.04559410838008 |
| 9 | 19.7 | 23.7395841505167 | -4.03958415051675 |
| 10 | 18.7 | 23.2432702029453 | -4.54327020294533 |
| 11 | 19.7 | 23.0861354359039 | -3.38613543590394 |
| 12 | 20 | 24.3120725382861 | -4.31207253828608 |
| 13 | 19.7 | 22.1850855847104 | -2.48508558471044 |
| 14 | 19.2 | 23.0656289612025 | -3.8656289612025 |
| 15 | 19.7 | 24.2363433606456 | -4.53634336064556 |
| 16 | 22 | 24.6893126276354 | -2.68931262763535 |
| 17 | 21.8 | 23.6051495135795 | -1.80514951357948 |
| 18 | 22.8 | 24.1678785795586 | -1.36787857955861 |
| 19 | 21 | 23.4551806921295 | -2.45518069212947 |
| 20 | 25 | 27.1762695507661 | -2.17626955076607 |
| 21 | 23.3 | 22.8856260980076 | 0.414373901992383 |
| 22 | 25 | 23.0766833008951 | 1.92331669910491 |
| 23 | 26.8 | 17.5697259005652 | 9.23027409943477 |
| 24 | 25.3 | 21.6294478402165 | 3.67055215978347 |
| 25 | 26.5 | 17.6737942410805 | 8.82620575891953 |
| 26 | 27.8 | 21.9393163019078 | 5.86068369809222 |
| 27 | 22 | 20.626416072806 | 1.37358392719399 |
| 28 | 22.3 | 21.4295555485201 | 0.870444451479859 |
| 29 | 28 | 20.3518770679592 | 7.64812293204083 |
| 30 | 25 | 19.5982255344746 | 5.40177446552541 |
| 31 | 27.3 | 17.7896245864082 | 9.51037541359183 |
| 32 | 25.8 | 18.0933115932351 | 7.70668840676495 |
| 33 | 27.3 | 18.2576113514695 | 9.04238864853047 |
| 34 | 23.5 | 18.2476449160153 | 5.25235508398474 |
| 35 | 24.5 | 15.8792501272146 | 8.62074987278537 |
| 36 | 18 | 15.4386364214087 | 2.56136357859127 |
| 37 | 21.3 | 16.8133515550764 | 4.48664844492355 |
| 38 | 21.8 | 19.6068618125626 | 2.19313818743744 |
| 39 | 20.5 | 17.5936211660121 | 2.90637883398787 |
| 40 | 22.3 | 16.2892547558853 | 6.01074524411465 |
| 41 | 18.7 | 18.7067937290728 | -0.00679372907283377 |
| 42 | 22.3 | 17.6483644213282 | 4.65163557867181 |
| 43 | 17.7 | 14.3612670364257 | 3.33873296357432 |
| 44 | 19.7 | 17.1680225722821 | 2.53197742771792 |
| 45 | 20.5 | 17.2609913620727 | 3.23900863792728 |
| 46 | 18.5 | 13.9049540432526 | 4.59504595674744 |
| 47 | 10 | 16.9901360236587 | -6.99013602365872 |
| 48 | 14.2 | 12.5679573519872 | 1.63204264801278 |
| 49 | 15.5 | 14.0788497890477 | 1.42115021095226 |
| 50 | 16.5 | 16.6583671412023 | -0.158367141202320 |
| 51 | 20.5 | 15.5724290844219 | 4.92757091557812 |
| 52 | 15.7 | 17.7049184265895 | -2.00491842658951 |
| 53 | 11.7 | 14.0917482495245 | -2.39174824952454 |
| 54 | 7.5 | 14.0384371334886 | -6.53843713348864 |
| 55 | 3.5 | 12.3400749548354 | -8.84007495483544 |
| 56 | 4.5 | 10.5168021753367 | -6.01680217533672 |
| 57 | 2.2 | 10.8561870379334 | -8.65618703793338 |
| 58 | 5 | 12.2274475368918 | -7.22744753689176 |
| 59 | 2.3 | 9.77475251265749 | -7.47475251265749 |
| 60 | 6.1 | 9.65188584810145 | -3.55188584810145 |
| 61 | 3.3 | 11.0849626832232 | -7.78496268322322 |
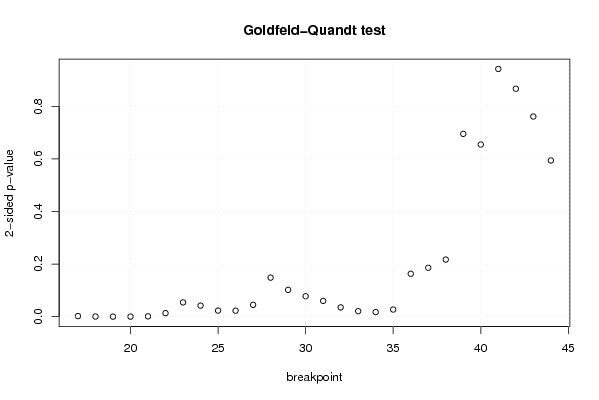
| Goldfeld-Quandt test for Heteroskedasticity | |||
| p-values | Alternative Hypothesis | ||
| breakpoint index | greater | 2-sided | less |
| 17 | 0.00108213959810282 | 0.00216427919620565 | 0.998917860401897 |
| 18 | 0.00026909844887223 | 0.00053819689774446 | 0.999730901551128 |
| 19 | 3.04499007893721e-05 | 6.08998015787441e-05 | 0.99996955009921 |
| 20 | 3.46076640413878e-05 | 6.92153280827757e-05 | 0.999965392335959 |
| 21 | 0.000619679027915768 | 0.00123935805583154 | 0.999380320972084 |
| 22 | 0.00670450794536656 | 0.0134090158907331 | 0.993295492054633 |
| 23 | 0.0270725304580489 | 0.0541450609160978 | 0.972927469541951 |
| 24 | 0.0210055601559515 | 0.042011120311903 | 0.978994439844048 |
| 25 | 0.0115740888951302 | 0.0231481777902603 | 0.98842591110487 |
| 26 | 0.0113669541333130 | 0.0227339082666260 | 0.988633045866687 |
| 27 | 0.0224958214700794 | 0.0449916429401587 | 0.97750417852992 |
| 28 | 0.0742557070366955 | 0.148511414073391 | 0.925744292963305 |
| 29 | 0.050965236059017 | 0.101930472118034 | 0.949034763940983 |
| 30 | 0.0389279404471108 | 0.0778558808942216 | 0.96107205955289 |
| 31 | 0.0299962383768130 | 0.0599924767536259 | 0.970003761623187 |
| 32 | 0.0176669128401980 | 0.0353338256803960 | 0.982333087159802 |
| 33 | 0.0104610767395953 | 0.0209221534791906 | 0.989538923260405 |
| 34 | 0.00869626769017574 | 0.0173925353803515 | 0.991303732309824 |
| 35 | 0.0135556599877816 | 0.0271113199755632 | 0.986444340012218 |
| 36 | 0.0816591408327444 | 0.163318281665489 | 0.918340859167255 |
| 37 | 0.093024557336325 | 0.18604911467265 | 0.906975442663675 |
| 38 | 0.108602638282769 | 0.217205276565538 | 0.891397361717231 |
| 39 | 0.347733910043891 | 0.695467820087782 | 0.652266089956109 |
| 40 | 0.327419748409598 | 0.654839496819195 | 0.672580251590402 |
| 41 | 0.5288169040724 | 0.9423661918552 | 0.4711830959276 |
| 42 | 0.433495899337197 | 0.866991798674394 | 0.566504100662803 |
| 43 | 0.380654231295054 | 0.761308462590109 | 0.619345768704946 |
| 44 | 0.297119779894153 | 0.594239559788305 | 0.702880220105847 |
| Meta Analysis of Goldfeld-Quandt test for Heteroskedasticity | |||
| Description | # significant tests | % significant tests | OK/NOK |
| 1% type I error level | 5 | 0.178571428571429 | NOK |
| 5% type I error level | 14 | 0.5 | NOK |
| 10% type I error level | 17 | 0.607142857142857 | NOK |