| Multiple Linear Regression - Estimated Regression Equation |
| Y[t] = + 79.3607618844651 + 12.4028527007149X[t] + 0.948720399414102Y1[t] + 0.0452222789877021Y2[t] -0.0408328304937311Y3[t] -0.0614850910601708Y4[t] -23.7371627758512M1[t] -27.9989333349529M2[t] -24.4920114941735M3[t] -6.19985693337634M4[t] -6.38345082070392M5[t] -13.9880587951269M6[t] -19.3849873747136M7[t] -15.2421114767019M8[t] -20.9699777464923M9[t] -8.16895780312471M10[t] + 41.071920254817M11[t] -0.36680636578864t + e[t] |
| Multiple Linear Regression - Ordinary Least Squares | |||||
| Variable | Parameter | S.D. | T-STAT H0: parameter = 0 | 2-tail p-value | 1-tail p-value |
| (Intercept) | 79.3607618844651 | 28.751888 | 2.7602 | 0.008456 | 0.004228 |
| X | 12.4028527007149 | 4.154524 | 2.9854 | 0.004659 | 0.002329 |
| Y1 | 0.948720399414102 | 0.147118 | 6.4487 | 0 | 0 |
| Y2 | 0.0452222789877021 | 0.205777 | 0.2198 | 0.827095 | 0.413548 |
| Y3 | -0.0408328304937311 | 0.20551 | -0.1987 | 0.843441 | 0.421721 |
| Y4 | -0.0614850910601708 | 0.147137 | -0.4179 | 0.678116 | 0.339058 |
| M1 | -23.7371627758512 | 10.356885 | -2.2919 | 0.026868 | 0.013434 |
| M2 | -27.9989333349529 | 13.536032 | -2.0685 | 0.044643 | 0.022321 |
| M3 | -24.4920114941735 | 11.115007 | -2.2035 | 0.032964 | 0.016482 |
| M4 | -6.19985693337634 | 10.779711 | -0.5751 | 0.568193 | 0.284097 |
| M5 | -6.38345082070392 | 8.57903 | -0.7441 | 0.460877 | 0.230439 |
| M6 | -13.9880587951269 | 8.328297 | -1.6796 | 0.100291 | 0.050146 |
| M7 | -19.3849873747136 | 9.408562 | -2.0604 | 0.045448 | 0.022724 |
| M8 | -15.2421114767019 | 9.985531 | -1.5264 | 0.134228 | 0.067114 |
| M9 | -20.9699777464923 | 9.375399 | -2.2367 | 0.030545 | 0.015272 |
| M10 | -8.16895780312471 | 10.069057 | -0.8113 | 0.421665 | 0.210833 |
| M11 | 41.071920254817 | 8.5649 | 4.7954 | 2e-05 | 1e-05 |
| t | -0.36680636578864 | 0.120071 | -3.0549 | 0.003857 | 0.001928 |
| Multiple Linear Regression - Regression Statistics | |
| Multiple R | 0.991204866841592 |
| R-squared | 0.98248708805046 |
| Adjusted R-squared | 0.97556337867506 |
| F-TEST (value) | 141.901838274907 |
| F-TEST (DF numerator) | 17 |
| F-TEST (DF denominator) | 43 |
| p-value | 0 |
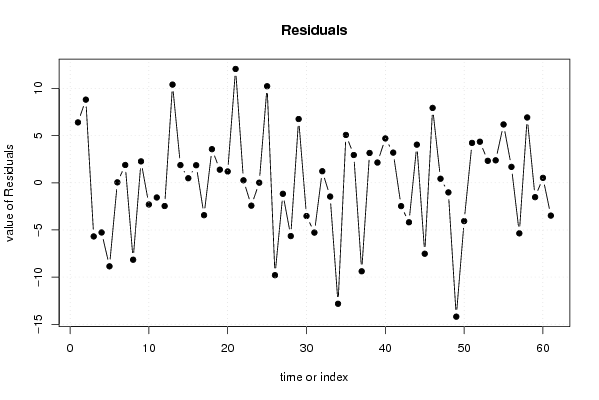
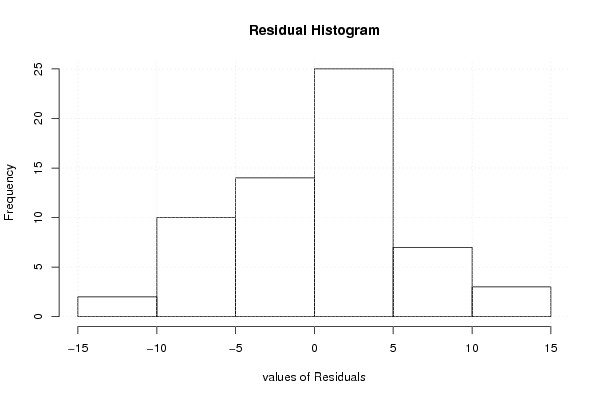
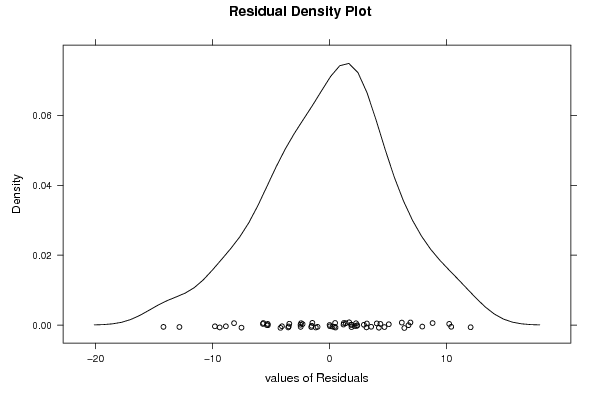
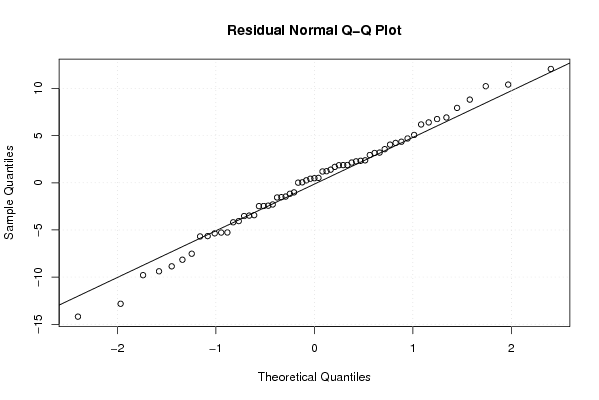
| Multiple Linear Regression - Residual Statistics | |
| Residual Standard Deviation | 6.5733111803007 |
| Sum Squared Residuals | 1857.96205454184 |
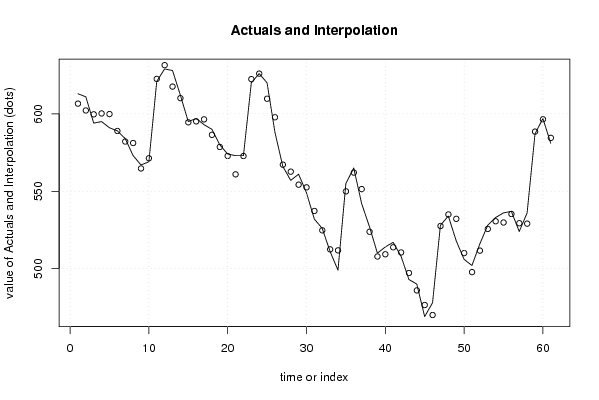
| Multiple Linear Regression - Actuals, Interpolation, and Residuals | |||
| Time or Index | Actuals | Interpolation Forecast | Residuals Prediction Error |
| 1 | 613 | 606.59726964613 | 6.40273035387012 |
| 2 | 611 | 602.183527361317 | 8.81647263868347 |
| 3 | 594 | 599.686748832992 | -5.68674883299231 |
| 4 | 595 | 600.266493470975 | -5.26649347097542 |
| 5 | 591 | 599.85473035335 | -8.85473035334952 |
| 6 | 589 | 588.950784994983 | 0.0492150050170205 |
| 7 | 584 | 582.113133852358 | 1.88686614764226 |
| 8 | 573 | 581.15700306045 | -8.15700306044966 |
| 9 | 567 | 564.727900661605 | 2.27209933839482 |
| 10 | 569 | 571.299481108424 | -2.29948110842371 |
| 11 | 621 | 622.556246516211 | -1.55624651621067 |
| 12 | 629 | 631.462758207738 | -2.46275820773805 |
| 13 | 628 | 617.587355654145 | 10.4126443458549 |
| 14 | 612 | 610.125559193948 | 1.87444080605214 |
| 15 | 595 | 594.517038620247 | 0.482961379753423 |
| 16 | 597 | 595.139535663424 | 1.86046433657554 |
| 17 | 593 | 596.432607845305 | -3.43260784530546 |
| 18 | 590 | 586.434676040769 | 3.565323959231 |
| 19 | 580 | 578.607471668236 | 1.39252833176405 |
| 20 | 574 | 572.80103150921 | 1.19896849079054 |
| 21 | 573 | 560.930252542991 | 12.0697474570093 |
| 22 | 573 | 572.737195625347 | 0.262804374652884 |
| 23 | 620 | 622.425892932077 | -2.42589293207659 |
| 24 | 626 | 625.986768460789 | 0.0132315392114816 |
| 25 | 620 | 609.762053919115 | 10.2379460808845 |
| 26 | 588 | 597.793345238461 | -9.7933452384613 |
| 27 | 566 | 567.168277995484 | -1.16827799548417 |
| 28 | 557 | 562.650750912377 | -5.65075091237739 |
| 29 | 561 | 554.242538048965 | 6.75746195103478 |
| 30 | 549 | 552.524849980308 | -3.52484998030826 |
| 31 | 532 | 537.277526835682 | -5.2775268356818 |
| 32 | 526 | 524.772716727579 | 1.22728327242068 |
| 33 | 511 | 512.460996554409 | -1.46099655440884 |
| 34 | 499 | 511.825049677965 | -12.8250496779655 |
| 35 | 555 | 549.926385923319 | 5.0736140766809 |
| 36 | 565 | 562.054737325818 | 2.94526267418223 |
| 37 | 542 | 551.382690133458 | -9.38269013345761 |
| 38 | 527 | 523.836949396993 | 3.16305060300701 |
| 39 | 510 | 507.854653059748 | 2.14534694025179 |
| 40 | 514 | 509.297724470656 | 4.7022755293444 |
| 41 | 517 | 513.800076624195 | 3.19992337580525 |
| 42 | 508 | 510.472147082472 | -2.47214708247227 |
| 43 | 493 | 497.187510605381 | -4.18751060538104 |
| 44 | 490 | 485.957334779781 | 4.04266522021862 |
| 45 | 469 | 476.521206962408 | -7.5212069624076 |
| 46 | 478 | 470.062483592275 | 7.93751640772524 |
| 47 | 528 | 527.570145877797 | 0.429854122203224 |
| 48 | 534 | 535.016384452334 | -1.01638445233443 |
| 49 | 518 | 532.192395795099 | -14.1923957950993 |
| 50 | 506 | 510.060618809281 | -4.06061880928134 |
| 51 | 502 | 497.773281491529 | 4.22671850847127 |
| 52 | 516 | 511.645495482567 | 4.35450451743287 |
| 53 | 528 | 525.670047128185 | 2.32995287181495 |
| 54 | 533 | 530.617541901467 | 2.38245809853252 |
| 55 | 536 | 529.814357038343 | 6.18564296165652 |
| 56 | 537 | 535.31191392298 | 1.68808607701981 |
| 57 | 524 | 529.359643278588 | -5.35964327858768 |
| 58 | 536 | 529.075789995989 | 6.92421000401108 |
| 59 | 587 | 588.521328750597 | -1.52132875059686 |
| 60 | 597 | 596.479351553321 | 0.520648446678803 |
| 61 | 581 | 584.478234852053 | -3.47823485205266 |
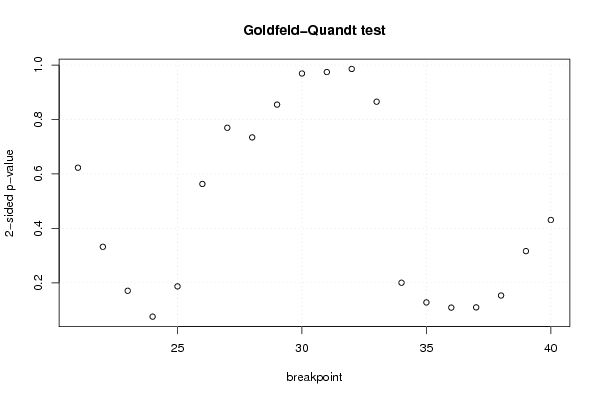
| Goldfeld-Quandt test for Heteroskedasticity | |||
| p-values | Alternative Hypothesis | ||
| breakpoint index | greater | 2-sided | less |
| 21 | 0.311461812612402 | 0.622923625224803 | 0.688538187387598 |
| 22 | 0.166212528929503 | 0.332425057859007 | 0.833787471070497 |
| 23 | 0.0853904517369203 | 0.170780903473841 | 0.91460954826308 |
| 24 | 0.0378965674209491 | 0.0757931348418981 | 0.96210343257905 |
| 25 | 0.0935274385532758 | 0.187054877106552 | 0.906472561446724 |
| 26 | 0.71842378897811 | 0.563152422043781 | 0.281576211021891 |
| 27 | 0.615245025683428 | 0.769509948633143 | 0.384754974316572 |
| 28 | 0.632863399017075 | 0.73427320196585 | 0.367136600982925 |
| 29 | 0.572649685443431 | 0.854700629113138 | 0.427350314556569 |
| 30 | 0.515510554772125 | 0.96897889045575 | 0.484489445227875 |
| 31 | 0.512852873394608 | 0.974294253210785 | 0.487147126605392 |
| 32 | 0.507174275427638 | 0.985651449144724 | 0.492825724572362 |
| 33 | 0.567349085719258 | 0.865301828561483 | 0.432650914280742 |
| 34 | 0.899785504468328 | 0.200428991063345 | 0.100214495531673 |
| 35 | 0.935984800982208 | 0.128030398035584 | 0.0640151990177919 |
| 36 | 0.945479285620718 | 0.109041428758564 | 0.054520714379282 |
| 37 | 0.945038732790595 | 0.109922534418809 | 0.0549612672094046 |
| 38 | 0.923275710754993 | 0.153448578490013 | 0.0767242892450066 |
| 39 | 0.841761800407835 | 0.316476399184331 | 0.158238199592165 |
| 40 | 0.784529680450721 | 0.430940639098557 | 0.215470319549279 |
| Meta Analysis of Goldfeld-Quandt test for Heteroskedasticity | |||
| Description | # significant tests | % significant tests | OK/NOK |
| 1% type I error level | 0 | 0 | OK |
| 5% type I error level | 0 | 0 | OK |
| 10% type I error level | 1 | 0.05 | OK |