Free Statistics

of Irreproducible Research!

Author's title

Author*The author of this computation has been verified*
R Software Modulerwasp_multipleregression.wasp
Title produced by softwareMultiple Regression
Date of computationFri, 20 Nov 2009 07:38:05 -0700
Cite this page as followsStatistical Computations at FreeStatistics.org, Office for Research Development and Education, URL https://freestatistics.org/blog/index.php?v=date/2009/Nov/20/t125872794222z7lfzdcl6vnr4.htm/, Retrieved Sat, 20 Apr 2024 02:50:50 +0000
Statistical Computations at FreeStatistics.org, Office for Research Development and Education, URL https://freestatistics.org/blog/index.php?pk=58217, Retrieved Sat, 20 Apr 2024 02:50:50 +0000
QR Codes:

Original text written by user:
IsPrivate?No (this computation is public)
User-defined keywords
Estimated Impact114
Family? (F = Feedback message, R = changed R code, M = changed R Module, P = changed Parameters, D = changed Data)
-       [Multiple Regression] [WS7 Multiple Regr...] [2009-11-20 14:38:05] [2694a35f9be9144abd040893a0238ab5] [Current]
Feedback Forum

Post a new message
Dataseries X:
96.8	92.9
114.1	107.7
110.3	103.5
103.9	91.1
101.6	79.8
94.6	71.9
95.9	82.9
104.7	90.1
102.8	100.7
98.1	90.7
113.9	108.8
80.9	44.1
95.7	93.6
113.2	107.4
105.9	96.5
108.8	93.6
102.3	76.5
99	76.7
100.7	84
115.5	103.3
100.7	88.5
109.9	99
114.6	105.9
85.4	44.7
100.5	94
114.8	107.1
116.5	104.8
112.9	102.5
102	77.7
106	85.2
105.3	91.3
118.8	106.5
106.1	92.4
109.3	97.5
117.2	107
92.5	51.1
104.2	98.6
112.5	102.2
122.4	114.3
113.3	99.4
100	72.5
110.7	92.3
112.8	99.4
109.8	85.9
117.3	109.4
109.1	97.6
115.9	104.7
96	56.9
99.8	86.7
116.8	108.5
115.7	103.4
99.4	86.2
94.3	71
91	75.9
93.2	87.1
103.1	102
94.1	88.5
91.8	87.8
102.7	100.8
82.6	50.6


Summary of computational transaction
Raw Inputview raw input (R code)
Raw Outputview raw output of R engine
Computing time6 seconds
R Server'Gwilym Jenkins' @ 72.249.127.135

\begin{tabular}{lllllllll}
\hline
Summary of computational transaction \tabularnewline
Raw Input & view raw input (R code)  \tabularnewline
Raw Output & view raw output of R engine  \tabularnewline
Computing time & 6 seconds \tabularnewline
R Server & 'Gwilym Jenkins' @ 72.249.127.135 \tabularnewline
\hline
\end{tabular}
%Source: https://freestatistics.org/blog/index.php?pk=58217&T=0

[TABLE]
[ROW][C]Summary of computational transaction[/C][/ROW]
[ROW][C]Raw Input[/C][C]view raw input (R code) [/C][/ROW]
[ROW][C]Raw Output[/C][C]view raw output of R engine [/C][/ROW]
[ROW][C]Computing time[/C][C]6 seconds[/C][/ROW]
[ROW][C]R Server[/C][C]'Gwilym Jenkins' @ 72.249.127.135[/C][/ROW]
[/TABLE]
Source: https://freestatistics.org/blog/index.php?pk=58217&T=0

Globally Unique Identifier (entire table): ba.freestatistics.org/blog/index.php?pk=58217&T=0

As an alternative you can also use a QR Code:  

The GUIDs for individual cells are displayed in the table below:

Summary of computational transaction
Raw Inputview raw input (R code)
Raw Outputview raw output of R engine
Computing time6 seconds
R Server'Gwilym Jenkins' @ 72.249.127.135


Multiple Linear Regression - Estimated Regression Equation
Totind[t] = + 46.4685613985971 + 0.828848799543308Bouw[t] -24.2841155640517M1[t] -20.5272664539229M2[t] -18.9232609508728M3[t] -17.1845038834123M4[t] -9.00664576411686M5[t] -12.8480048818791M6[t] -18.6063736299789M7[t] -16.9510502820422M8[t] -21.7551612748004M9[t] -21.1713499314306M10[t] -21.0023788224435M11[t] + e[t]

\begin{tabular}{lllllllll}
\hline
Multiple Linear Regression - Estimated Regression Equation \tabularnewline
Totind[t] =  +  46.4685613985971 +  0.828848799543308Bouw[t] -24.2841155640517M1[t] -20.5272664539229M2[t] -18.9232609508728M3[t] -17.1845038834123M4[t] -9.00664576411686M5[t] -12.8480048818791M6[t] -18.6063736299789M7[t] -16.9510502820422M8[t] -21.7551612748004M9[t] -21.1713499314306M10[t] -21.0023788224435M11[t]  + e[t] \tabularnewline
\hline
\end{tabular}
%Source: https://freestatistics.org/blog/index.php?pk=58217&T=1

[TABLE]
[ROW][C]Multiple Linear Regression - Estimated Regression Equation[/C][/ROW]
[ROW][C]Totind[t] =  +  46.4685613985971 +  0.828848799543308Bouw[t] -24.2841155640517M1[t] -20.5272664539229M2[t] -18.9232609508728M3[t] -17.1845038834123M4[t] -9.00664576411686M5[t] -12.8480048818791M6[t] -18.6063736299789M7[t] -16.9510502820422M8[t] -21.7551612748004M9[t] -21.1713499314306M10[t] -21.0023788224435M11[t]  + e[t][/C][/ROW]
[/TABLE]
Source: https://freestatistics.org/blog/index.php?pk=58217&T=1

Globally Unique Identifier (entire table): ba.freestatistics.org/blog/index.php?pk=58217&T=1

As an alternative you can also use a QR Code:  

The GUIDs for individual cells are displayed in the table below:

Multiple Linear Regression - Estimated Regression Equation
Totind[t] = + 46.4685613985971 + 0.828848799543308Bouw[t] -24.2841155640517M1[t] -20.5272664539229M2[t] -18.9232609508728M3[t] -17.1845038834123M4[t] -9.00664576411686M5[t] -12.8480048818791M6[t] -18.6063736299789M7[t] -16.9510502820422M8[t] -21.7551612748004M9[t] -21.1713499314306M10[t] -21.0023788224435M11[t] + e[t]


Multiple Linear Regression - Ordinary Least Squares
VariableParameterS.D.T-STATH0: parameter = 02-tail p-value1-tail p-value
(Intercept)46.46856139859714.789299.702600
Bouw0.8288487995433080.0902839.180500
M1-24.28411556405174.638361-5.23554e-062e-06
M2-20.52726645392295.704246-3.59860.0007670.000384
M3-18.92326095087285.535117-3.41880.0013090.000655
M4-17.18450388341234.746291-3.62060.0007180.000359
M5-9.006645764116863.3884-2.65810.0107070.005353
M6-12.84800488187913.708833-3.46420.0011450.000573
M7-18.60637362997894.319096-4.30798.3e-054.2e-05
M8-16.95105028204224.980495-3.40350.0013690.000685
M9-21.75516127480044.85043-4.48524.7e-052.3e-05
M10-21.17134993143064.743194-4.46355e-052.5e-05
M11-21.00237882244355.611403-3.74280.0004950.000248

\begin{tabular}{lllllllll}
\hline
Multiple Linear Regression - Ordinary Least Squares \tabularnewline
Variable & Parameter & S.D. & T-STATH0: parameter = 0 & 2-tail p-value & 1-tail p-value \tabularnewline
(Intercept) & 46.4685613985971 & 4.78929 & 9.7026 & 0 & 0 \tabularnewline
Bouw & 0.828848799543308 & 0.090283 & 9.1805 & 0 & 0 \tabularnewline
M1 & -24.2841155640517 & 4.638361 & -5.2355 & 4e-06 & 2e-06 \tabularnewline
M2 & -20.5272664539229 & 5.704246 & -3.5986 & 0.000767 & 0.000384 \tabularnewline
M3 & -18.9232609508728 & 5.535117 & -3.4188 & 0.001309 & 0.000655 \tabularnewline
M4 & -17.1845038834123 & 4.746291 & -3.6206 & 0.000718 & 0.000359 \tabularnewline
M5 & -9.00664576411686 & 3.3884 & -2.6581 & 0.010707 & 0.005353 \tabularnewline
M6 & -12.8480048818791 & 3.708833 & -3.4642 & 0.001145 & 0.000573 \tabularnewline
M7 & -18.6063736299789 & 4.319096 & -4.3079 & 8.3e-05 & 4.2e-05 \tabularnewline
M8 & -16.9510502820422 & 4.980495 & -3.4035 & 0.001369 & 0.000685 \tabularnewline
M9 & -21.7551612748004 & 4.85043 & -4.4852 & 4.7e-05 & 2.3e-05 \tabularnewline
M10 & -21.1713499314306 & 4.743194 & -4.4635 & 5e-05 & 2.5e-05 \tabularnewline
M11 & -21.0023788224435 & 5.611403 & -3.7428 & 0.000495 & 0.000248 \tabularnewline
\hline
\end{tabular}
%Source: https://freestatistics.org/blog/index.php?pk=58217&T=2

[TABLE]
[ROW][C]Multiple Linear Regression - Ordinary Least Squares[/C][/ROW]
[ROW][C]Variable[/C][C]Parameter[/C][C]S.D.[/C][C]T-STATH0: parameter = 0[/C][C]2-tail p-value[/C][C]1-tail p-value[/C][/ROW]
[ROW][C](Intercept)[/C][C]46.4685613985971[/C][C]4.78929[/C][C]9.7026[/C][C]0[/C][C]0[/C][/ROW]
[ROW][C]Bouw[/C][C]0.828848799543308[/C][C]0.090283[/C][C]9.1805[/C][C]0[/C][C]0[/C][/ROW]
[ROW][C]M1[/C][C]-24.2841155640517[/C][C]4.638361[/C][C]-5.2355[/C][C]4e-06[/C][C]2e-06[/C][/ROW]
[ROW][C]M2[/C][C]-20.5272664539229[/C][C]5.704246[/C][C]-3.5986[/C][C]0.000767[/C][C]0.000384[/C][/ROW]
[ROW][C]M3[/C][C]-18.9232609508728[/C][C]5.535117[/C][C]-3.4188[/C][C]0.001309[/C][C]0.000655[/C][/ROW]
[ROW][C]M4[/C][C]-17.1845038834123[/C][C]4.746291[/C][C]-3.6206[/C][C]0.000718[/C][C]0.000359[/C][/ROW]
[ROW][C]M5[/C][C]-9.00664576411686[/C][C]3.3884[/C][C]-2.6581[/C][C]0.010707[/C][C]0.005353[/C][/ROW]
[ROW][C]M6[/C][C]-12.8480048818791[/C][C]3.708833[/C][C]-3.4642[/C][C]0.001145[/C][C]0.000573[/C][/ROW]
[ROW][C]M7[/C][C]-18.6063736299789[/C][C]4.319096[/C][C]-4.3079[/C][C]8.3e-05[/C][C]4.2e-05[/C][/ROW]
[ROW][C]M8[/C][C]-16.9510502820422[/C][C]4.980495[/C][C]-3.4035[/C][C]0.001369[/C][C]0.000685[/C][/ROW]
[ROW][C]M9[/C][C]-21.7551612748004[/C][C]4.85043[/C][C]-4.4852[/C][C]4.7e-05[/C][C]2.3e-05[/C][/ROW]
[ROW][C]M10[/C][C]-21.1713499314306[/C][C]4.743194[/C][C]-4.4635[/C][C]5e-05[/C][C]2.5e-05[/C][/ROW]
[ROW][C]M11[/C][C]-21.0023788224435[/C][C]5.611403[/C][C]-3.7428[/C][C]0.000495[/C][C]0.000248[/C][/ROW]
[/TABLE]
Source: https://freestatistics.org/blog/index.php?pk=58217&T=2

Globally Unique Identifier (entire table): ba.freestatistics.org/blog/index.php?pk=58217&T=2

As an alternative you can also use a QR Code:  

The GUIDs for individual cells are displayed in the table below:

Multiple Linear Regression - Ordinary Least Squares
VariableParameterS.D.T-STATH0: parameter = 02-tail p-value1-tail p-value
(Intercept)46.46856139859714.789299.702600
Bouw0.8288487995433080.0902839.180500
M1-24.28411556405174.638361-5.23554e-062e-06
M2-20.52726645392295.704246-3.59860.0007670.000384
M3-18.92326095087285.535117-3.41880.0013090.000655
M4-17.18450388341234.746291-3.62060.0007180.000359
M5-9.006645764116863.3884-2.65810.0107070.005353
M6-12.84800488187913.708833-3.46420.0011450.000573
M7-18.60637362997894.319096-4.30798.3e-054.2e-05
M8-16.95105028204224.980495-3.40350.0013690.000685
M9-21.75516127480044.85043-4.48524.7e-052.3e-05
M10-21.17134993143064.743194-4.46355e-052.5e-05
M11-21.00237882244355.611403-3.74280.0004950.000248


Multiple Linear Regression - Regression Statistics
Multiple R0.931388917304204
R-squared0.867485315277098
Adjusted R-squared0.833651778752102
F-TEST (value)25.6398060733674
F-TEST (DF numerator)12
F-TEST (DF denominator)47
p-value1.11022302462516e-16
Multiple Linear Regression - Residual Statistics
Residual Standard Deviation3.86091525901995
Sum Squared Residuals700.613331954655

\begin{tabular}{lllllllll}
\hline
Multiple Linear Regression - Regression Statistics \tabularnewline
Multiple R & 0.931388917304204 \tabularnewline
R-squared & 0.867485315277098 \tabularnewline
Adjusted R-squared & 0.833651778752102 \tabularnewline
F-TEST (value) & 25.6398060733674 \tabularnewline
F-TEST (DF numerator) & 12 \tabularnewline
F-TEST (DF denominator) & 47 \tabularnewline
p-value & 1.11022302462516e-16 \tabularnewline
Multiple Linear Regression - Residual Statistics \tabularnewline
Residual Standard Deviation & 3.86091525901995 \tabularnewline
Sum Squared Residuals & 700.613331954655 \tabularnewline
\hline
\end{tabular}
%Source: https://freestatistics.org/blog/index.php?pk=58217&T=3

[TABLE]
[ROW][C]Multiple Linear Regression - Regression Statistics[/C][/ROW]
[ROW][C]Multiple R[/C][C]0.931388917304204[/C][/ROW]
[ROW][C]R-squared[/C][C]0.867485315277098[/C][/ROW]
[ROW][C]Adjusted R-squared[/C][C]0.833651778752102[/C][/ROW]
[ROW][C]F-TEST (value)[/C][C]25.6398060733674[/C][/ROW]
[ROW][C]F-TEST (DF numerator)[/C][C]12[/C][/ROW]
[ROW][C]F-TEST (DF denominator)[/C][C]47[/C][/ROW]
[ROW][C]p-value[/C][C]1.11022302462516e-16[/C][/ROW]
[ROW][C]Multiple Linear Regression - Residual Statistics[/C][/ROW]
[ROW][C]Residual Standard Deviation[/C][C]3.86091525901995[/C][/ROW]
[ROW][C]Sum Squared Residuals[/C][C]700.613331954655[/C][/ROW]
[/TABLE]
Source: https://freestatistics.org/blog/index.php?pk=58217&T=3

Globally Unique Identifier (entire table): ba.freestatistics.org/blog/index.php?pk=58217&T=3

As an alternative you can also use a QR Code:  

The GUIDs for individual cells are displayed in the table below:

Multiple Linear Regression - Regression Statistics
Multiple R0.931388917304204
R-squared0.867485315277098
Adjusted R-squared0.833651778752102
F-TEST (value)25.6398060733674
F-TEST (DF numerator)12
F-TEST (DF denominator)47
p-value1.11022302462516e-16
Multiple Linear Regression - Residual Statistics
Residual Standard Deviation3.86091525901995
Sum Squared Residuals700.613331954655


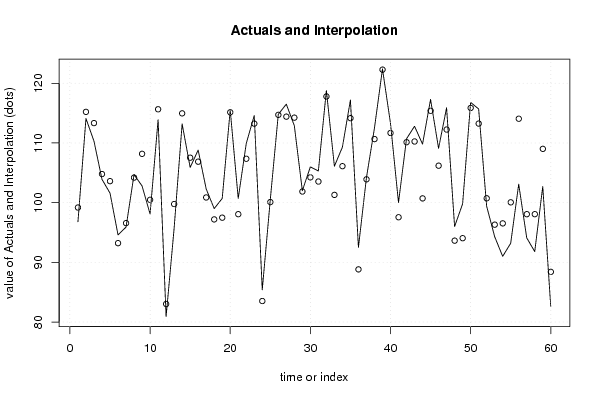
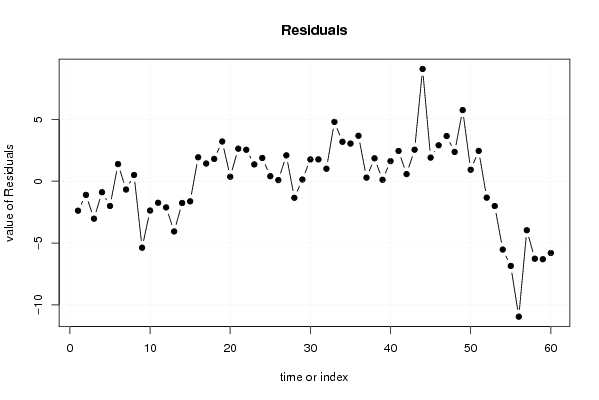
Multiple Linear Regression - Actuals, Interpolation, and Residuals
Time or IndexActualsInterpolationForecastResidualsPrediction Error
196.899.1844993121189-2.38449931211888
2114.1115.208310655489-1.10831065548852
3110.3113.331151200457-3.03115120045669
4103.9104.792183153580-0.892183153580134
5101.6103.604049838036-2.00404983803623
694.693.21478520388191.38521479611812
795.996.5737532507584-0.673753250758427
8104.7104.1967879554070.503212044593087
9102.8108.178474237808-5.37847423780787
1098.1100.473797585745-2.37379758574459
11113.9115.644931966466-1.74493196646551
1280.983.020793458457-2.120793458457
1395.799.764693471799-4.06469347179901
14113.2114.959656015626-1.75965601562551
15105.9107.529209603654-1.62920960365353
16108.8106.8643051524381.93569484756157
17102.3100.8688487995431.43115120045669
189997.19325944168981.80674055831024
19100.797.4854869302563.21451306974394
20115.5115.1375921093790.362407890621414
21100.798.06651888337952.63348111662049
22109.9107.3532426219542.546757378046
23114.6113.241270447791.35872955221007
2485.483.5181027381831.88189726181702
25100.5100.0962329916160.403767008383655
26114.8114.7110013757630.0889986242374845
27116.5114.4086546398632.09134536013700
28112.9114.241059468374-1.34105946837387
29102101.8634673589950.136532641004724
30106104.2384742378081.76152576219212
31105.3103.5360831669221.76391683307779
32118.8117.7899082679171.01009173208283
33106.1101.2990292015984.80097079840157
34109.3106.1099694226393.19003057736094
35117.2114.1530041272883.04699587271244
3692.588.82273505526023.67726494473985
37104.2103.9089374695160.291062530484445
38112.5110.6496422580001.85035774199969
39122.4122.2827182355240.117281764475588
40113.3111.6716281897901.62837181021038
4110097.553453601372.44654639862993
42110.7110.1233007145650.57669928543464
43112.8110.2497584432232.55024155677699
44109.8100.7156229973259.08437700267496
45117.3115.3894587938351.91054120616534
46109.1106.1928543025932.90714569740662
47115.9112.2466518883383.65334811166205
489693.63005809261132.36994190738866
4999.894.04563675495025.7543632450498
50116.8115.8713896951230.928610304876852
51115.7113.2482663205022.45173367949763
5299.4100.730824035818-1.33082403581795
5394.396.310180402055-2.01018040205512
549196.5301804020551-5.53018040205512
5593.2100.054918208840-6.8549182088403
56103.1114.060088669972-10.9600886699723
5794.198.0665188833795-3.96651888337952
5891.898.070136067069-6.27013606706896
59102.7109.014141570119-6.31414157011906
6082.688.4083106554885-5.80831065548851

\begin{tabular}{lllllllll}
\hline
Multiple Linear Regression - Actuals, Interpolation, and Residuals \tabularnewline
Time or Index & Actuals & InterpolationForecast & ResidualsPrediction Error \tabularnewline
1 & 96.8 & 99.1844993121189 & -2.38449931211888 \tabularnewline
2 & 114.1 & 115.208310655489 & -1.10831065548852 \tabularnewline
3 & 110.3 & 113.331151200457 & -3.03115120045669 \tabularnewline
4 & 103.9 & 104.792183153580 & -0.892183153580134 \tabularnewline
5 & 101.6 & 103.604049838036 & -2.00404983803623 \tabularnewline
6 & 94.6 & 93.2147852038819 & 1.38521479611812 \tabularnewline
7 & 95.9 & 96.5737532507584 & -0.673753250758427 \tabularnewline
8 & 104.7 & 104.196787955407 & 0.503212044593087 \tabularnewline
9 & 102.8 & 108.178474237808 & -5.37847423780787 \tabularnewline
10 & 98.1 & 100.473797585745 & -2.37379758574459 \tabularnewline
11 & 113.9 & 115.644931966466 & -1.74493196646551 \tabularnewline
12 & 80.9 & 83.020793458457 & -2.120793458457 \tabularnewline
13 & 95.7 & 99.764693471799 & -4.06469347179901 \tabularnewline
14 & 113.2 & 114.959656015626 & -1.75965601562551 \tabularnewline
15 & 105.9 & 107.529209603654 & -1.62920960365353 \tabularnewline
16 & 108.8 & 106.864305152438 & 1.93569484756157 \tabularnewline
17 & 102.3 & 100.868848799543 & 1.43115120045669 \tabularnewline
18 & 99 & 97.1932594416898 & 1.80674055831024 \tabularnewline
19 & 100.7 & 97.485486930256 & 3.21451306974394 \tabularnewline
20 & 115.5 & 115.137592109379 & 0.362407890621414 \tabularnewline
21 & 100.7 & 98.0665188833795 & 2.63348111662049 \tabularnewline
22 & 109.9 & 107.353242621954 & 2.546757378046 \tabularnewline
23 & 114.6 & 113.24127044779 & 1.35872955221007 \tabularnewline
24 & 85.4 & 83.518102738183 & 1.88189726181702 \tabularnewline
25 & 100.5 & 100.096232991616 & 0.403767008383655 \tabularnewline
26 & 114.8 & 114.711001375763 & 0.0889986242374845 \tabularnewline
27 & 116.5 & 114.408654639863 & 2.09134536013700 \tabularnewline
28 & 112.9 & 114.241059468374 & -1.34105946837387 \tabularnewline
29 & 102 & 101.863467358995 & 0.136532641004724 \tabularnewline
30 & 106 & 104.238474237808 & 1.76152576219212 \tabularnewline
31 & 105.3 & 103.536083166922 & 1.76391683307779 \tabularnewline
32 & 118.8 & 117.789908267917 & 1.01009173208283 \tabularnewline
33 & 106.1 & 101.299029201598 & 4.80097079840157 \tabularnewline
34 & 109.3 & 106.109969422639 & 3.19003057736094 \tabularnewline
35 & 117.2 & 114.153004127288 & 3.04699587271244 \tabularnewline
36 & 92.5 & 88.8227350552602 & 3.67726494473985 \tabularnewline
37 & 104.2 & 103.908937469516 & 0.291062530484445 \tabularnewline
38 & 112.5 & 110.649642258000 & 1.85035774199969 \tabularnewline
39 & 122.4 & 122.282718235524 & 0.117281764475588 \tabularnewline
40 & 113.3 & 111.671628189790 & 1.62837181021038 \tabularnewline
41 & 100 & 97.55345360137 & 2.44654639862993 \tabularnewline
42 & 110.7 & 110.123300714565 & 0.57669928543464 \tabularnewline
43 & 112.8 & 110.249758443223 & 2.55024155677699 \tabularnewline
44 & 109.8 & 100.715622997325 & 9.08437700267496 \tabularnewline
45 & 117.3 & 115.389458793835 & 1.91054120616534 \tabularnewline
46 & 109.1 & 106.192854302593 & 2.90714569740662 \tabularnewline
47 & 115.9 & 112.246651888338 & 3.65334811166205 \tabularnewline
48 & 96 & 93.6300580926113 & 2.36994190738866 \tabularnewline
49 & 99.8 & 94.0456367549502 & 5.7543632450498 \tabularnewline
50 & 116.8 & 115.871389695123 & 0.928610304876852 \tabularnewline
51 & 115.7 & 113.248266320502 & 2.45173367949763 \tabularnewline
52 & 99.4 & 100.730824035818 & -1.33082403581795 \tabularnewline
53 & 94.3 & 96.310180402055 & -2.01018040205512 \tabularnewline
54 & 91 & 96.5301804020551 & -5.53018040205512 \tabularnewline
55 & 93.2 & 100.054918208840 & -6.8549182088403 \tabularnewline
56 & 103.1 & 114.060088669972 & -10.9600886699723 \tabularnewline
57 & 94.1 & 98.0665188833795 & -3.96651888337952 \tabularnewline
58 & 91.8 & 98.070136067069 & -6.27013606706896 \tabularnewline
59 & 102.7 & 109.014141570119 & -6.31414157011906 \tabularnewline
60 & 82.6 & 88.4083106554885 & -5.80831065548851 \tabularnewline
\hline
\end{tabular}
%Source: https://freestatistics.org/blog/index.php?pk=58217&T=4

[TABLE]
[ROW][C]Multiple Linear Regression - Actuals, Interpolation, and Residuals[/C][/ROW]
[ROW][C]Time or Index[/C][C]Actuals[/C][C]InterpolationForecast[/C][C]ResidualsPrediction Error[/C][/ROW]
[ROW][C]1[/C][C]96.8[/C][C]99.1844993121189[/C][C]-2.38449931211888[/C][/ROW]
[ROW][C]2[/C][C]114.1[/C][C]115.208310655489[/C][C]-1.10831065548852[/C][/ROW]
[ROW][C]3[/C][C]110.3[/C][C]113.331151200457[/C][C]-3.03115120045669[/C][/ROW]
[ROW][C]4[/C][C]103.9[/C][C]104.792183153580[/C][C]-0.892183153580134[/C][/ROW]
[ROW][C]5[/C][C]101.6[/C][C]103.604049838036[/C][C]-2.00404983803623[/C][/ROW]
[ROW][C]6[/C][C]94.6[/C][C]93.2147852038819[/C][C]1.38521479611812[/C][/ROW]
[ROW][C]7[/C][C]95.9[/C][C]96.5737532507584[/C][C]-0.673753250758427[/C][/ROW]
[ROW][C]8[/C][C]104.7[/C][C]104.196787955407[/C][C]0.503212044593087[/C][/ROW]
[ROW][C]9[/C][C]102.8[/C][C]108.178474237808[/C][C]-5.37847423780787[/C][/ROW]
[ROW][C]10[/C][C]98.1[/C][C]100.473797585745[/C][C]-2.37379758574459[/C][/ROW]
[ROW][C]11[/C][C]113.9[/C][C]115.644931966466[/C][C]-1.74493196646551[/C][/ROW]
[ROW][C]12[/C][C]80.9[/C][C]83.020793458457[/C][C]-2.120793458457[/C][/ROW]
[ROW][C]13[/C][C]95.7[/C][C]99.764693471799[/C][C]-4.06469347179901[/C][/ROW]
[ROW][C]14[/C][C]113.2[/C][C]114.959656015626[/C][C]-1.75965601562551[/C][/ROW]
[ROW][C]15[/C][C]105.9[/C][C]107.529209603654[/C][C]-1.62920960365353[/C][/ROW]
[ROW][C]16[/C][C]108.8[/C][C]106.864305152438[/C][C]1.93569484756157[/C][/ROW]
[ROW][C]17[/C][C]102.3[/C][C]100.868848799543[/C][C]1.43115120045669[/C][/ROW]
[ROW][C]18[/C][C]99[/C][C]97.1932594416898[/C][C]1.80674055831024[/C][/ROW]
[ROW][C]19[/C][C]100.7[/C][C]97.485486930256[/C][C]3.21451306974394[/C][/ROW]
[ROW][C]20[/C][C]115.5[/C][C]115.137592109379[/C][C]0.362407890621414[/C][/ROW]
[ROW][C]21[/C][C]100.7[/C][C]98.0665188833795[/C][C]2.63348111662049[/C][/ROW]
[ROW][C]22[/C][C]109.9[/C][C]107.353242621954[/C][C]2.546757378046[/C][/ROW]
[ROW][C]23[/C][C]114.6[/C][C]113.24127044779[/C][C]1.35872955221007[/C][/ROW]
[ROW][C]24[/C][C]85.4[/C][C]83.518102738183[/C][C]1.88189726181702[/C][/ROW]
[ROW][C]25[/C][C]100.5[/C][C]100.096232991616[/C][C]0.403767008383655[/C][/ROW]
[ROW][C]26[/C][C]114.8[/C][C]114.711001375763[/C][C]0.0889986242374845[/C][/ROW]
[ROW][C]27[/C][C]116.5[/C][C]114.408654639863[/C][C]2.09134536013700[/C][/ROW]
[ROW][C]28[/C][C]112.9[/C][C]114.241059468374[/C][C]-1.34105946837387[/C][/ROW]
[ROW][C]29[/C][C]102[/C][C]101.863467358995[/C][C]0.136532641004724[/C][/ROW]
[ROW][C]30[/C][C]106[/C][C]104.238474237808[/C][C]1.76152576219212[/C][/ROW]
[ROW][C]31[/C][C]105.3[/C][C]103.536083166922[/C][C]1.76391683307779[/C][/ROW]
[ROW][C]32[/C][C]118.8[/C][C]117.789908267917[/C][C]1.01009173208283[/C][/ROW]
[ROW][C]33[/C][C]106.1[/C][C]101.299029201598[/C][C]4.80097079840157[/C][/ROW]
[ROW][C]34[/C][C]109.3[/C][C]106.109969422639[/C][C]3.19003057736094[/C][/ROW]
[ROW][C]35[/C][C]117.2[/C][C]114.153004127288[/C][C]3.04699587271244[/C][/ROW]
[ROW][C]36[/C][C]92.5[/C][C]88.8227350552602[/C][C]3.67726494473985[/C][/ROW]
[ROW][C]37[/C][C]104.2[/C][C]103.908937469516[/C][C]0.291062530484445[/C][/ROW]
[ROW][C]38[/C][C]112.5[/C][C]110.649642258000[/C][C]1.85035774199969[/C][/ROW]
[ROW][C]39[/C][C]122.4[/C][C]122.282718235524[/C][C]0.117281764475588[/C][/ROW]
[ROW][C]40[/C][C]113.3[/C][C]111.671628189790[/C][C]1.62837181021038[/C][/ROW]
[ROW][C]41[/C][C]100[/C][C]97.55345360137[/C][C]2.44654639862993[/C][/ROW]
[ROW][C]42[/C][C]110.7[/C][C]110.123300714565[/C][C]0.57669928543464[/C][/ROW]
[ROW][C]43[/C][C]112.8[/C][C]110.249758443223[/C][C]2.55024155677699[/C][/ROW]
[ROW][C]44[/C][C]109.8[/C][C]100.715622997325[/C][C]9.08437700267496[/C][/ROW]
[ROW][C]45[/C][C]117.3[/C][C]115.389458793835[/C][C]1.91054120616534[/C][/ROW]
[ROW][C]46[/C][C]109.1[/C][C]106.192854302593[/C][C]2.90714569740662[/C][/ROW]
[ROW][C]47[/C][C]115.9[/C][C]112.246651888338[/C][C]3.65334811166205[/C][/ROW]
[ROW][C]48[/C][C]96[/C][C]93.6300580926113[/C][C]2.36994190738866[/C][/ROW]
[ROW][C]49[/C][C]99.8[/C][C]94.0456367549502[/C][C]5.7543632450498[/C][/ROW]
[ROW][C]50[/C][C]116.8[/C][C]115.871389695123[/C][C]0.928610304876852[/C][/ROW]
[ROW][C]51[/C][C]115.7[/C][C]113.248266320502[/C][C]2.45173367949763[/C][/ROW]
[ROW][C]52[/C][C]99.4[/C][C]100.730824035818[/C][C]-1.33082403581795[/C][/ROW]
[ROW][C]53[/C][C]94.3[/C][C]96.310180402055[/C][C]-2.01018040205512[/C][/ROW]
[ROW][C]54[/C][C]91[/C][C]96.5301804020551[/C][C]-5.53018040205512[/C][/ROW]
[ROW][C]55[/C][C]93.2[/C][C]100.054918208840[/C][C]-6.8549182088403[/C][/ROW]
[ROW][C]56[/C][C]103.1[/C][C]114.060088669972[/C][C]-10.9600886699723[/C][/ROW]
[ROW][C]57[/C][C]94.1[/C][C]98.0665188833795[/C][C]-3.96651888337952[/C][/ROW]
[ROW][C]58[/C][C]91.8[/C][C]98.070136067069[/C][C]-6.27013606706896[/C][/ROW]
[ROW][C]59[/C][C]102.7[/C][C]109.014141570119[/C][C]-6.31414157011906[/C][/ROW]
[ROW][C]60[/C][C]82.6[/C][C]88.4083106554885[/C][C]-5.80831065548851[/C][/ROW]
[/TABLE]
Source: https://freestatistics.org/blog/index.php?pk=58217&T=4

Globally Unique Identifier (entire table): ba.freestatistics.org/blog/index.php?pk=58217&T=4

As an alternative you can also use a QR Code:  

The GUIDs for individual cells are displayed in the table below:

Multiple Linear Regression - Actuals, Interpolation, and Residuals
Time or IndexActualsInterpolationForecastResidualsPrediction Error
196.899.1844993121189-2.38449931211888
2114.1115.208310655489-1.10831065548852
3110.3113.331151200457-3.03115120045669
4103.9104.792183153580-0.892183153580134
5101.6103.604049838036-2.00404983803623
694.693.21478520388191.38521479611812
795.996.5737532507584-0.673753250758427
8104.7104.1967879554070.503212044593087
9102.8108.178474237808-5.37847423780787
1098.1100.473797585745-2.37379758574459
11113.9115.644931966466-1.74493196646551
1280.983.020793458457-2.120793458457
1395.799.764693471799-4.06469347179901
14113.2114.959656015626-1.75965601562551
15105.9107.529209603654-1.62920960365353
16108.8106.8643051524381.93569484756157
17102.3100.8688487995431.43115120045669
189997.19325944168981.80674055831024
19100.797.4854869302563.21451306974394
20115.5115.1375921093790.362407890621414
21100.798.06651888337952.63348111662049
22109.9107.3532426219542.546757378046
23114.6113.241270447791.35872955221007
2485.483.5181027381831.88189726181702
25100.5100.0962329916160.403767008383655
26114.8114.7110013757630.0889986242374845
27116.5114.4086546398632.09134536013700
28112.9114.241059468374-1.34105946837387
29102101.8634673589950.136532641004724
30106104.2384742378081.76152576219212
31105.3103.5360831669221.76391683307779
32118.8117.7899082679171.01009173208283
33106.1101.2990292015984.80097079840157
34109.3106.1099694226393.19003057736094
35117.2114.1530041272883.04699587271244
3692.588.82273505526023.67726494473985
37104.2103.9089374695160.291062530484445
38112.5110.6496422580001.85035774199969
39122.4122.2827182355240.117281764475588
40113.3111.6716281897901.62837181021038
4110097.553453601372.44654639862993
42110.7110.1233007145650.57669928543464
43112.8110.2497584432232.55024155677699
44109.8100.7156229973259.08437700267496
45117.3115.3894587938351.91054120616534
46109.1106.1928543025932.90714569740662
47115.9112.2466518883383.65334811166205
489693.63005809261132.36994190738866
4999.894.04563675495025.7543632450498
50116.8115.8713896951230.928610304876852
51115.7113.2482663205022.45173367949763
5299.4100.730824035818-1.33082403581795
5394.396.310180402055-2.01018040205512
549196.5301804020551-5.53018040205512
5593.2100.054918208840-6.8549182088403
56103.1114.060088669972-10.9600886699723
5794.198.0665188833795-3.96651888337952
5891.898.070136067069-6.27013606706896
59102.7109.014141570119-6.31414157011906
6082.688.4083106554885-5.80831065548851


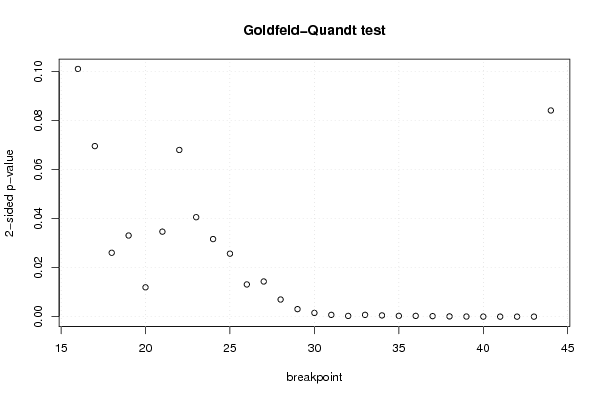
Goldfeld-Quandt test for Heteroskedasticity
p-valuesAlternative Hypothesis
breakpoint indexgreater2-sidedless
160.05053999997940050.1010799999588010.9494600000206
170.03479769983959980.06959539967919960.9652023001604
180.01303499360217210.02606998720434420.986965006397828
190.01655241535702220.03310483071404430.983447584642978
200.005984594020739190.01196918804147840.99401540597926
210.01734448186980100.03468896373960190.9826555181302
220.03401371127416940.06802742254833890.96598628872583
230.02029151425672670.04058302851345350.979708485743273
240.01583290996338640.03166581992677290.984167090036614
250.01285098944142290.02570197888284580.987149010558577
260.006572851718887260.01314570343777450.993427148281113
270.007173854722924070.01434770944584810.992826145277076
280.003494480614730130.006988961229460260.99650551938527
290.001536391838201440.003072783676402890.998463608161799
300.0007666562936442140.001533312587288430.999233343706356
310.0003671859954180080.0007343719908360150.999632814004582
320.000149394040772430.000298788081544860.999850605959228
330.0003656392650739640.0007312785301479290.999634360734926
340.0002547887455958350.000509577491191670.999745211254404
350.0001666751376788270.0003333502753576550.999833324862321
360.0001565433395554510.0003130866791109020.999843456660445
370.00010755808405020.00021511616810040.99989244191595
385.11361248403169e-050.0001022722496806340.99994886387516
392.10439500429032e-054.20879000858065e-050.999978956049957
407.31815082770792e-061.46363016554158e-050.999992681849172
413.27988317841344e-066.55976635682688e-060.999996720116822
421.04301186306898e-062.08602372613796e-060.999998956988137
437.50727420375316e-071.50145484075063e-060.99999924927258
440.04206855035803960.08413710071607920.95793144964196

\begin{tabular}{lllllllll}
\hline
Goldfeld-Quandt test for Heteroskedasticity \tabularnewline
p-values & Alternative Hypothesis \tabularnewline
breakpoint index & greater & 2-sided & less \tabularnewline
16 & 0.0505399999794005 & 0.101079999958801 & 0.9494600000206 \tabularnewline
17 & 0.0347976998395998 & 0.0695953996791996 & 0.9652023001604 \tabularnewline
18 & 0.0130349936021721 & 0.0260699872043442 & 0.986965006397828 \tabularnewline
19 & 0.0165524153570222 & 0.0331048307140443 & 0.983447584642978 \tabularnewline
20 & 0.00598459402073919 & 0.0119691880414784 & 0.99401540597926 \tabularnewline
21 & 0.0173444818698010 & 0.0346889637396019 & 0.9826555181302 \tabularnewline
22 & 0.0340137112741694 & 0.0680274225483389 & 0.96598628872583 \tabularnewline
23 & 0.0202915142567267 & 0.0405830285134535 & 0.979708485743273 \tabularnewline
24 & 0.0158329099633864 & 0.0316658199267729 & 0.984167090036614 \tabularnewline
25 & 0.0128509894414229 & 0.0257019788828458 & 0.987149010558577 \tabularnewline
26 & 0.00657285171888726 & 0.0131457034377745 & 0.993427148281113 \tabularnewline
27 & 0.00717385472292407 & 0.0143477094458481 & 0.992826145277076 \tabularnewline
28 & 0.00349448061473013 & 0.00698896122946026 & 0.99650551938527 \tabularnewline
29 & 0.00153639183820144 & 0.00307278367640289 & 0.998463608161799 \tabularnewline
30 & 0.000766656293644214 & 0.00153331258728843 & 0.999233343706356 \tabularnewline
31 & 0.000367185995418008 & 0.000734371990836015 & 0.999632814004582 \tabularnewline
32 & 0.00014939404077243 & 0.00029878808154486 & 0.999850605959228 \tabularnewline
33 & 0.000365639265073964 & 0.000731278530147929 & 0.999634360734926 \tabularnewline
34 & 0.000254788745595835 & 0.00050957749119167 & 0.999745211254404 \tabularnewline
35 & 0.000166675137678827 & 0.000333350275357655 & 0.999833324862321 \tabularnewline
36 & 0.000156543339555451 & 0.000313086679110902 & 0.999843456660445 \tabularnewline
37 & 0.0001075580840502 & 0.0002151161681004 & 0.99989244191595 \tabularnewline
38 & 5.11361248403169e-05 & 0.000102272249680634 & 0.99994886387516 \tabularnewline
39 & 2.10439500429032e-05 & 4.20879000858065e-05 & 0.999978956049957 \tabularnewline
40 & 7.31815082770792e-06 & 1.46363016554158e-05 & 0.999992681849172 \tabularnewline
41 & 3.27988317841344e-06 & 6.55976635682688e-06 & 0.999996720116822 \tabularnewline
42 & 1.04301186306898e-06 & 2.08602372613796e-06 & 0.999998956988137 \tabularnewline
43 & 7.50727420375316e-07 & 1.50145484075063e-06 & 0.99999924927258 \tabularnewline
44 & 0.0420685503580396 & 0.0841371007160792 & 0.95793144964196 \tabularnewline
\hline
\end{tabular}
%Source: https://freestatistics.org/blog/index.php?pk=58217&T=5

[TABLE]
[ROW][C]Goldfeld-Quandt test for Heteroskedasticity[/C][/ROW]
[ROW][C]p-values[/C][C]Alternative Hypothesis[/C][/ROW]
[ROW][C]breakpoint index[/C][C]greater[/C][C]2-sided[/C][C]less[/C][/ROW]
[ROW][C]16[/C][C]0.0505399999794005[/C][C]0.101079999958801[/C][C]0.9494600000206[/C][/ROW]
[ROW][C]17[/C][C]0.0347976998395998[/C][C]0.0695953996791996[/C][C]0.9652023001604[/C][/ROW]
[ROW][C]18[/C][C]0.0130349936021721[/C][C]0.0260699872043442[/C][C]0.986965006397828[/C][/ROW]
[ROW][C]19[/C][C]0.0165524153570222[/C][C]0.0331048307140443[/C][C]0.983447584642978[/C][/ROW]
[ROW][C]20[/C][C]0.00598459402073919[/C][C]0.0119691880414784[/C][C]0.99401540597926[/C][/ROW]
[ROW][C]21[/C][C]0.0173444818698010[/C][C]0.0346889637396019[/C][C]0.9826555181302[/C][/ROW]
[ROW][C]22[/C][C]0.0340137112741694[/C][C]0.0680274225483389[/C][C]0.96598628872583[/C][/ROW]
[ROW][C]23[/C][C]0.0202915142567267[/C][C]0.0405830285134535[/C][C]0.979708485743273[/C][/ROW]
[ROW][C]24[/C][C]0.0158329099633864[/C][C]0.0316658199267729[/C][C]0.984167090036614[/C][/ROW]
[ROW][C]25[/C][C]0.0128509894414229[/C][C]0.0257019788828458[/C][C]0.987149010558577[/C][/ROW]
[ROW][C]26[/C][C]0.00657285171888726[/C][C]0.0131457034377745[/C][C]0.993427148281113[/C][/ROW]
[ROW][C]27[/C][C]0.00717385472292407[/C][C]0.0143477094458481[/C][C]0.992826145277076[/C][/ROW]
[ROW][C]28[/C][C]0.00349448061473013[/C][C]0.00698896122946026[/C][C]0.99650551938527[/C][/ROW]
[ROW][C]29[/C][C]0.00153639183820144[/C][C]0.00307278367640289[/C][C]0.998463608161799[/C][/ROW]
[ROW][C]30[/C][C]0.000766656293644214[/C][C]0.00153331258728843[/C][C]0.999233343706356[/C][/ROW]
[ROW][C]31[/C][C]0.000367185995418008[/C][C]0.000734371990836015[/C][C]0.999632814004582[/C][/ROW]
[ROW][C]32[/C][C]0.00014939404077243[/C][C]0.00029878808154486[/C][C]0.999850605959228[/C][/ROW]
[ROW][C]33[/C][C]0.000365639265073964[/C][C]0.000731278530147929[/C][C]0.999634360734926[/C][/ROW]
[ROW][C]34[/C][C]0.000254788745595835[/C][C]0.00050957749119167[/C][C]0.999745211254404[/C][/ROW]
[ROW][C]35[/C][C]0.000166675137678827[/C][C]0.000333350275357655[/C][C]0.999833324862321[/C][/ROW]
[ROW][C]36[/C][C]0.000156543339555451[/C][C]0.000313086679110902[/C][C]0.999843456660445[/C][/ROW]
[ROW][C]37[/C][C]0.0001075580840502[/C][C]0.0002151161681004[/C][C]0.99989244191595[/C][/ROW]
[ROW][C]38[/C][C]5.11361248403169e-05[/C][C]0.000102272249680634[/C][C]0.99994886387516[/C][/ROW]
[ROW][C]39[/C][C]2.10439500429032e-05[/C][C]4.20879000858065e-05[/C][C]0.999978956049957[/C][/ROW]
[ROW][C]40[/C][C]7.31815082770792e-06[/C][C]1.46363016554158e-05[/C][C]0.999992681849172[/C][/ROW]
[ROW][C]41[/C][C]3.27988317841344e-06[/C][C]6.55976635682688e-06[/C][C]0.999996720116822[/C][/ROW]
[ROW][C]42[/C][C]1.04301186306898e-06[/C][C]2.08602372613796e-06[/C][C]0.999998956988137[/C][/ROW]
[ROW][C]43[/C][C]7.50727420375316e-07[/C][C]1.50145484075063e-06[/C][C]0.99999924927258[/C][/ROW]
[ROW][C]44[/C][C]0.0420685503580396[/C][C]0.0841371007160792[/C][C]0.95793144964196[/C][/ROW]
[/TABLE]
Source: https://freestatistics.org/blog/index.php?pk=58217&T=5

Globally Unique Identifier (entire table): ba.freestatistics.org/blog/index.php?pk=58217&T=5

As an alternative you can also use a QR Code:  

The GUIDs for individual cells are displayed in the table below:

Goldfeld-Quandt test for Heteroskedasticity
p-valuesAlternative Hypothesis
breakpoint indexgreater2-sidedless
160.05053999997940050.1010799999588010.9494600000206
170.03479769983959980.06959539967919960.9652023001604
180.01303499360217210.02606998720434420.986965006397828
190.01655241535702220.03310483071404430.983447584642978
200.005984594020739190.01196918804147840.99401540597926
210.01734448186980100.03468896373960190.9826555181302
220.03401371127416940.06802742254833890.96598628872583
230.02029151425672670.04058302851345350.979708485743273
240.01583290996338640.03166581992677290.984167090036614
250.01285098944142290.02570197888284580.987149010558577
260.006572851718887260.01314570343777450.993427148281113
270.007173854722924070.01434770944584810.992826145277076
280.003494480614730130.006988961229460260.99650551938527
290.001536391838201440.003072783676402890.998463608161799
300.0007666562936442140.001533312587288430.999233343706356
310.0003671859954180080.0007343719908360150.999632814004582
320.000149394040772430.000298788081544860.999850605959228
330.0003656392650739640.0007312785301479290.999634360734926
340.0002547887455958350.000509577491191670.999745211254404
350.0001666751376788270.0003333502753576550.999833324862321
360.0001565433395554510.0003130866791109020.999843456660445
370.00010755808405020.00021511616810040.99989244191595
385.11361248403169e-050.0001022722496806340.99994886387516
392.10439500429032e-054.20879000858065e-050.999978956049957
407.31815082770792e-061.46363016554158e-050.999992681849172
413.27988317841344e-066.55976635682688e-060.999996720116822
421.04301186306898e-062.08602372613796e-060.999998956988137
437.50727420375316e-071.50145484075063e-060.99999924927258
440.04206855035803960.08413710071607920.95793144964196


Meta Analysis of Goldfeld-Quandt test for Heteroskedasticity
Description# significant tests% significant testsOK/NOK
1% type I error level160.551724137931034NOK
5% type I error level250.862068965517241NOK
10% type I error level280.96551724137931NOK

\begin{tabular}{lllllllll}
\hline
Meta Analysis of Goldfeld-Quandt test for Heteroskedasticity \tabularnewline
Description & # significant tests & % significant tests & OK/NOK \tabularnewline
1% type I error level & 16 & 0.551724137931034 & NOK \tabularnewline
5% type I error level & 25 & 0.862068965517241 & NOK \tabularnewline
10% type I error level & 28 & 0.96551724137931 & NOK \tabularnewline
\hline
\end{tabular}
%Source: https://freestatistics.org/blog/index.php?pk=58217&T=6

[TABLE]
[ROW][C]Meta Analysis of Goldfeld-Quandt test for Heteroskedasticity[/C][/ROW]
[ROW][C]Description[/C][C]# significant tests[/C][C]% significant tests[/C][C]OK/NOK[/C][/ROW]
[ROW][C]1% type I error level[/C][C]16[/C][C]0.551724137931034[/C][C]NOK[/C][/ROW]
[ROW][C]5% type I error level[/C][C]25[/C][C]0.862068965517241[/C][C]NOK[/C][/ROW]
[ROW][C]10% type I error level[/C][C]28[/C][C]0.96551724137931[/C][C]NOK[/C][/ROW]
[/TABLE]
Source: https://freestatistics.org/blog/index.php?pk=58217&T=6

Globally Unique Identifier (entire table): ba.freestatistics.org/blog/index.php?pk=58217&T=6

As an alternative you can also use a QR Code:  

The GUIDs for individual cells are displayed in the table below:

Meta Analysis of Goldfeld-Quandt test for Heteroskedasticity
Description# significant tests% significant testsOK/NOK
1% type I error level160.551724137931034NOK
5% type I error level250.862068965517241NOK
10% type I error level280.96551724137931NOK


Parameters (Session):
par1 = 1 ; par2 = Include Monthly Dummies ; par3 = No Linear Trend ;
Parameters (R input):
par1 = 1 ; par2 = Include Monthly Dummies ; par3 = No Linear Trend ;
R code (references can be found in the software module):
library(lattice)
library(lmtest)
n25 <- 25 #minimum number of obs. for Goldfeld-Quandt test
par1 <- as.numeric(par1)
x <- t(y)
k <- length(x[1,])
n <- length(x[,1])
x1 <- cbind(x[,par1], x[,1:k!=par1])
mycolnames <- c(colnames(x)[par1], colnames(x)[1:k!=par1])
colnames(x1) <- mycolnames #colnames(x)[par1]
x <- x1
if (par3 == 'First Differences'){
x2 <- array(0, dim=c(n-1,k), dimnames=list(1:(n-1), paste('(1-B)',colnames(x),sep='')))
for (i in 1:n-1) {
for (j in 1:k) {
x2[i,j] <- x[i+1,j] - x[i,j]
}
}
x <- x2
}
if (par2 == 'Include Monthly Dummies'){
x2 <- array(0, dim=c(n,11), dimnames=list(1:n, paste('M', seq(1:11), sep ='')))
for (i in 1:11){
x2[seq(i,n,12),i] <- 1
}
x <- cbind(x, x2)
}
if (par2 == 'Include Quarterly Dummies'){
x2 <- array(0, dim=c(n,3), dimnames=list(1:n, paste('Q', seq(1:3), sep ='')))
for (i in 1:3){
x2[seq(i,n,4),i] <- 1
}
x <- cbind(x, x2)
}
k <- length(x[1,])
if (par3 == 'Linear Trend'){
x <- cbind(x, c(1:n))
colnames(x)[k+1] <- 't'
}
x
k <- length(x[1,])
df <- as.data.frame(x)
(mylm <- lm(df))
(mysum <- summary(mylm))
if (n > n25) {
kp3 <- k + 3
nmkm3 <- n - k - 3
gqarr <- array(NA, dim=c(nmkm3-kp3+1,3))
numgqtests <- 0
numsignificant1 <- 0
numsignificant5 <- 0
numsignificant10 <- 0
for (mypoint in kp3:nmkm3) {
j <- 0
numgqtests <- numgqtests + 1
for (myalt in c('greater', 'two.sided', 'less')) {
j <- j + 1
gqarr[mypoint-kp3+1,j] <- gqtest(mylm, point=mypoint, alternative=myalt)$p.value
}
if (gqarr[mypoint-kp3+1,2] < 0.01) numsignificant1 <- numsignificant1 + 1
if (gqarr[mypoint-kp3+1,2] < 0.05) numsignificant5 <- numsignificant5 + 1
if (gqarr[mypoint-kp3+1,2] < 0.10) numsignificant10 <- numsignificant10 + 1
}
gqarr
}
bitmap(file='test0.png')
plot(x[,1], type='l', main='Actuals and Interpolation', ylab='value of Actuals and Interpolation (dots)', xlab='time or index')
points(x[,1]-mysum$resid)
grid()
dev.off()
bitmap(file='test1.png')
plot(mysum$resid, type='b', pch=19, main='Residuals', ylab='value of Residuals', xlab='time or index')
grid()
dev.off()
bitmap(file='test2.png')
hist(mysum$resid, main='Residual Histogram', xlab='values of Residuals')
grid()
dev.off()
bitmap(file='test3.png')
densityplot(~mysum$resid,col='black',main='Residual Density Plot', xlab='values of Residuals')
dev.off()
bitmap(file='test4.png')
qqnorm(mysum$resid, main='Residual Normal Q-Q Plot')
qqline(mysum$resid)
grid()
dev.off()
(myerror <- as.ts(mysum$resid))
bitmap(file='test5.png')
dum <- cbind(lag(myerror,k=1),myerror)
dum
dum1 <- dum[2:length(myerror),]
dum1
z <- as.data.frame(dum1)
z
plot(z,main=paste('Residual Lag plot, lowess, and regression line'), ylab='values of Residuals', xlab='lagged values of Residuals')
lines(lowess(z))
abline(lm(z))
grid()
dev.off()
bitmap(file='test6.png')
acf(mysum$resid, lag.max=length(mysum$resid)/2, main='Residual Autocorrelation Function')
grid()
dev.off()
bitmap(file='test7.png')
pacf(mysum$resid, lag.max=length(mysum$resid)/2, main='Residual Partial Autocorrelation Function')
grid()
dev.off()
bitmap(file='test8.png')
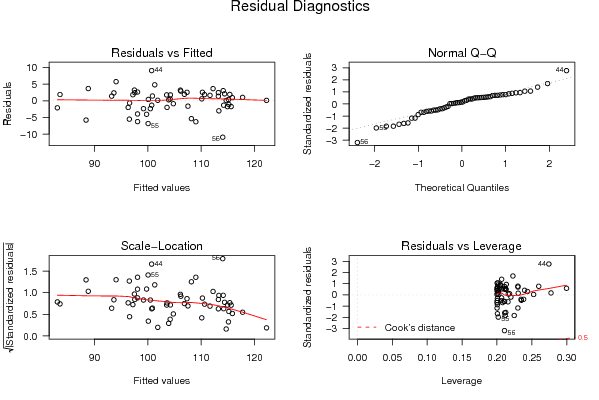
opar <- par(mfrow = c(2,2), oma = c(0, 0, 1.1, 0))
plot(mylm, las = 1, sub='Residual Diagnostics')
par(opar)
dev.off()
if (n > n25) {
bitmap(file='test9.png')
plot(kp3:nmkm3,gqarr[,2], main='Goldfeld-Quandt test',ylab='2-sided p-value',xlab='breakpoint')
grid()
dev.off()
}
load(file='createtable')
a<-table.start()
a<-table.row.start(a)
a<-table.element(a, 'Multiple Linear Regression - Estimated Regression Equation', 1, TRUE)
a<-table.row.end(a)
myeq <- colnames(x)[1]
myeq <- paste(myeq, '[t] = ', sep='')
for (i in 1:k){
if (mysum$coefficients[i,1] > 0) myeq <- paste(myeq, '+', '')
myeq <- paste(myeq, mysum$coefficients[i,1], sep=' ')
if (rownames(mysum$coefficients)[i] != '(Intercept)') {
myeq <- paste(myeq, rownames(mysum$coefficients)[i], sep='')
if (rownames(mysum$coefficients)[i] != 't') myeq <- paste(myeq, '[t]', sep='')
}
}
myeq <- paste(myeq, ' + e[t]')
a<-table.row.start(a)
a<-table.element(a, myeq)
a<-table.row.end(a)
a<-table.end(a)
table.save(a,file='mytable1.tab')
a<-table.start()
a<-table.row.start(a)
a<-table.element(a,hyperlink('ols1.htm','Multiple Linear Regression - Ordinary Least Squares',''), 6, TRUE)
a<-table.row.end(a)
a<-table.row.start(a)
a<-table.element(a,'Variable',header=TRUE)
a<-table.element(a,'Parameter',header=TRUE)
a<-table.element(a,'S.D.',header=TRUE)
a<-table.element(a,'T-STAT
H0: parameter = 0',header=TRUE)
a<-table.element(a,'2-tail p-value',header=TRUE)
a<-table.element(a,'1-tail p-value',header=TRUE)
a<-table.row.end(a)
for (i in 1:k){
a<-table.row.start(a)
a<-table.element(a,rownames(mysum$coefficients)[i],header=TRUE)
a<-table.element(a,mysum$coefficients[i,1])
a<-table.element(a, round(mysum$coefficients[i,2],6))
a<-table.element(a, round(mysum$coefficients[i,3],4))
a<-table.element(a, round(mysum$coefficients[i,4],6))
a<-table.element(a, round(mysum$coefficients[i,4]/2,6))
a<-table.row.end(a)
}
a<-table.end(a)
table.save(a,file='mytable2.tab')
a<-table.start()
a<-table.row.start(a)
a<-table.element(a, 'Multiple Linear Regression - Regression Statistics', 2, TRUE)
a<-table.row.end(a)
a<-table.row.start(a)
a<-table.element(a, 'Multiple R',1,TRUE)
a<-table.element(a, sqrt(mysum$r.squared))
a<-table.row.end(a)
a<-table.row.start(a)
a<-table.element(a, 'R-squared',1,TRUE)
a<-table.element(a, mysum$r.squared)
a<-table.row.end(a)
a<-table.row.start(a)
a<-table.element(a, 'Adjusted R-squared',1,TRUE)
a<-table.element(a, mysum$adj.r.squared)
a<-table.row.end(a)
a<-table.row.start(a)
a<-table.element(a, 'F-TEST (value)',1,TRUE)
a<-table.element(a, mysum$fstatistic[1])
a<-table.row.end(a)
a<-table.row.start(a)
a<-table.element(a, 'F-TEST (DF numerator)',1,TRUE)
a<-table.element(a, mysum$fstatistic[2])
a<-table.row.end(a)
a<-table.row.start(a)
a<-table.element(a, 'F-TEST (DF denominator)',1,TRUE)
a<-table.element(a, mysum$fstatistic[3])
a<-table.row.end(a)
a<-table.row.start(a)
a<-table.element(a, 'p-value',1,TRUE)
a<-table.element(a, 1-pf(mysum$fstatistic[1],mysum$fstatistic[2],mysum$fstatistic[3]))
a<-table.row.end(a)
a<-table.row.start(a)
a<-table.element(a, 'Multiple Linear Regression - Residual Statistics', 2, TRUE)
a<-table.row.end(a)
a<-table.row.start(a)
a<-table.element(a, 'Residual Standard Deviation',1,TRUE)
a<-table.element(a, mysum$sigma)
a<-table.row.end(a)
a<-table.row.start(a)
a<-table.element(a, 'Sum Squared Residuals',1,TRUE)
a<-table.element(a, sum(myerror*myerror))
a<-table.row.end(a)
a<-table.end(a)
table.save(a,file='mytable3.tab')
a<-table.start()
a<-table.row.start(a)
a<-table.element(a, 'Multiple Linear Regression - Actuals, Interpolation, and Residuals', 4, TRUE)
a<-table.row.end(a)
a<-table.row.start(a)
a<-table.element(a, 'Time or Index', 1, TRUE)
a<-table.element(a, 'Actuals', 1, TRUE)
a<-table.element(a, 'Interpolation
Forecast', 1, TRUE)
a<-table.element(a, 'Residuals
Prediction Error', 1, TRUE)
a<-table.row.end(a)
for (i in 1:n) {
a<-table.row.start(a)
a<-table.element(a,i, 1, TRUE)
a<-table.element(a,x[i])
a<-table.element(a,x[i]-mysum$resid[i])
a<-table.element(a,mysum$resid[i])
a<-table.row.end(a)
}
a<-table.end(a)
table.save(a,file='mytable4.tab')
if (n > n25) {
a<-table.start()
a<-table.row.start(a)
a<-table.element(a,'Goldfeld-Quandt test for Heteroskedasticity',4,TRUE)
a<-table.row.end(a)
a<-table.row.start(a)
a<-table.element(a,'p-values',header=TRUE)
a<-table.element(a,'Alternative Hypothesis',3,header=TRUE)
a<-table.row.end(a)
a<-table.row.start(a)
a<-table.element(a,'breakpoint index',header=TRUE)
a<-table.element(a,'greater',header=TRUE)
a<-table.element(a,'2-sided',header=TRUE)
a<-table.element(a,'less',header=TRUE)
a<-table.row.end(a)
for (mypoint in kp3:nmkm3) {
a<-table.row.start(a)
a<-table.element(a,mypoint,header=TRUE)
a<-table.element(a,gqarr[mypoint-kp3+1,1])
a<-table.element(a,gqarr[mypoint-kp3+1,2])
a<-table.element(a,gqarr[mypoint-kp3+1,3])
a<-table.row.end(a)
}
a<-table.end(a)
table.save(a,file='mytable5.tab')
a<-table.start()
a<-table.row.start(a)
a<-table.element(a,'Meta Analysis of Goldfeld-Quandt test for Heteroskedasticity',4,TRUE)
a<-table.row.end(a)
a<-table.row.start(a)
a<-table.element(a,'Description',header=TRUE)
a<-table.element(a,'# significant tests',header=TRUE)
a<-table.element(a,'% significant tests',header=TRUE)
a<-table.element(a,'OK/NOK',header=TRUE)
a<-table.row.end(a)
a<-table.row.start(a)
a<-table.element(a,'1% type I error level',header=TRUE)
a<-table.element(a,numsignificant1)
a<-table.element(a,numsignificant1/numgqtests)
if (numsignificant1/numgqtests < 0.01) dum <- 'OK' else dum <- 'NOK'
a<-table.element(a,dum)
a<-table.row.end(a)
a<-table.row.start(a)
a<-table.element(a,'5% type I error level',header=TRUE)
a<-table.element(a,numsignificant5)
a<-table.element(a,numsignificant5/numgqtests)
if (numsignificant5/numgqtests < 0.05) dum <- 'OK' else dum <- 'NOK'
a<-table.element(a,dum)
a<-table.row.end(a)
a<-table.row.start(a)
a<-table.element(a,'10% type I error level',header=TRUE)
a<-table.element(a,numsignificant10)
a<-table.element(a,numsignificant10/numgqtests)
if (numsignificant10/numgqtests < 0.1) dum <- 'OK' else dum <- 'NOK'
a<-table.element(a,dum)
a<-table.row.end(a)
a<-table.end(a)
table.save(a,file='mytable6.tab')
}