| Multiple Linear Regression - Estimated Regression Equation |
| Totind[t] = + 46.4685613985971 + 0.828848799543308Bouw[t] -24.2841155640517M1[t] -20.5272664539229M2[t] -18.9232609508728M3[t] -17.1845038834123M4[t] -9.00664576411686M5[t] -12.8480048818791M6[t] -18.6063736299789M7[t] -16.9510502820422M8[t] -21.7551612748004M9[t] -21.1713499314306M10[t] -21.0023788224435M11[t] + e[t] |
| Multiple Linear Regression - Ordinary Least Squares | |||||
| Variable | Parameter | S.D. | T-STAT H0: parameter = 0 | 2-tail p-value | 1-tail p-value |
| (Intercept) | 46.4685613985971 | 4.78929 | 9.7026 | 0 | 0 |
| Bouw | 0.828848799543308 | 0.090283 | 9.1805 | 0 | 0 |
| M1 | -24.2841155640517 | 4.638361 | -5.2355 | 4e-06 | 2e-06 |
| M2 | -20.5272664539229 | 5.704246 | -3.5986 | 0.000767 | 0.000384 |
| M3 | -18.9232609508728 | 5.535117 | -3.4188 | 0.001309 | 0.000655 |
| M4 | -17.1845038834123 | 4.746291 | -3.6206 | 0.000718 | 0.000359 |
| M5 | -9.00664576411686 | 3.3884 | -2.6581 | 0.010707 | 0.005353 |
| M6 | -12.8480048818791 | 3.708833 | -3.4642 | 0.001145 | 0.000573 |
| M7 | -18.6063736299789 | 4.319096 | -4.3079 | 8.3e-05 | 4.2e-05 |
| M8 | -16.9510502820422 | 4.980495 | -3.4035 | 0.001369 | 0.000685 |
| M9 | -21.7551612748004 | 4.85043 | -4.4852 | 4.7e-05 | 2.3e-05 |
| M10 | -21.1713499314306 | 4.743194 | -4.4635 | 5e-05 | 2.5e-05 |
| M11 | -21.0023788224435 | 5.611403 | -3.7428 | 0.000495 | 0.000248 |
| Multiple Linear Regression - Regression Statistics | |
| Multiple R | 0.931388917304204 |
| R-squared | 0.867485315277098 |
| Adjusted R-squared | 0.833651778752102 |
| F-TEST (value) | 25.6398060733674 |
| F-TEST (DF numerator) | 12 |
| F-TEST (DF denominator) | 47 |
| p-value | 1.11022302462516e-16 |
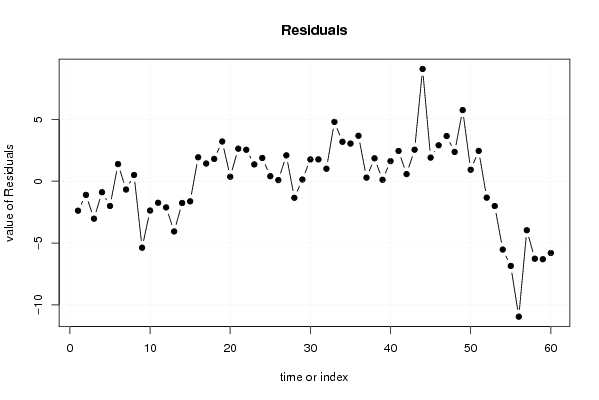
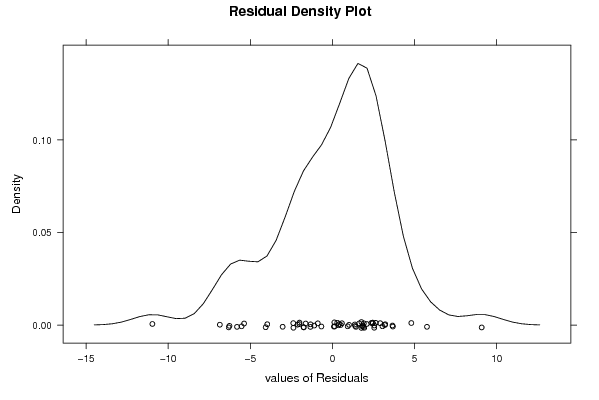
| Multiple Linear Regression - Residual Statistics | |
| Residual Standard Deviation | 3.86091525901995 |
| Sum Squared Residuals | 700.613331954655 |
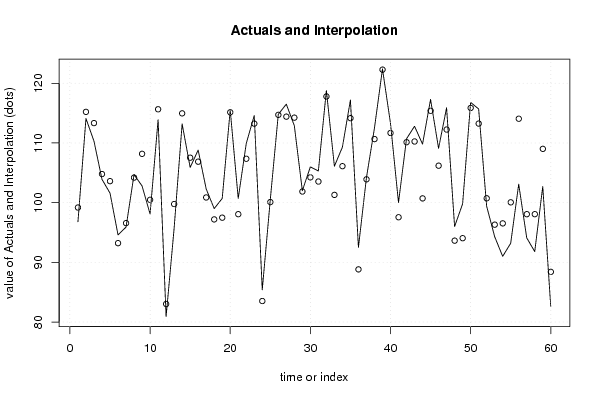
| Multiple Linear Regression - Actuals, Interpolation, and Residuals | |||
| Time or Index | Actuals | Interpolation Forecast | Residuals Prediction Error |
| 1 | 96.8 | 99.1844993121189 | -2.38449931211888 |
| 2 | 114.1 | 115.208310655489 | -1.10831065548852 |
| 3 | 110.3 | 113.331151200457 | -3.03115120045669 |
| 4 | 103.9 | 104.792183153580 | -0.892183153580134 |
| 5 | 101.6 | 103.604049838036 | -2.00404983803623 |
| 6 | 94.6 | 93.2147852038819 | 1.38521479611812 |
| 7 | 95.9 | 96.5737532507584 | -0.673753250758427 |
| 8 | 104.7 | 104.196787955407 | 0.503212044593087 |
| 9 | 102.8 | 108.178474237808 | -5.37847423780787 |
| 10 | 98.1 | 100.473797585745 | -2.37379758574459 |
| 11 | 113.9 | 115.644931966466 | -1.74493196646551 |
| 12 | 80.9 | 83.020793458457 | -2.120793458457 |
| 13 | 95.7 | 99.764693471799 | -4.06469347179901 |
| 14 | 113.2 | 114.959656015626 | -1.75965601562551 |
| 15 | 105.9 | 107.529209603654 | -1.62920960365353 |
| 16 | 108.8 | 106.864305152438 | 1.93569484756157 |
| 17 | 102.3 | 100.868848799543 | 1.43115120045669 |
| 18 | 99 | 97.1932594416898 | 1.80674055831024 |
| 19 | 100.7 | 97.485486930256 | 3.21451306974394 |
| 20 | 115.5 | 115.137592109379 | 0.362407890621414 |
| 21 | 100.7 | 98.0665188833795 | 2.63348111662049 |
| 22 | 109.9 | 107.353242621954 | 2.546757378046 |
| 23 | 114.6 | 113.24127044779 | 1.35872955221007 |
| 24 | 85.4 | 83.518102738183 | 1.88189726181702 |
| 25 | 100.5 | 100.096232991616 | 0.403767008383655 |
| 26 | 114.8 | 114.711001375763 | 0.0889986242374845 |
| 27 | 116.5 | 114.408654639863 | 2.09134536013700 |
| 28 | 112.9 | 114.241059468374 | -1.34105946837387 |
| 29 | 102 | 101.863467358995 | 0.136532641004724 |
| 30 | 106 | 104.238474237808 | 1.76152576219212 |
| 31 | 105.3 | 103.536083166922 | 1.76391683307779 |
| 32 | 118.8 | 117.789908267917 | 1.01009173208283 |
| 33 | 106.1 | 101.299029201598 | 4.80097079840157 |
| 34 | 109.3 | 106.109969422639 | 3.19003057736094 |
| 35 | 117.2 | 114.153004127288 | 3.04699587271244 |
| 36 | 92.5 | 88.8227350552602 | 3.67726494473985 |
| 37 | 104.2 | 103.908937469516 | 0.291062530484445 |
| 38 | 112.5 | 110.649642258000 | 1.85035774199969 |
| 39 | 122.4 | 122.282718235524 | 0.117281764475588 |
| 40 | 113.3 | 111.671628189790 | 1.62837181021038 |
| 41 | 100 | 97.55345360137 | 2.44654639862993 |
| 42 | 110.7 | 110.123300714565 | 0.57669928543464 |
| 43 | 112.8 | 110.249758443223 | 2.55024155677699 |
| 44 | 109.8 | 100.715622997325 | 9.08437700267496 |
| 45 | 117.3 | 115.389458793835 | 1.91054120616534 |
| 46 | 109.1 | 106.192854302593 | 2.90714569740662 |
| 47 | 115.9 | 112.246651888338 | 3.65334811166205 |
| 48 | 96 | 93.6300580926113 | 2.36994190738866 |
| 49 | 99.8 | 94.0456367549502 | 5.7543632450498 |
| 50 | 116.8 | 115.871389695123 | 0.928610304876852 |
| 51 | 115.7 | 113.248266320502 | 2.45173367949763 |
| 52 | 99.4 | 100.730824035818 | -1.33082403581795 |
| 53 | 94.3 | 96.310180402055 | -2.01018040205512 |
| 54 | 91 | 96.5301804020551 | -5.53018040205512 |
| 55 | 93.2 | 100.054918208840 | -6.8549182088403 |
| 56 | 103.1 | 114.060088669972 | -10.9600886699723 |
| 57 | 94.1 | 98.0665188833795 | -3.96651888337952 |
| 58 | 91.8 | 98.070136067069 | -6.27013606706896 |
| 59 | 102.7 | 109.014141570119 | -6.31414157011906 |
| 60 | 82.6 | 88.4083106554885 | -5.80831065548851 |
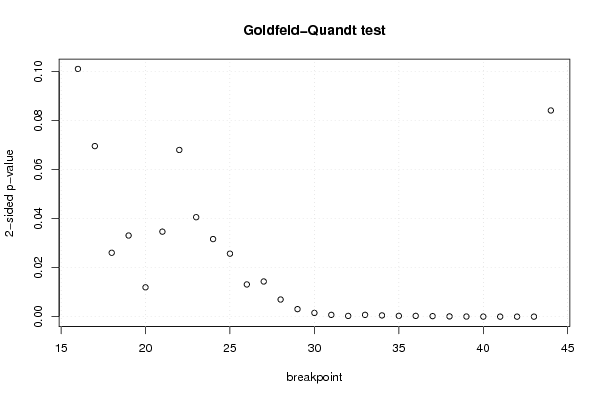
| Goldfeld-Quandt test for Heteroskedasticity | |||
| p-values | Alternative Hypothesis | ||
| breakpoint index | greater | 2-sided | less |
| 16 | 0.0505399999794005 | 0.101079999958801 | 0.9494600000206 |
| 17 | 0.0347976998395998 | 0.0695953996791996 | 0.9652023001604 |
| 18 | 0.0130349936021721 | 0.0260699872043442 | 0.986965006397828 |
| 19 | 0.0165524153570222 | 0.0331048307140443 | 0.983447584642978 |
| 20 | 0.00598459402073919 | 0.0119691880414784 | 0.99401540597926 |
| 21 | 0.0173444818698010 | 0.0346889637396019 | 0.9826555181302 |
| 22 | 0.0340137112741694 | 0.0680274225483389 | 0.96598628872583 |
| 23 | 0.0202915142567267 | 0.0405830285134535 | 0.979708485743273 |
| 24 | 0.0158329099633864 | 0.0316658199267729 | 0.984167090036614 |
| 25 | 0.0128509894414229 | 0.0257019788828458 | 0.987149010558577 |
| 26 | 0.00657285171888726 | 0.0131457034377745 | 0.993427148281113 |
| 27 | 0.00717385472292407 | 0.0143477094458481 | 0.992826145277076 |
| 28 | 0.00349448061473013 | 0.00698896122946026 | 0.99650551938527 |
| 29 | 0.00153639183820144 | 0.00307278367640289 | 0.998463608161799 |
| 30 | 0.000766656293644214 | 0.00153331258728843 | 0.999233343706356 |
| 31 | 0.000367185995418008 | 0.000734371990836015 | 0.999632814004582 |
| 32 | 0.00014939404077243 | 0.00029878808154486 | 0.999850605959228 |
| 33 | 0.000365639265073964 | 0.000731278530147929 | 0.999634360734926 |
| 34 | 0.000254788745595835 | 0.00050957749119167 | 0.999745211254404 |
| 35 | 0.000166675137678827 | 0.000333350275357655 | 0.999833324862321 |
| 36 | 0.000156543339555451 | 0.000313086679110902 | 0.999843456660445 |
| 37 | 0.0001075580840502 | 0.0002151161681004 | 0.99989244191595 |
| 38 | 5.11361248403169e-05 | 0.000102272249680634 | 0.99994886387516 |
| 39 | 2.10439500429032e-05 | 4.20879000858065e-05 | 0.999978956049957 |
| 40 | 7.31815082770792e-06 | 1.46363016554158e-05 | 0.999992681849172 |
| 41 | 3.27988317841344e-06 | 6.55976635682688e-06 | 0.999996720116822 |
| 42 | 1.04301186306898e-06 | 2.08602372613796e-06 | 0.999998956988137 |
| 43 | 7.50727420375316e-07 | 1.50145484075063e-06 | 0.99999924927258 |
| 44 | 0.0420685503580396 | 0.0841371007160792 | 0.95793144964196 |
| Meta Analysis of Goldfeld-Quandt test for Heteroskedasticity | |||
| Description | # significant tests | % significant tests | OK/NOK |
| 1% type I error level | 16 | 0.551724137931034 | NOK |
| 5% type I error level | 25 | 0.862068965517241 | NOK |
| 10% type I error level | 28 | 0.96551724137931 | NOK |