| Multiple Linear Regression - Estimated Regression Equation |
| Y[t] = + 1.85422779475554 + 0.000604826557932779X[t] + 0.574485001754852Y1[t] + 0.391886275032236Y2[t] -0.0635822312445514Y3[t] -0.00547461318830385Y4[t] -0.301760548071200M1[t] -0.417100597659018M2[t] -1.99878180986883M3[t] + 0.351604644101707M4[t] + 0.316273377056073M5[t] -0.606367151252546M6[t] -1.53548312063179M7[t] -0.388501259503871M8[t] + 0.560018451568021M9[t] + 1.32513484904000M10[t] -0.155911104604277M11[t] -0.0496906557819444t + e[t] |
| Multiple Linear Regression - Ordinary Least Squares | |||||
| Variable | Parameter | S.D. | T-STAT H0: parameter = 0 | 2-tail p-value | 1-tail p-value |
| (Intercept) | 1.85422779475554 | 5.074053 | 0.3654 | 0.716763 | 0.358381 |
| X | 0.000604826557932779 | 0.001756 | 0.3444 | 0.732365 | 0.366183 |
| Y1 | 0.574485001754852 | 0.164087 | 3.5011 | 0.001177 | 0.000588 |
| Y2 | 0.391886275032236 | 0.18973 | 2.0655 | 0.045567 | 0.022784 |
| Y3 | -0.0635822312445514 | 0.19297 | -0.3295 | 0.743546 | 0.371773 |
| Y4 | -0.00547461318830385 | 0.167352 | -0.0327 | 0.97407 | 0.487035 |
| M1 | -0.301760548071200 | 2.062045 | -0.1463 | 0.884406 | 0.442203 |
| M2 | -0.417100597659018 | 2.100274 | -0.1986 | 0.843612 | 0.421806 |
| M3 | -1.99878180986883 | 2.043168 | -0.9783 | 0.333968 | 0.166984 |
| M4 | 0.351604644101707 | 2.110233 | 0.1666 | 0.868531 | 0.434265 |
| M5 | 0.316273377056073 | 2.112733 | 0.1497 | 0.881774 | 0.440887 |
| M6 | -0.606367151252546 | 2.127673 | -0.285 | 0.777159 | 0.38858 |
| M7 | -1.53548312063179 | 2.048291 | -0.7496 | 0.457969 | 0.228985 |
| M8 | -0.388501259503871 | 2.079945 | -0.1868 | 0.852798 | 0.426399 |
| M9 | 0.560018451568021 | 2.211955 | 0.2532 | 0.80146 | 0.40073 |
| M10 | 1.32513484904000 | 2.213938 | 0.5985 | 0.552939 | 0.27647 |
| M11 | -0.155911104604277 | 2.17245 | -0.0718 | 0.943154 | 0.471577 |
| t | -0.0496906557819444 | 0.034665 | -1.4335 | 0.159695 | 0.079848 |
| Multiple Linear Regression - Regression Statistics | |
| Multiple R | 0.933057841963762 |
| R-squared | 0.870596936450073 |
| Adjusted R-squared | 0.814190472851387 |
| F-TEST (value) | 15.4343470749043 |
| F-TEST (DF numerator) | 17 |
| F-TEST (DF denominator) | 39 |
| p-value | 2.58504329053721e-12 |
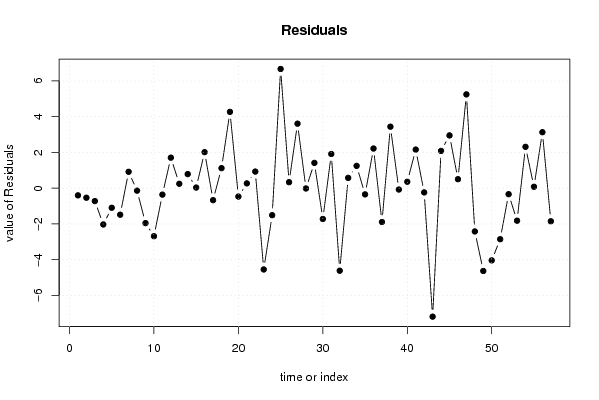
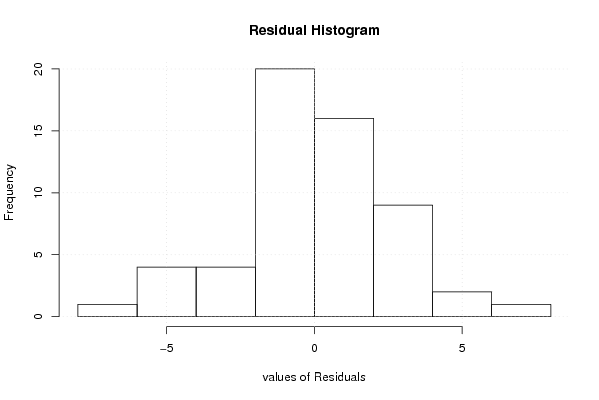
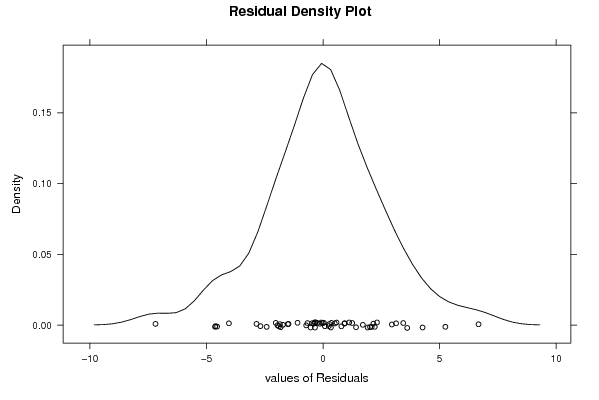
| Multiple Linear Regression - Residual Statistics | |
| Residual Standard Deviation | 3.00902986975080 |
| Sum Squared Residuals | 353.116169525049 |
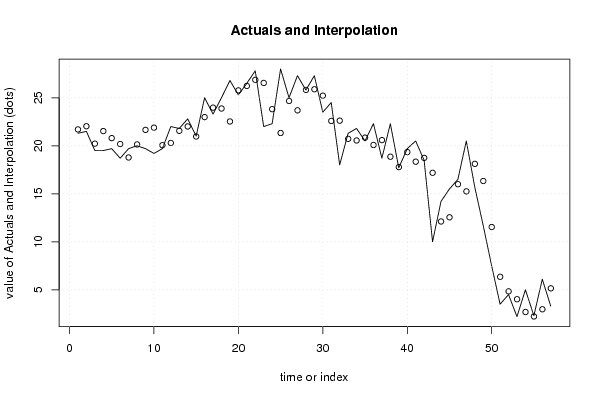
| Multiple Linear Regression - Actuals, Interpolation, and Residuals | |||
| Time or Index | Actuals | Interpolation Forecast | Residuals Prediction Error |
| 1 | 21.3 | 21.7000125084072 | -0.40001250840724 |
| 2 | 21.5 | 22.0318591711779 | -0.531859171177916 |
| 3 | 19.5 | 20.2201993642450 | -0.720199364244964 |
| 4 | 19.5 | 21.5283421910563 | -2.02834219105626 |
| 5 | 19.7 | 20.7935172992975 | -1.09351729929745 |
| 6 | 18.7 | 20.1813034873221 | -1.48130348732206 |
| 7 | 19.7 | 18.7802403038141 | 0.919759696185918 |
| 8 | 20 | 20.1363232936499 | -0.136323293649880 |
| 9 | 19.7 | 21.6521942081785 | -1.95219420817849 |
| 10 | 19.2 | 21.8845788603406 | -2.68457886034063 |
| 11 | 19.7 | 20.0587560808267 | -0.358756080826719 |
| 12 | 22 | 20.2918529751652 | 1.70814702483478 |
| 13 | 21.8 | 21.5509717416785 | 0.249028258321539 |
| 14 | 22.8 | 22.0108716433165 | 0.789128356683531 |
| 15 | 21 | 20.9637230943261 | 0.0362769056738507 |
| 16 | 25 | 22.9840432819479 | 2.01595671805215 |
| 17 | 23.3 | 23.96820092533 | -0.66820092532999 |
| 18 | 25 | 23.8790261884906 | 1.12097381150936 |
| 19 | 26.8 | 22.5300828292491 | 4.26991717075089 |
| 20 | 25.3 | 25.7670637555039 | -0.467063755503882 |
| 21 | 26.5 | 26.23053933826 | 0.269460661740011 |
| 22 | 27.8 | 26.8693284206332 | 0.930671579366772 |
| 23 | 22 | 26.5438278108277 | -4.54382781082771 |
| 24 | 22.3 | 23.8102060801691 | -1.51020608016915 |
| 25 | 28 | 21.3294162010049 | 6.67058379899511 |
| 26 | 25 | 24.6629390247734 | 0.337060975226573 |
| 27 | 27.3 | 23.6894183287387 | 3.61058167126133 |
| 28 | 25.8 | 25.8146523894295 | -0.0146523894294990 |
| 29 | 27.3 | 25.8834208032592 | 1.41657919674085 |
| 30 | 23.5 | 25.2196852407127 | -1.71968524071267 |
| 31 | 24.5 | 22.5851028637351 | 1.91489713626494 |
| 32 | 18 | 22.6140188772564 | -4.61401887725641 |
| 33 | 21.3 | 20.7209113714757 | 0.579088628524328 |
| 34 | 21.8 | 20.5503681112535 | 1.24963188874650 |
| 35 | 20.5 | 20.8452102561284 | -0.345210256128447 |
| 36 | 22.3 | 20.0805437623407 | 2.21945623765926 |
| 37 | 18.7 | 20.5903402354798 | -1.89034023547980 |
| 38 | 22.3 | 18.8588147572039 | 3.44118524279612 |
| 39 | 17.7 | 17.7744431535285 | -0.0744431535284873 |
| 40 | 19.7 | 19.3387459994775 | 0.36125400052248 |
| 41 | 20.5 | 18.3388147060266 | 2.16118529397335 |
| 42 | 18.5 | 18.7350360495159 | -0.235036049515885 |
| 43 | 10 | 17.1841024400393 | -7.18410244003927 |
| 44 | 14.2 | 12.1147891410890 | 2.08521085891104 |
| 45 | 15.5 | 12.5478371119871 | 2.95216288801290 |
| 46 | 16.5 | 15.9957246077727 | 0.504275392227346 |
| 47 | 20.5 | 15.2522058522171 | 5.24779414778287 |
| 48 | 15.7 | 18.1173971823249 | -2.41739718232489 |
| 49 | 11.7 | 16.3292593134296 | -4.62925931342961 |
| 50 | 7.5 | 11.5355154035283 | -4.03551540352831 |
| 51 | 3.5 | 6.35221605916173 | -2.85221605916173 |
| 52 | 4.5 | 4.83421613808886 | -0.334216138088863 |
| 53 | 2.2 | 4.01604626608676 | -1.81604626608676 |
| 54 | 5 | 2.68494903395874 | 2.31505096604126 |
| 55 | 2.3 | 2.22047156316247 | 0.0795284368375297 |
| 56 | 6.1 | 2.96780493250087 | 3.13219506749913 |
| 57 | 3.3 | 5.14851797009875 | -1.84851797009875 |
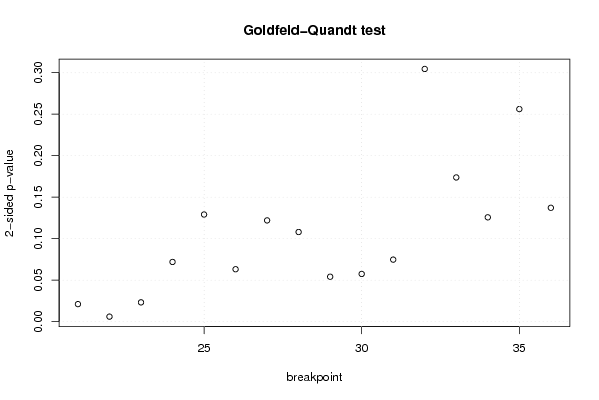
| Goldfeld-Quandt test for Heteroskedasticity | |||
| p-values | Alternative Hypothesis | ||
| breakpoint index | greater | 2-sided | less |
| 21 | 0.0105736376674834 | 0.0211472753349668 | 0.989426362332517 |
| 22 | 0.00301165343483557 | 0.00602330686967114 | 0.996988346565164 |
| 23 | 0.0116265171047791 | 0.0232530342095582 | 0.98837348289522 |
| 24 | 0.0359694330151446 | 0.0719388660302892 | 0.964030566984855 |
| 25 | 0.0645538612947193 | 0.129107722589439 | 0.93544613870528 |
| 26 | 0.0315829065062475 | 0.063165813012495 | 0.968417093493752 |
| 27 | 0.0610109095244062 | 0.122021819048812 | 0.938989090475594 |
| 28 | 0.0540065834548045 | 0.108013166909609 | 0.945993416545196 |
| 29 | 0.0270567800696462 | 0.0541135601392925 | 0.972943219930354 |
| 30 | 0.0287471065754386 | 0.0574942131508773 | 0.971252893424561 |
| 31 | 0.0373702178206093 | 0.0747404356412185 | 0.96262978217939 |
| 32 | 0.152253197687707 | 0.304506395375414 | 0.847746802312293 |
| 33 | 0.0868788412302134 | 0.173757682460427 | 0.913121158769787 |
| 34 | 0.0628568305536573 | 0.125713661107315 | 0.937143169446343 |
| 35 | 0.128070571889005 | 0.256141143778011 | 0.871929428110995 |
| 36 | 0.0685925491387563 | 0.137185098277513 | 0.931407450861244 |
| Meta Analysis of Goldfeld-Quandt test for Heteroskedasticity | |||
| Description | # significant tests | % significant tests | OK/NOK |
| 1% type I error level | 1 | 0.0625 | NOK |
| 5% type I error level | 3 | 0.1875 | NOK |
| 10% type I error level | 8 | 0.5 | NOK |