| Multiple Linear Regression - Estimated Regression Equation |
| Invoer/inflatie[t] = + 609.166987055855 + 19553.7411763901`Uitvoer/inflatie`[t] -4968.06824936545Inflatie[t] -2293.74599688658M1[t] + 748.788773984817M2[t] + 652.42614918149M3[t] + 14.0241082018048M4[t] -1315.63792759216M5[t] -758.668421233577M6[t] -519.441502684909M7[t] + 555.88998307813M8[t] -60.2757250744329M9[t] -187.771360832577M10[t] + 399.126243757439M11[t] + e[t] |
| Multiple Linear Regression - Ordinary Least Squares | |||||
| Variable | Parameter | S.D. | T-STAT H0: parameter = 0 | 2-tail p-value | 1-tail p-value |
| (Intercept) | 609.166987055855 | 6142.514804 | 0.0992 | 0.921432 | 0.460716 |
| `Uitvoer/inflatie` | 19553.7411763901 | 7059.010671 | 2.77 | 0.008057 | 0.004029 |
| Inflatie | -4968.06824936545 | 446.032479 | -11.1384 | 0 | 0 |
| M1 | -2293.74599688658 | 930.868751 | -2.4641 | 0.017534 | 0.008767 |
| M2 | 748.788773984817 | 703.424032 | 1.0645 | 0.292662 | 0.146331 |
| M3 | 652.42614918149 | 708.092117 | 0.9214 | 0.361656 | 0.180828 |
| M4 | 14.0241082018048 | 778.837815 | 0.018 | 0.985712 | 0.492856 |
| M5 | -1315.63792759216 | 958.077895 | -1.3732 | 0.176345 | 0.088173 |
| M6 | -758.668421233577 | 872.449772 | -0.8696 | 0.389043 | 0.194521 |
| M7 | -519.441502684909 | 737.90079 | -0.7039 | 0.485015 | 0.242508 |
| M8 | 555.88998307813 | 748.396542 | 0.7428 | 0.461395 | 0.230697 |
| M9 | -60.2757250744329 | 720.560054 | -0.0837 | 0.933697 | 0.466848 |
| M10 | -187.771360832577 | 710.956807 | -0.2641 | 0.792874 | 0.396437 |
| M11 | 399.126243757439 | 713.509468 | 0.5594 | 0.578613 | 0.289306 |
| Multiple Linear Regression - Regression Statistics | |
| Multiple R | 0.918613524596436 |
| R-squared | 0.843850807571488 |
| Adjusted R-squared | 0.799721687972126 |
| F-TEST (value) | 19.1223123242115 |
| F-TEST (DF numerator) | 13 |
| F-TEST (DF denominator) | 46 |
| p-value | 2.55351295663786e-14 |
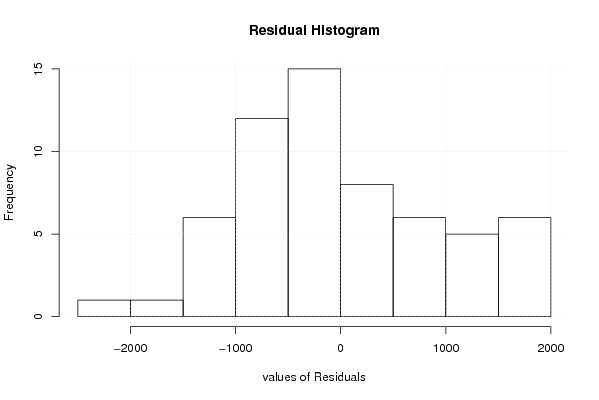
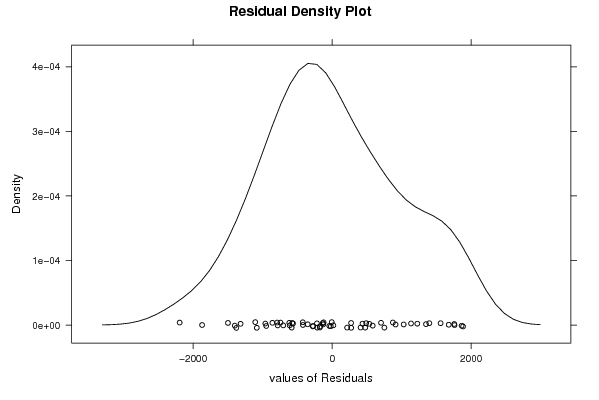
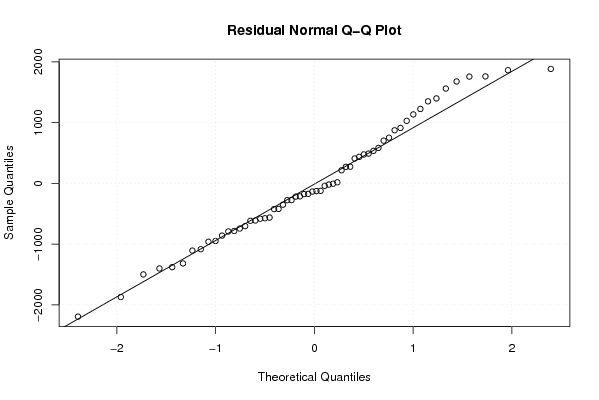
| Multiple Linear Regression - Residual Statistics | |
| Residual Standard Deviation | 1107.02513224762 |
| Sum Squared Residuals | 56373213.5976813 |
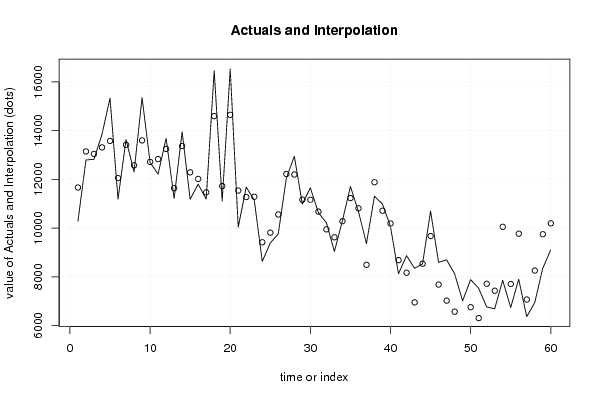
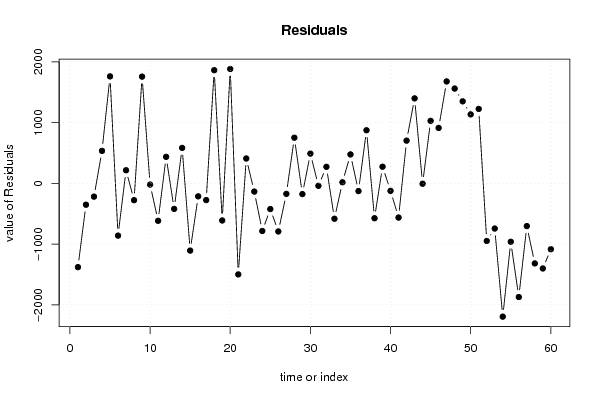
| Multiple Linear Regression - Actuals, Interpolation, and Residuals | |||
| Time or Index | Actuals | Interpolation Forecast | Residuals Prediction Error |
| 1 | 10284.5 | 11663.7803969823 | -1379.28039698228 |
| 2 | 12792 | 13143.7157931106 | -351.715793110617 |
| 3 | 12823.61538 | 13042.5041924629 | -218.888812462891 |
| 4 | 13845.66667 | 13310.9947879301 | 534.671882069892 |
| 5 | 15335.63636 | 13575.3058019411 | 1760.33055805893 |
| 6 | 11188.5 | 12048.7278586968 | -860.227858696835 |
| 7 | 13633.25 | 13418.0198494337 | 215.230150566253 |
| 8 | 12298.46667 | 12575.6916076448 | -277.22493764477 |
| 9 | 15353.63636 | 13596.7516934325 | 1756.88466656747 |
| 10 | 12696.15385 | 12716.2915714523 | -20.1377214523066 |
| 11 | 12213.93333 | 12830.5102058616 | -616.576875861633 |
| 12 | 13683.72727 | 13247.5676591278 | 436.159610872151 |
| 13 | 11214.14286 | 11634.7216408813 | -420.578780881293 |
| 14 | 13950.23077 | 13366.8722776739 | 583.358492326066 |
| 15 | 11179.13333 | 12285.8562311392 | -1106.72290113922 |
| 16 | 11801.875 | 12015.8932360552 | -214.018236055246 |
| 17 | 11188.82353 | 11464.5273375568 | -275.703807556811 |
| 18 | 16456.27273 | 14594.0027849018 | 1862.26994509825 |
| 19 | 11110.0625 | 11721.3240892292 | -611.261589229198 |
| 20 | 16530.69231 | 14647.7207742525 | 1882.97153574752 |
| 21 | 10038.41176 | 11537.6807315866 | -1499.26897158655 |
| 22 | 11681.25 | 11272.3229837350 | 408.927016264954 |
| 23 | 11148.88235 | 11284.3010451956 | -135.418695195568 |
| 24 | 8631 | 9415.16707853373 | -784.16707853373 |
| 25 | 9386.444444 | 9809.89254164306 | -423.448097643058 |
| 26 | 9764.736842 | 10556.5924529078 | -791.855610907849 |
| 27 | 12043.75 | 12216.8933583909 | -173.143358390942 |
| 28 | 12948.06667 | 12196.7343054748 | 751.332364525167 |
| 29 | 10987.125 | 11164.4382179595 | -177.313217959505 |
| 30 | 11648.3125 | 11158.8864020904 | 489.426097909624 |
| 31 | 10633.35294 | 10674.1166022855 | -40.763662285505 |
| 32 | 10219.3 | 9947.41524399624 | 271.884756003761 |
| 33 | 9037.6 | 9620.3043964054 | -582.704396405403 |
| 34 | 10296.31579 | 10279.2413958341 | 17.0743941658583 |
| 35 | 11705.41176 | 11229.6439781233 | 475.767781876726 |
| 36 | 10681.94444 | 10809.5020819589 | -127.557641958910 |
| 37 | 9362.947368 | 8489.58941018105 | 873.357957818947 |
| 38 | 11306.35294 | 11880.9555816368 | -574.602641636753 |
| 39 | 10984.45 | 10710.5732720158 | 273.876727984227 |
| 40 | 10062.61905 | 10186.0802839407 | -123.461233940748 |
| 41 | 8118.583333 | 8681.8115464835 | -563.2282134835 |
| 42 | 8867.48 | 8164.59824136598 | 702.881758634016 |
| 43 | 8346.72 | 6948.61734149725 | 1398.10265850275 |
| 44 | 8529.307692 | 8535.32384399626 | -6.0161519962549 |
| 45 | 10697.18182 | 9668.27929464008 | 1028.90252535992 |
| 46 | 8591.84 | 7679.65352331848 | 912.18647668152 |
| 47 | 8695.607143 | 7018.31169594111 | 1677.29544705889 |
| 48 | 8125.571429 | 6565.53808164451 | 1560.03334735549 |
| 49 | 7009.758621 | 5659.80930331232 | 1349.94931768769 |
| 50 | 7883.466667 | 6748.65111367085 | 1134.81555332915 |
| 51 | 7527.645161 | 6302.76681699117 | 1224.87834400883 |
| 52 | 6763.758621 | 7712.28339759907 | -948.524776599065 |
| 53 | 6682.333333 | 7426.41865205911 | -744.085319059113 |
| 54 | 7855.681818 | 10050.0317609451 | -2194.34994294505 |
| 55 | 6738.88 | 7700.1875575543 | -961.3075575543 |
| 56 | 7895.434783 | 9767.04998511025 | -1871.61520211025 |
| 57 | 6361.884615 | 7065.69843893544 | -703.81382393544 |
| 58 | 6935.956522 | 8254.00668766003 | -1318.05016566003 |
| 59 | 8344.454545 | 9745.52220287841 | -1401.06765787841 |
| 60 | 9107.944444 | 10192.412681735 | -1084.46823773500 |
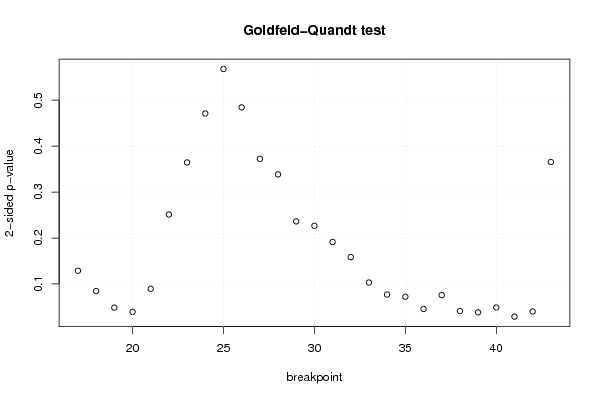
| Goldfeld-Quandt test for Heteroskedasticity | |||
| p-values | Alternative Hypothesis | ||
| breakpoint index | greater | 2-sided | less |
| 17 | 0.064396675942302 | 0.128793351884604 | 0.935603324057698 |
| 18 | 0.0422739227308281 | 0.0845478454616563 | 0.957726077269172 |
| 19 | 0.0242577631919942 | 0.0485155263839883 | 0.975742236808006 |
| 20 | 0.0196468699649209 | 0.0392937399298417 | 0.98035313003508 |
| 21 | 0.0447381040910848 | 0.0894762081821697 | 0.955261895908915 |
| 22 | 0.125575634236109 | 0.251151268472218 | 0.874424365763891 |
| 23 | 0.18225752228522 | 0.36451504457044 | 0.81774247771478 |
| 24 | 0.235517152841867 | 0.471034305683733 | 0.764482847158133 |
| 25 | 0.28404229989665 | 0.5680845997933 | 0.71595770010335 |
| 26 | 0.242254740123107 | 0.484509480246214 | 0.757745259876893 |
| 27 | 0.186263786076481 | 0.372527572152961 | 0.81373621392352 |
| 28 | 0.169325762459102 | 0.338651524918203 | 0.830674237540898 |
| 29 | 0.118122041616723 | 0.236244083233447 | 0.881877958383277 |
| 30 | 0.113313988536947 | 0.226627977073894 | 0.886686011463053 |
| 31 | 0.0957117762830444 | 0.191423552566089 | 0.904288223716956 |
| 32 | 0.079192850570348 | 0.158385701140696 | 0.920807149429652 |
| 33 | 0.0515633499046475 | 0.103126699809295 | 0.948436650095352 |
| 34 | 0.0384591325919330 | 0.0769182651838661 | 0.961540867408067 |
| 35 | 0.0360993109899270 | 0.0721986219798541 | 0.963900689010073 |
| 36 | 0.0227086404170830 | 0.0454172808341661 | 0.977291359582917 |
| 37 | 0.0378823445606627 | 0.0757646891213254 | 0.962117655439337 |
| 38 | 0.0204538177344879 | 0.0409076354689757 | 0.979546182265512 |
| 39 | 0.0191379281063076 | 0.0382758562126152 | 0.980862071893692 |
| 40 | 0.0243744302351898 | 0.0487488604703796 | 0.97562556976481 |
| 41 | 0.0144174421438212 | 0.0288348842876423 | 0.985582557856179 |
| 42 | 0.0200514266994248 | 0.0401028533988495 | 0.979948573300575 |
| 43 | 0.182747442119952 | 0.365494884239904 | 0.817252557880048 |
| Meta Analysis of Goldfeld-Quandt test for Heteroskedasticity | |||
| Description | # significant tests | % significant tests | OK/NOK |
| 1% type I error level | 0 | 0 | OK |
| 5% type I error level | 8 | 0.296296296296296 | NOK |
| 10% type I error level | 13 | 0.481481481481481 | NOK |