Free Statistics

of Irreproducible Research!

Author's title

Author*The author of this computation has been verified*
R Software Modulerwasp_multipleregression.wasp
Title produced by softwareMultiple Regression
Date of computationFri, 20 Nov 2009 07:36:25 -0700
Cite this page as followsStatistical Computations at FreeStatistics.org, Office for Research Development and Education, URL https://freestatistics.org/blog/index.php?v=date/2009/Nov/20/t1258728041y1j71d1fwotjoji.htm/, Retrieved Fri, 19 Apr 2024 23:01:23 +0000
Statistical Computations at FreeStatistics.org, Office for Research Development and Education, URL https://freestatistics.org/blog/index.php?pk=58220, Retrieved Fri, 19 Apr 2024 23:01:23 +0000
QR Codes:

Original text written by user:
IsPrivate?No (this computation is public)
User-defined keywordsmodel 2
Estimated Impact141
Family? (F = Feedback message, R = changed R code, M = changed R Module, P = changed Parameters, D = changed Data)
-     [Multiple Regression] [Q1 The Seatbeltlaw] [2007-11-14 19:27:43] [8cd6641b921d30ebe00b648d1481bba0]
- RMPD  [Multiple Regression] [Seatbelt] [2009-11-12 14:03:14] [b98453cac15ba1066b407e146608df68]
-    D      [Multiple Regression] [Workshop 3] [2009-11-20 14:36:25] [0852d9c28828e87a0aee4d255e088d63] [Current]
Feedback Forum

Post a new message
Dataseries X:
108.2	108.5
108.8	112.3
110.2	116.6
109.5	115.5
109.5	120.1
116	132.9
111.2	128.1
112.1	129.3
114	132.5
119.1	131
114.1	124.9
115.1	120.8
115.4	122
110.8	122.1
116	127.4
119.2	135.2
126.5	137.3
127.8	135
131.3	136
140.3	138.4
137.3	134.7
143	138.4
134.5	133.9
139.9	133.6
159.3	141.2
170.4	151.8
175	155.4
175.8	156.6
180.9	161.6
180.3	160.7
169.6	156
172.3	159.5
184.8	168.7
177.7	169.9
184.6	169.9
211.4	185.9
215.3	190.8
215.9	195.8
244.7	211.9
259.3	227.1
289	251.3
310.9	256.7
321	251.9
315.1	251.2
333.2	270.3
314.1	267.2
284.7	243
273.9	229.9
216	187.2
196.4	178.2
190.9	175.2
206.4	192.4
196.3	187
199.5	184
198.9	194.1
214.4	212.7
214.2	217.5
187.6	200.5
180.6	205.9
172.2	196.5


Summary of computational transaction
Raw Inputview raw input (R code)
Raw Outputview raw output of R engine
Computing time5 seconds
R Server'Gwilym Jenkins' @ 72.249.127.135

\begin{tabular}{lllllllll}
\hline
Summary of computational transaction \tabularnewline
Raw Input & view raw input (R code)  \tabularnewline
Raw Output & view raw output of R engine  \tabularnewline
Computing time & 5 seconds \tabularnewline
R Server & 'Gwilym Jenkins' @ 72.249.127.135 \tabularnewline
\hline
\end{tabular}
%Source: https://freestatistics.org/blog/index.php?pk=58220&T=0

[TABLE]
[ROW][C]Summary of computational transaction[/C][/ROW]
[ROW][C]Raw Input[/C][C]view raw input (R code) [/C][/ROW]
[ROW][C]Raw Output[/C][C]view raw output of R engine [/C][/ROW]
[ROW][C]Computing time[/C][C]5 seconds[/C][/ROW]
[ROW][C]R Server[/C][C]'Gwilym Jenkins' @ 72.249.127.135[/C][/ROW]
[/TABLE]
Source: https://freestatistics.org/blog/index.php?pk=58220&T=0

Globally Unique Identifier (entire table): ba.freestatistics.org/blog/index.php?pk=58220&T=0

As an alternative you can also use a QR Code:  

The GUIDs for individual cells are displayed in the table below:

Summary of computational transaction
Raw Inputview raw input (R code)
Raw Outputview raw output of R engine
Computing time5 seconds
R Server'Gwilym Jenkins' @ 72.249.127.135


Multiple Linear Regression - Estimated Regression Equation
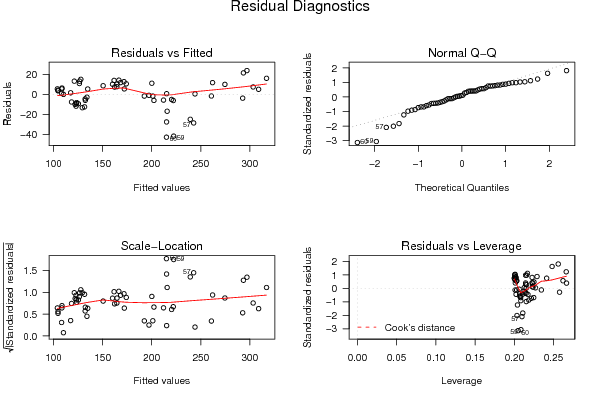
Y[t] = -61.2630376829935 + 1.40627113005073X[t] + 13.2467444431871M1[t] + 7.91357507008057M2[t] + 7.41658892601371M3[t] + 2.76204361780485M4[t] + 0.583789724495387M5[t] + 3.66873901237363M6[t] + 4.0687525356061M7[t] + 1.47739688535246M8[t] -1.83149088257830M9[t] -5.53454530820887M10[t] -5.8656710635106M11[t] + e[t]

\begin{tabular}{lllllllll}
\hline
Multiple Linear Regression - Estimated Regression Equation \tabularnewline
Y[t] =  -61.2630376829935 +  1.40627113005073X[t] +  13.2467444431871M1[t] +  7.91357507008057M2[t] +  7.41658892601371M3[t] +  2.76204361780485M4[t] +  0.583789724495387M5[t] +  3.66873901237363M6[t] +  4.0687525356061M7[t] +  1.47739688535246M8[t] -1.83149088257830M9[t] -5.53454530820887M10[t] -5.8656710635106M11[t]  + e[t] \tabularnewline
\hline
\end{tabular}
%Source: https://freestatistics.org/blog/index.php?pk=58220&T=1

[TABLE]
[ROW][C]Multiple Linear Regression - Estimated Regression Equation[/C][/ROW]
[ROW][C]Y[t] =  -61.2630376829935 +  1.40627113005073X[t] +  13.2467444431871M1[t] +  7.91357507008057M2[t] +  7.41658892601371M3[t] +  2.76204361780485M4[t] +  0.583789724495387M5[t] +  3.66873901237363M6[t] +  4.0687525356061M7[t] +  1.47739688535246M8[t] -1.83149088257830M9[t] -5.53454530820887M10[t] -5.8656710635106M11[t]  + e[t][/C][/ROW]
[/TABLE]
Source: https://freestatistics.org/blog/index.php?pk=58220&T=1

Globally Unique Identifier (entire table): ba.freestatistics.org/blog/index.php?pk=58220&T=1

As an alternative you can also use a QR Code:  

The GUIDs for individual cells are displayed in the table below:

Multiple Linear Regression - Estimated Regression Equation
Y[t] = -61.2630376829935 + 1.40627113005073X[t] + 13.2467444431871M1[t] + 7.91357507008057M2[t] + 7.41658892601371M3[t] + 2.76204361780485M4[t] + 0.583789724495387M5[t] + 3.66873901237363M6[t] + 4.0687525356061M7[t] + 1.47739688535246M8[t] -1.83149088257830M9[t] -5.53454530820887M10[t] -5.8656710635106M11[t] + e[t]


Multiple Linear Regression - Ordinary Least Squares
VariableParameterS.D.T-STATH0: parameter = 02-tail p-value1-tail p-value
(Intercept)-61.263037682993510.518752-5.824200
X1.406271130050730.04603830.545700
M113.24674444318719.7508641.35850.1807840.090392
M27.913575070080579.7406560.81240.4206430.210321
M37.416588926013719.7192640.76310.4492280.224614
M42.762043617804859.6981310.28480.7770470.388524
M50.5837897244953879.6915560.06020.9522220.476111
M63.668739012373639.6911990.37860.7067160.353358
M74.06875253560619.6911710.41980.6765150.338257
M81.477396885352469.6937740.15240.8795180.439759
M9-1.831490882578309.705371-0.18870.8511330.425567
M10-5.534545308208879.698271-0.57070.570940.28547
M11-5.86567106351069.69169-0.60520.547940.27397

\begin{tabular}{lllllllll}
\hline
Multiple Linear Regression - Ordinary Least Squares \tabularnewline
Variable & Parameter & S.D. & T-STATH0: parameter = 0 & 2-tail p-value & 1-tail p-value \tabularnewline
(Intercept) & -61.2630376829935 & 10.518752 & -5.8242 & 0 & 0 \tabularnewline
X & 1.40627113005073 & 0.046038 & 30.5457 & 0 & 0 \tabularnewline
M1 & 13.2467444431871 & 9.750864 & 1.3585 & 0.180784 & 0.090392 \tabularnewline
M2 & 7.91357507008057 & 9.740656 & 0.8124 & 0.420643 & 0.210321 \tabularnewline
M3 & 7.41658892601371 & 9.719264 & 0.7631 & 0.449228 & 0.224614 \tabularnewline
M4 & 2.76204361780485 & 9.698131 & 0.2848 & 0.777047 & 0.388524 \tabularnewline
M5 & 0.583789724495387 & 9.691556 & 0.0602 & 0.952222 & 0.476111 \tabularnewline
M6 & 3.66873901237363 & 9.691199 & 0.3786 & 0.706716 & 0.353358 \tabularnewline
M7 & 4.0687525356061 & 9.691171 & 0.4198 & 0.676515 & 0.338257 \tabularnewline
M8 & 1.47739688535246 & 9.693774 & 0.1524 & 0.879518 & 0.439759 \tabularnewline
M9 & -1.83149088257830 & 9.705371 & -0.1887 & 0.851133 & 0.425567 \tabularnewline
M10 & -5.53454530820887 & 9.698271 & -0.5707 & 0.57094 & 0.28547 \tabularnewline
M11 & -5.8656710635106 & 9.69169 & -0.6052 & 0.54794 & 0.27397 \tabularnewline
\hline
\end{tabular}
%Source: https://freestatistics.org/blog/index.php?pk=58220&T=2

[TABLE]
[ROW][C]Multiple Linear Regression - Ordinary Least Squares[/C][/ROW]
[ROW][C]Variable[/C][C]Parameter[/C][C]S.D.[/C][C]T-STATH0: parameter = 0[/C][C]2-tail p-value[/C][C]1-tail p-value[/C][/ROW]
[ROW][C](Intercept)[/C][C]-61.2630376829935[/C][C]10.518752[/C][C]-5.8242[/C][C]0[/C][C]0[/C][/ROW]
[ROW][C]X[/C][C]1.40627113005073[/C][C]0.046038[/C][C]30.5457[/C][C]0[/C][C]0[/C][/ROW]
[ROW][C]M1[/C][C]13.2467444431871[/C][C]9.750864[/C][C]1.3585[/C][C]0.180784[/C][C]0.090392[/C][/ROW]
[ROW][C]M2[/C][C]7.91357507008057[/C][C]9.740656[/C][C]0.8124[/C][C]0.420643[/C][C]0.210321[/C][/ROW]
[ROW][C]M3[/C][C]7.41658892601371[/C][C]9.719264[/C][C]0.7631[/C][C]0.449228[/C][C]0.224614[/C][/ROW]
[ROW][C]M4[/C][C]2.76204361780485[/C][C]9.698131[/C][C]0.2848[/C][C]0.777047[/C][C]0.388524[/C][/ROW]
[ROW][C]M5[/C][C]0.583789724495387[/C][C]9.691556[/C][C]0.0602[/C][C]0.952222[/C][C]0.476111[/C][/ROW]
[ROW][C]M6[/C][C]3.66873901237363[/C][C]9.691199[/C][C]0.3786[/C][C]0.706716[/C][C]0.353358[/C][/ROW]
[ROW][C]M7[/C][C]4.0687525356061[/C][C]9.691171[/C][C]0.4198[/C][C]0.676515[/C][C]0.338257[/C][/ROW]
[ROW][C]M8[/C][C]1.47739688535246[/C][C]9.693774[/C][C]0.1524[/C][C]0.879518[/C][C]0.439759[/C][/ROW]
[ROW][C]M9[/C][C]-1.83149088257830[/C][C]9.705371[/C][C]-0.1887[/C][C]0.851133[/C][C]0.425567[/C][/ROW]
[ROW][C]M10[/C][C]-5.53454530820887[/C][C]9.698271[/C][C]-0.5707[/C][C]0.57094[/C][C]0.28547[/C][/ROW]
[ROW][C]M11[/C][C]-5.8656710635106[/C][C]9.69169[/C][C]-0.6052[/C][C]0.54794[/C][C]0.27397[/C][/ROW]
[/TABLE]
Source: https://freestatistics.org/blog/index.php?pk=58220&T=2

Globally Unique Identifier (entire table): ba.freestatistics.org/blog/index.php?pk=58220&T=2

As an alternative you can also use a QR Code:  

The GUIDs for individual cells are displayed in the table below:

Multiple Linear Regression - Ordinary Least Squares
VariableParameterS.D.T-STATH0: parameter = 02-tail p-value1-tail p-value
(Intercept)-61.263037682993510.518752-5.824200
X1.406271130050730.04603830.545700
M113.24674444318719.7508641.35850.1807840.090392
M27.913575070080579.7406560.81240.4206430.210321
M37.416588926013719.7192640.76310.4492280.224614
M42.762043617804859.6981310.28480.7770470.388524
M50.5837897244953879.6915560.06020.9522220.476111
M63.668739012373639.6911990.37860.7067160.353358
M74.06875253560619.6911710.41980.6765150.338257
M81.477396885352469.6937740.15240.8795180.439759
M9-1.831490882578309.705371-0.18870.8511330.425567
M10-5.534545308208879.698271-0.57070.570940.28547
M11-5.86567106351069.69169-0.60520.547940.27397


Multiple Linear Regression - Regression Statistics
Multiple R0.976467560440171
R-squared0.95348889659198
Adjusted R-squared0.941613721253761
F-TEST (value)80.2926162718081
F-TEST (DF numerator)12
F-TEST (DF denominator)47
p-value0
Multiple Linear Regression - Residual Statistics
Residual Standard Deviation15.3230850012099
Sum Squared Residuals11035.4558958523

\begin{tabular}{lllllllll}
\hline
Multiple Linear Regression - Regression Statistics \tabularnewline
Multiple R & 0.976467560440171 \tabularnewline
R-squared & 0.95348889659198 \tabularnewline
Adjusted R-squared & 0.941613721253761 \tabularnewline
F-TEST (value) & 80.2926162718081 \tabularnewline
F-TEST (DF numerator) & 12 \tabularnewline
F-TEST (DF denominator) & 47 \tabularnewline
p-value & 0 \tabularnewline
Multiple Linear Regression - Residual Statistics \tabularnewline
Residual Standard Deviation & 15.3230850012099 \tabularnewline
Sum Squared Residuals & 11035.4558958523 \tabularnewline
\hline
\end{tabular}
%Source: https://freestatistics.org/blog/index.php?pk=58220&T=3

[TABLE]
[ROW][C]Multiple Linear Regression - Regression Statistics[/C][/ROW]
[ROW][C]Multiple R[/C][C]0.976467560440171[/C][/ROW]
[ROW][C]R-squared[/C][C]0.95348889659198[/C][/ROW]
[ROW][C]Adjusted R-squared[/C][C]0.941613721253761[/C][/ROW]
[ROW][C]F-TEST (value)[/C][C]80.2926162718081[/C][/ROW]
[ROW][C]F-TEST (DF numerator)[/C][C]12[/C][/ROW]
[ROW][C]F-TEST (DF denominator)[/C][C]47[/C][/ROW]
[ROW][C]p-value[/C][C]0[/C][/ROW]
[ROW][C]Multiple Linear Regression - Residual Statistics[/C][/ROW]
[ROW][C]Residual Standard Deviation[/C][C]15.3230850012099[/C][/ROW]
[ROW][C]Sum Squared Residuals[/C][C]11035.4558958523[/C][/ROW]
[/TABLE]
Source: https://freestatistics.org/blog/index.php?pk=58220&T=3

Globally Unique Identifier (entire table): ba.freestatistics.org/blog/index.php?pk=58220&T=3

As an alternative you can also use a QR Code:  

The GUIDs for individual cells are displayed in the table below:

Multiple Linear Regression - Regression Statistics
Multiple R0.976467560440171
R-squared0.95348889659198
Adjusted R-squared0.941613721253761
F-TEST (value)80.2926162718081
F-TEST (DF numerator)12
F-TEST (DF denominator)47
p-value0
Multiple Linear Regression - Residual Statistics
Residual Standard Deviation15.3230850012099
Sum Squared Residuals11035.4558958523


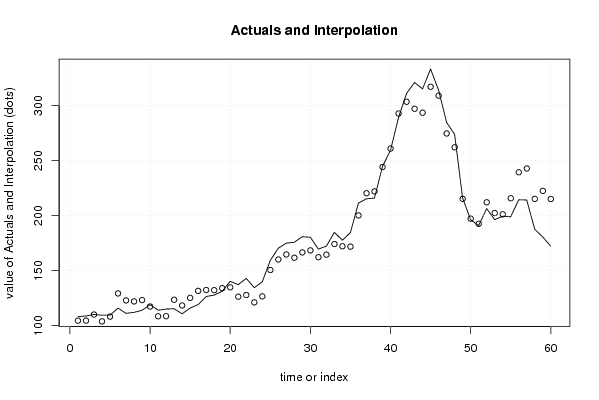
Multiple Linear Regression - Actuals, Interpolation, and Residuals
Time or IndexActualsInterpolationForecastResidualsPrediction Error
1108.2104.5641243706983.63587562930221
2108.8104.5747852917844.22521470821608
3110.2110.1247650069350.0752349930646857
4109.5103.9233214556715.57667854432937
5109.5108.2139147605951.28608523940550
6116129.299134513122-13.2991345131221
7111.2122.949046612111-11.7490466121111
8112.1122.045216317918-9.94521631791834
9114123.23639616615-9.23639616614988
10119.1117.4239350454431.67606495455677
11114.1108.5145553968325.58544460316795
12115.1108.6145148271356.48548517286534
13115.4123.548784626383-8.1487846263826
14110.8118.356242366281-7.55624236628117
15116125.312493211483-9.31249321148318
16119.2131.62686271767-12.4268627176700
17126.5132.401778197467-5.9017781974671
18127.8132.252303886229-4.45230388622864
19131.3134.058588539512-2.75858853951184
20140.3134.842283601385.45771639862005
21137.3126.33019265226110.9698073477385
22143127.83034140781915.1696585921814
23134.5121.17099556728913.3290044327114
24139.9126.61478529178413.2852147082160
25159.3150.5491903233578.7508096766434
26170.4160.12249492878810.2775050712121
27175164.68808485290410.3119151470964
28175.8161.72106490075614.0789350992444
29180.9166.57416665770014.3258333423002
30180.3168.39347192853211.9065280714676
31169.6162.1840111405267.41598885947356
32172.3164.5146044454507.78539555454966
33184.8174.14341107398610.6565889260137
34177.7172.1278820044175.57211799558337
35184.6171.79675624911512.8032437508851
36211.4200.16276539343711.2372346065628
37215.3220.300238373873-5.00023837387282
38215.9221.99842465102-6.09842465101997
39244.7244.142403700770.557596299230145
40259.3260.863179569332-1.56317956933206
41289292.71668702325-3.71668702325026
42310.9303.3955004134027.50449958659752
43321297.04541251239123.9545874876086
44315.1293.46966707110221.6303329288978
45333.2317.02055788714016.1794421128595
46314.1308.9580629583535.14193704164743
47284.7274.59517585582310.1048241441768
48273.9262.03869511566911.8613048843307
49216215.237662305690.76233769430982
50196.4197.248052762127-0.84805276212709
51190.9192.532253227908-1.63225322790804
52206.4212.065571356572-5.66557135657176
53196.3202.293453360988-5.99345336098833
54199.5201.159589258714-1.6595892587144
55198.9215.762941195459-16.8629411954592
56214.4239.328228564149-24.9282285641491
57214.2242.769442220462-28.5694422204619
58187.6215.159778583969-27.5597785839689
59180.6222.422516930941-41.8225169309412
60172.2215.069239371975-42.8692393719749

\begin{tabular}{lllllllll}
\hline
Multiple Linear Regression - Actuals, Interpolation, and Residuals \tabularnewline
Time or Index & Actuals & InterpolationForecast & ResidualsPrediction Error \tabularnewline
1 & 108.2 & 104.564124370698 & 3.63587562930221 \tabularnewline
2 & 108.8 & 104.574785291784 & 4.22521470821608 \tabularnewline
3 & 110.2 & 110.124765006935 & 0.0752349930646857 \tabularnewline
4 & 109.5 & 103.923321455671 & 5.57667854432937 \tabularnewline
5 & 109.5 & 108.213914760595 & 1.28608523940550 \tabularnewline
6 & 116 & 129.299134513122 & -13.2991345131221 \tabularnewline
7 & 111.2 & 122.949046612111 & -11.7490466121111 \tabularnewline
8 & 112.1 & 122.045216317918 & -9.94521631791834 \tabularnewline
9 & 114 & 123.23639616615 & -9.23639616614988 \tabularnewline
10 & 119.1 & 117.423935045443 & 1.67606495455677 \tabularnewline
11 & 114.1 & 108.514555396832 & 5.58544460316795 \tabularnewline
12 & 115.1 & 108.614514827135 & 6.48548517286534 \tabularnewline
13 & 115.4 & 123.548784626383 & -8.1487846263826 \tabularnewline
14 & 110.8 & 118.356242366281 & -7.55624236628117 \tabularnewline
15 & 116 & 125.312493211483 & -9.31249321148318 \tabularnewline
16 & 119.2 & 131.62686271767 & -12.4268627176700 \tabularnewline
17 & 126.5 & 132.401778197467 & -5.9017781974671 \tabularnewline
18 & 127.8 & 132.252303886229 & -4.45230388622864 \tabularnewline
19 & 131.3 & 134.058588539512 & -2.75858853951184 \tabularnewline
20 & 140.3 & 134.84228360138 & 5.45771639862005 \tabularnewline
21 & 137.3 & 126.330192652261 & 10.9698073477385 \tabularnewline
22 & 143 & 127.830341407819 & 15.1696585921814 \tabularnewline
23 & 134.5 & 121.170995567289 & 13.3290044327114 \tabularnewline
24 & 139.9 & 126.614785291784 & 13.2852147082160 \tabularnewline
25 & 159.3 & 150.549190323357 & 8.7508096766434 \tabularnewline
26 & 170.4 & 160.122494928788 & 10.2775050712121 \tabularnewline
27 & 175 & 164.688084852904 & 10.3119151470964 \tabularnewline
28 & 175.8 & 161.721064900756 & 14.0789350992444 \tabularnewline
29 & 180.9 & 166.574166657700 & 14.3258333423002 \tabularnewline
30 & 180.3 & 168.393471928532 & 11.9065280714676 \tabularnewline
31 & 169.6 & 162.184011140526 & 7.41598885947356 \tabularnewline
32 & 172.3 & 164.514604445450 & 7.78539555454966 \tabularnewline
33 & 184.8 & 174.143411073986 & 10.6565889260137 \tabularnewline
34 & 177.7 & 172.127882004417 & 5.57211799558337 \tabularnewline
35 & 184.6 & 171.796756249115 & 12.8032437508851 \tabularnewline
36 & 211.4 & 200.162765393437 & 11.2372346065628 \tabularnewline
37 & 215.3 & 220.300238373873 & -5.00023837387282 \tabularnewline
38 & 215.9 & 221.99842465102 & -6.09842465101997 \tabularnewline
39 & 244.7 & 244.14240370077 & 0.557596299230145 \tabularnewline
40 & 259.3 & 260.863179569332 & -1.56317956933206 \tabularnewline
41 & 289 & 292.71668702325 & -3.71668702325026 \tabularnewline
42 & 310.9 & 303.395500413402 & 7.50449958659752 \tabularnewline
43 & 321 & 297.045412512391 & 23.9545874876086 \tabularnewline
44 & 315.1 & 293.469667071102 & 21.6303329288978 \tabularnewline
45 & 333.2 & 317.020557887140 & 16.1794421128595 \tabularnewline
46 & 314.1 & 308.958062958353 & 5.14193704164743 \tabularnewline
47 & 284.7 & 274.595175855823 & 10.1048241441768 \tabularnewline
48 & 273.9 & 262.038695115669 & 11.8613048843307 \tabularnewline
49 & 216 & 215.23766230569 & 0.76233769430982 \tabularnewline
50 & 196.4 & 197.248052762127 & -0.84805276212709 \tabularnewline
51 & 190.9 & 192.532253227908 & -1.63225322790804 \tabularnewline
52 & 206.4 & 212.065571356572 & -5.66557135657176 \tabularnewline
53 & 196.3 & 202.293453360988 & -5.99345336098833 \tabularnewline
54 & 199.5 & 201.159589258714 & -1.6595892587144 \tabularnewline
55 & 198.9 & 215.762941195459 & -16.8629411954592 \tabularnewline
56 & 214.4 & 239.328228564149 & -24.9282285641491 \tabularnewline
57 & 214.2 & 242.769442220462 & -28.5694422204619 \tabularnewline
58 & 187.6 & 215.159778583969 & -27.5597785839689 \tabularnewline
59 & 180.6 & 222.422516930941 & -41.8225169309412 \tabularnewline
60 & 172.2 & 215.069239371975 & -42.8692393719749 \tabularnewline
\hline
\end{tabular}
%Source: https://freestatistics.org/blog/index.php?pk=58220&T=4

[TABLE]
[ROW][C]Multiple Linear Regression - Actuals, Interpolation, and Residuals[/C][/ROW]
[ROW][C]Time or Index[/C][C]Actuals[/C][C]InterpolationForecast[/C][C]ResidualsPrediction Error[/C][/ROW]
[ROW][C]1[/C][C]108.2[/C][C]104.564124370698[/C][C]3.63587562930221[/C][/ROW]
[ROW][C]2[/C][C]108.8[/C][C]104.574785291784[/C][C]4.22521470821608[/C][/ROW]
[ROW][C]3[/C][C]110.2[/C][C]110.124765006935[/C][C]0.0752349930646857[/C][/ROW]
[ROW][C]4[/C][C]109.5[/C][C]103.923321455671[/C][C]5.57667854432937[/C][/ROW]
[ROW][C]5[/C][C]109.5[/C][C]108.213914760595[/C][C]1.28608523940550[/C][/ROW]
[ROW][C]6[/C][C]116[/C][C]129.299134513122[/C][C]-13.2991345131221[/C][/ROW]
[ROW][C]7[/C][C]111.2[/C][C]122.949046612111[/C][C]-11.7490466121111[/C][/ROW]
[ROW][C]8[/C][C]112.1[/C][C]122.045216317918[/C][C]-9.94521631791834[/C][/ROW]
[ROW][C]9[/C][C]114[/C][C]123.23639616615[/C][C]-9.23639616614988[/C][/ROW]
[ROW][C]10[/C][C]119.1[/C][C]117.423935045443[/C][C]1.67606495455677[/C][/ROW]
[ROW][C]11[/C][C]114.1[/C][C]108.514555396832[/C][C]5.58544460316795[/C][/ROW]
[ROW][C]12[/C][C]115.1[/C][C]108.614514827135[/C][C]6.48548517286534[/C][/ROW]
[ROW][C]13[/C][C]115.4[/C][C]123.548784626383[/C][C]-8.1487846263826[/C][/ROW]
[ROW][C]14[/C][C]110.8[/C][C]118.356242366281[/C][C]-7.55624236628117[/C][/ROW]
[ROW][C]15[/C][C]116[/C][C]125.312493211483[/C][C]-9.31249321148318[/C][/ROW]
[ROW][C]16[/C][C]119.2[/C][C]131.62686271767[/C][C]-12.4268627176700[/C][/ROW]
[ROW][C]17[/C][C]126.5[/C][C]132.401778197467[/C][C]-5.9017781974671[/C][/ROW]
[ROW][C]18[/C][C]127.8[/C][C]132.252303886229[/C][C]-4.45230388622864[/C][/ROW]
[ROW][C]19[/C][C]131.3[/C][C]134.058588539512[/C][C]-2.75858853951184[/C][/ROW]
[ROW][C]20[/C][C]140.3[/C][C]134.84228360138[/C][C]5.45771639862005[/C][/ROW]
[ROW][C]21[/C][C]137.3[/C][C]126.330192652261[/C][C]10.9698073477385[/C][/ROW]
[ROW][C]22[/C][C]143[/C][C]127.830341407819[/C][C]15.1696585921814[/C][/ROW]
[ROW][C]23[/C][C]134.5[/C][C]121.170995567289[/C][C]13.3290044327114[/C][/ROW]
[ROW][C]24[/C][C]139.9[/C][C]126.614785291784[/C][C]13.2852147082160[/C][/ROW]
[ROW][C]25[/C][C]159.3[/C][C]150.549190323357[/C][C]8.7508096766434[/C][/ROW]
[ROW][C]26[/C][C]170.4[/C][C]160.122494928788[/C][C]10.2775050712121[/C][/ROW]
[ROW][C]27[/C][C]175[/C][C]164.688084852904[/C][C]10.3119151470964[/C][/ROW]
[ROW][C]28[/C][C]175.8[/C][C]161.721064900756[/C][C]14.0789350992444[/C][/ROW]
[ROW][C]29[/C][C]180.9[/C][C]166.574166657700[/C][C]14.3258333423002[/C][/ROW]
[ROW][C]30[/C][C]180.3[/C][C]168.393471928532[/C][C]11.9065280714676[/C][/ROW]
[ROW][C]31[/C][C]169.6[/C][C]162.184011140526[/C][C]7.41598885947356[/C][/ROW]
[ROW][C]32[/C][C]172.3[/C][C]164.514604445450[/C][C]7.78539555454966[/C][/ROW]
[ROW][C]33[/C][C]184.8[/C][C]174.143411073986[/C][C]10.6565889260137[/C][/ROW]
[ROW][C]34[/C][C]177.7[/C][C]172.127882004417[/C][C]5.57211799558337[/C][/ROW]
[ROW][C]35[/C][C]184.6[/C][C]171.796756249115[/C][C]12.8032437508851[/C][/ROW]
[ROW][C]36[/C][C]211.4[/C][C]200.162765393437[/C][C]11.2372346065628[/C][/ROW]
[ROW][C]37[/C][C]215.3[/C][C]220.300238373873[/C][C]-5.00023837387282[/C][/ROW]
[ROW][C]38[/C][C]215.9[/C][C]221.99842465102[/C][C]-6.09842465101997[/C][/ROW]
[ROW][C]39[/C][C]244.7[/C][C]244.14240370077[/C][C]0.557596299230145[/C][/ROW]
[ROW][C]40[/C][C]259.3[/C][C]260.863179569332[/C][C]-1.56317956933206[/C][/ROW]
[ROW][C]41[/C][C]289[/C][C]292.71668702325[/C][C]-3.71668702325026[/C][/ROW]
[ROW][C]42[/C][C]310.9[/C][C]303.395500413402[/C][C]7.50449958659752[/C][/ROW]
[ROW][C]43[/C][C]321[/C][C]297.045412512391[/C][C]23.9545874876086[/C][/ROW]
[ROW][C]44[/C][C]315.1[/C][C]293.469667071102[/C][C]21.6303329288978[/C][/ROW]
[ROW][C]45[/C][C]333.2[/C][C]317.020557887140[/C][C]16.1794421128595[/C][/ROW]
[ROW][C]46[/C][C]314.1[/C][C]308.958062958353[/C][C]5.14193704164743[/C][/ROW]
[ROW][C]47[/C][C]284.7[/C][C]274.595175855823[/C][C]10.1048241441768[/C][/ROW]
[ROW][C]48[/C][C]273.9[/C][C]262.038695115669[/C][C]11.8613048843307[/C][/ROW]
[ROW][C]49[/C][C]216[/C][C]215.23766230569[/C][C]0.76233769430982[/C][/ROW]
[ROW][C]50[/C][C]196.4[/C][C]197.248052762127[/C][C]-0.84805276212709[/C][/ROW]
[ROW][C]51[/C][C]190.9[/C][C]192.532253227908[/C][C]-1.63225322790804[/C][/ROW]
[ROW][C]52[/C][C]206.4[/C][C]212.065571356572[/C][C]-5.66557135657176[/C][/ROW]
[ROW][C]53[/C][C]196.3[/C][C]202.293453360988[/C][C]-5.99345336098833[/C][/ROW]
[ROW][C]54[/C][C]199.5[/C][C]201.159589258714[/C][C]-1.6595892587144[/C][/ROW]
[ROW][C]55[/C][C]198.9[/C][C]215.762941195459[/C][C]-16.8629411954592[/C][/ROW]
[ROW][C]56[/C][C]214.4[/C][C]239.328228564149[/C][C]-24.9282285641491[/C][/ROW]
[ROW][C]57[/C][C]214.2[/C][C]242.769442220462[/C][C]-28.5694422204619[/C][/ROW]
[ROW][C]58[/C][C]187.6[/C][C]215.159778583969[/C][C]-27.5597785839689[/C][/ROW]
[ROW][C]59[/C][C]180.6[/C][C]222.422516930941[/C][C]-41.8225169309412[/C][/ROW]
[ROW][C]60[/C][C]172.2[/C][C]215.069239371975[/C][C]-42.8692393719749[/C][/ROW]
[/TABLE]
Source: https://freestatistics.org/blog/index.php?pk=58220&T=4

Globally Unique Identifier (entire table): ba.freestatistics.org/blog/index.php?pk=58220&T=4

As an alternative you can also use a QR Code:  

The GUIDs for individual cells are displayed in the table below:

Multiple Linear Regression - Actuals, Interpolation, and Residuals
Time or IndexActualsInterpolationForecastResidualsPrediction Error
1108.2104.5641243706983.63587562930221
2108.8104.5747852917844.22521470821608
3110.2110.1247650069350.0752349930646857
4109.5103.9233214556715.57667854432937
5109.5108.2139147605951.28608523940550
6116129.299134513122-13.2991345131221
7111.2122.949046612111-11.7490466121111
8112.1122.045216317918-9.94521631791834
9114123.23639616615-9.23639616614988
10119.1117.4239350454431.67606495455677
11114.1108.5145553968325.58544460316795
12115.1108.6145148271356.48548517286534
13115.4123.548784626383-8.1487846263826
14110.8118.356242366281-7.55624236628117
15116125.312493211483-9.31249321148318
16119.2131.62686271767-12.4268627176700
17126.5132.401778197467-5.9017781974671
18127.8132.252303886229-4.45230388622864
19131.3134.058588539512-2.75858853951184
20140.3134.842283601385.45771639862005
21137.3126.33019265226110.9698073477385
22143127.83034140781915.1696585921814
23134.5121.17099556728913.3290044327114
24139.9126.61478529178413.2852147082160
25159.3150.5491903233578.7508096766434
26170.4160.12249492878810.2775050712121
27175164.68808485290410.3119151470964
28175.8161.72106490075614.0789350992444
29180.9166.57416665770014.3258333423002
30180.3168.39347192853211.9065280714676
31169.6162.1840111405267.41598885947356
32172.3164.5146044454507.78539555454966
33184.8174.14341107398610.6565889260137
34177.7172.1278820044175.57211799558337
35184.6171.79675624911512.8032437508851
36211.4200.16276539343711.2372346065628
37215.3220.300238373873-5.00023837387282
38215.9221.99842465102-6.09842465101997
39244.7244.142403700770.557596299230145
40259.3260.863179569332-1.56317956933206
41289292.71668702325-3.71668702325026
42310.9303.3955004134027.50449958659752
43321297.04541251239123.9545874876086
44315.1293.46966707110221.6303329288978
45333.2317.02055788714016.1794421128595
46314.1308.9580629583535.14193704164743
47284.7274.59517585582310.1048241441768
48273.9262.03869511566911.8613048843307
49216215.237662305690.76233769430982
50196.4197.248052762127-0.84805276212709
51190.9192.532253227908-1.63225322790804
52206.4212.065571356572-5.66557135657176
53196.3202.293453360988-5.99345336098833
54199.5201.159589258714-1.6595892587144
55198.9215.762941195459-16.8629411954592
56214.4239.328228564149-24.9282285641491
57214.2242.769442220462-28.5694422204619
58187.6215.159778583969-27.5597785839689
59180.6222.422516930941-41.8225169309412
60172.2215.069239371975-42.8692393719749


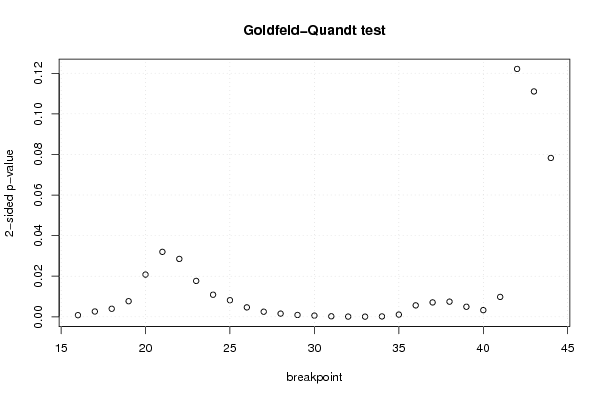
Goldfeld-Quandt test for Heteroskedasticity
p-valuesAlternative Hypothesis
breakpoint indexgreater2-sidedless
160.0004073579925106030.0008147159850212060.99959264200749
170.00131836942862680.00263673885725360.998681630571373
180.001987210387282260.003974420774564530.998012789612718
190.003852511878288310.007705023756576610.996147488121712
200.01041306416261560.02082612832523110.989586935837384
210.01601007811387210.03202015622774420.983989921886128
220.01426646714539030.02853293429078060.98573353285461
230.008845689908621770.01769137981724350.991154310091378
240.005447875190506260.01089575038101250.994552124809494
250.004098423682028860.008196847364057720.995901576317971
260.002332965230589130.004665930461178260.99766703476941
270.001262182361056660.002524364722113320.998737817638943
280.0007932850396781120.001586570079356220.999206714960322
290.0004605103893834220.0009210207787668430.999539489610617
300.0003034989396123870.0006069978792247750.999696501060388
310.0001342534992378710.0002685069984757420.999865746500762
326.08751260054167e-050.0001217502520108330.999939124873995
334.55975484705643e-059.11950969411286e-050.99995440245153
349.9320347869373e-050.0001986406957387460.99990067965213
350.0005566841357365190.001113368271473040.999443315864263
360.002829434377358380.005658868754716760.997170565622642
370.003554564832782490.007109129665564980.996445435167218
380.003737798455968370.007475596911936730.996262201544032
390.002482009183848850.00496401836769770.99751799081615
400.001650447024359180.003300894048718360.99834955297564
410.004907339242830780.009814678485661560.99509266075717
420.06106370328146550.1221274065629310.938936296718534
430.05552313317710370.1110462663542070.944476866822896
440.03913798865661490.07827597731322970.960862011343385

\begin{tabular}{lllllllll}
\hline
Goldfeld-Quandt test for Heteroskedasticity \tabularnewline
p-values & Alternative Hypothesis \tabularnewline
breakpoint index & greater & 2-sided & less \tabularnewline
16 & 0.000407357992510603 & 0.000814715985021206 & 0.99959264200749 \tabularnewline
17 & 0.0013183694286268 & 0.0026367388572536 & 0.998681630571373 \tabularnewline
18 & 0.00198721038728226 & 0.00397442077456453 & 0.998012789612718 \tabularnewline
19 & 0.00385251187828831 & 0.00770502375657661 & 0.996147488121712 \tabularnewline
20 & 0.0104130641626156 & 0.0208261283252311 & 0.989586935837384 \tabularnewline
21 & 0.0160100781138721 & 0.0320201562277442 & 0.983989921886128 \tabularnewline
22 & 0.0142664671453903 & 0.0285329342907806 & 0.98573353285461 \tabularnewline
23 & 0.00884568990862177 & 0.0176913798172435 & 0.991154310091378 \tabularnewline
24 & 0.00544787519050626 & 0.0108957503810125 & 0.994552124809494 \tabularnewline
25 & 0.00409842368202886 & 0.00819684736405772 & 0.995901576317971 \tabularnewline
26 & 0.00233296523058913 & 0.00466593046117826 & 0.99766703476941 \tabularnewline
27 & 0.00126218236105666 & 0.00252436472211332 & 0.998737817638943 \tabularnewline
28 & 0.000793285039678112 & 0.00158657007935622 & 0.999206714960322 \tabularnewline
29 & 0.000460510389383422 & 0.000921020778766843 & 0.999539489610617 \tabularnewline
30 & 0.000303498939612387 & 0.000606997879224775 & 0.999696501060388 \tabularnewline
31 & 0.000134253499237871 & 0.000268506998475742 & 0.999865746500762 \tabularnewline
32 & 6.08751260054167e-05 & 0.000121750252010833 & 0.999939124873995 \tabularnewline
33 & 4.55975484705643e-05 & 9.11950969411286e-05 & 0.99995440245153 \tabularnewline
34 & 9.9320347869373e-05 & 0.000198640695738746 & 0.99990067965213 \tabularnewline
35 & 0.000556684135736519 & 0.00111336827147304 & 0.999443315864263 \tabularnewline
36 & 0.00282943437735838 & 0.00565886875471676 & 0.997170565622642 \tabularnewline
37 & 0.00355456483278249 & 0.00710912966556498 & 0.996445435167218 \tabularnewline
38 & 0.00373779845596837 & 0.00747559691193673 & 0.996262201544032 \tabularnewline
39 & 0.00248200918384885 & 0.0049640183676977 & 0.99751799081615 \tabularnewline
40 & 0.00165044702435918 & 0.00330089404871836 & 0.99834955297564 \tabularnewline
41 & 0.00490733924283078 & 0.00981467848566156 & 0.99509266075717 \tabularnewline
42 & 0.0610637032814655 & 0.122127406562931 & 0.938936296718534 \tabularnewline
43 & 0.0555231331771037 & 0.111046266354207 & 0.944476866822896 \tabularnewline
44 & 0.0391379886566149 & 0.0782759773132297 & 0.960862011343385 \tabularnewline
\hline
\end{tabular}
%Source: https://freestatistics.org/blog/index.php?pk=58220&T=5

[TABLE]
[ROW][C]Goldfeld-Quandt test for Heteroskedasticity[/C][/ROW]
[ROW][C]p-values[/C][C]Alternative Hypothesis[/C][/ROW]
[ROW][C]breakpoint index[/C][C]greater[/C][C]2-sided[/C][C]less[/C][/ROW]
[ROW][C]16[/C][C]0.000407357992510603[/C][C]0.000814715985021206[/C][C]0.99959264200749[/C][/ROW]
[ROW][C]17[/C][C]0.0013183694286268[/C][C]0.0026367388572536[/C][C]0.998681630571373[/C][/ROW]
[ROW][C]18[/C][C]0.00198721038728226[/C][C]0.00397442077456453[/C][C]0.998012789612718[/C][/ROW]
[ROW][C]19[/C][C]0.00385251187828831[/C][C]0.00770502375657661[/C][C]0.996147488121712[/C][/ROW]
[ROW][C]20[/C][C]0.0104130641626156[/C][C]0.0208261283252311[/C][C]0.989586935837384[/C][/ROW]
[ROW][C]21[/C][C]0.0160100781138721[/C][C]0.0320201562277442[/C][C]0.983989921886128[/C][/ROW]
[ROW][C]22[/C][C]0.0142664671453903[/C][C]0.0285329342907806[/C][C]0.98573353285461[/C][/ROW]
[ROW][C]23[/C][C]0.00884568990862177[/C][C]0.0176913798172435[/C][C]0.991154310091378[/C][/ROW]
[ROW][C]24[/C][C]0.00544787519050626[/C][C]0.0108957503810125[/C][C]0.994552124809494[/C][/ROW]
[ROW][C]25[/C][C]0.00409842368202886[/C][C]0.00819684736405772[/C][C]0.995901576317971[/C][/ROW]
[ROW][C]26[/C][C]0.00233296523058913[/C][C]0.00466593046117826[/C][C]0.99766703476941[/C][/ROW]
[ROW][C]27[/C][C]0.00126218236105666[/C][C]0.00252436472211332[/C][C]0.998737817638943[/C][/ROW]
[ROW][C]28[/C][C]0.000793285039678112[/C][C]0.00158657007935622[/C][C]0.999206714960322[/C][/ROW]
[ROW][C]29[/C][C]0.000460510389383422[/C][C]0.000921020778766843[/C][C]0.999539489610617[/C][/ROW]
[ROW][C]30[/C][C]0.000303498939612387[/C][C]0.000606997879224775[/C][C]0.999696501060388[/C][/ROW]
[ROW][C]31[/C][C]0.000134253499237871[/C][C]0.000268506998475742[/C][C]0.999865746500762[/C][/ROW]
[ROW][C]32[/C][C]6.08751260054167e-05[/C][C]0.000121750252010833[/C][C]0.999939124873995[/C][/ROW]
[ROW][C]33[/C][C]4.55975484705643e-05[/C][C]9.11950969411286e-05[/C][C]0.99995440245153[/C][/ROW]
[ROW][C]34[/C][C]9.9320347869373e-05[/C][C]0.000198640695738746[/C][C]0.99990067965213[/C][/ROW]
[ROW][C]35[/C][C]0.000556684135736519[/C][C]0.00111336827147304[/C][C]0.999443315864263[/C][/ROW]
[ROW][C]36[/C][C]0.00282943437735838[/C][C]0.00565886875471676[/C][C]0.997170565622642[/C][/ROW]
[ROW][C]37[/C][C]0.00355456483278249[/C][C]0.00710912966556498[/C][C]0.996445435167218[/C][/ROW]
[ROW][C]38[/C][C]0.00373779845596837[/C][C]0.00747559691193673[/C][C]0.996262201544032[/C][/ROW]
[ROW][C]39[/C][C]0.00248200918384885[/C][C]0.0049640183676977[/C][C]0.99751799081615[/C][/ROW]
[ROW][C]40[/C][C]0.00165044702435918[/C][C]0.00330089404871836[/C][C]0.99834955297564[/C][/ROW]
[ROW][C]41[/C][C]0.00490733924283078[/C][C]0.00981467848566156[/C][C]0.99509266075717[/C][/ROW]
[ROW][C]42[/C][C]0.0610637032814655[/C][C]0.122127406562931[/C][C]0.938936296718534[/C][/ROW]
[ROW][C]43[/C][C]0.0555231331771037[/C][C]0.111046266354207[/C][C]0.944476866822896[/C][/ROW]
[ROW][C]44[/C][C]0.0391379886566149[/C][C]0.0782759773132297[/C][C]0.960862011343385[/C][/ROW]
[/TABLE]
Source: https://freestatistics.org/blog/index.php?pk=58220&T=5

Globally Unique Identifier (entire table): ba.freestatistics.org/blog/index.php?pk=58220&T=5

As an alternative you can also use a QR Code:  

The GUIDs for individual cells are displayed in the table below:

Goldfeld-Quandt test for Heteroskedasticity
p-valuesAlternative Hypothesis
breakpoint indexgreater2-sidedless
160.0004073579925106030.0008147159850212060.99959264200749
170.00131836942862680.00263673885725360.998681630571373
180.001987210387282260.003974420774564530.998012789612718
190.003852511878288310.007705023756576610.996147488121712
200.01041306416261560.02082612832523110.989586935837384
210.01601007811387210.03202015622774420.983989921886128
220.01426646714539030.02853293429078060.98573353285461
230.008845689908621770.01769137981724350.991154310091378
240.005447875190506260.01089575038101250.994552124809494
250.004098423682028860.008196847364057720.995901576317971
260.002332965230589130.004665930461178260.99766703476941
270.001262182361056660.002524364722113320.998737817638943
280.0007932850396781120.001586570079356220.999206714960322
290.0004605103893834220.0009210207787668430.999539489610617
300.0003034989396123870.0006069978792247750.999696501060388
310.0001342534992378710.0002685069984757420.999865746500762
326.08751260054167e-050.0001217502520108330.999939124873995
334.55975484705643e-059.11950969411286e-050.99995440245153
349.9320347869373e-050.0001986406957387460.99990067965213
350.0005566841357365190.001113368271473040.999443315864263
360.002829434377358380.005658868754716760.997170565622642
370.003554564832782490.007109129665564980.996445435167218
380.003737798455968370.007475596911936730.996262201544032
390.002482009183848850.00496401836769770.99751799081615
400.001650447024359180.003300894048718360.99834955297564
410.004907339242830780.009814678485661560.99509266075717
420.06106370328146550.1221274065629310.938936296718534
430.05552313317710370.1110462663542070.944476866822896
440.03913798865661490.07827597731322970.960862011343385


Meta Analysis of Goldfeld-Quandt test for Heteroskedasticity
Description# significant tests% significant testsOK/NOK
1% type I error level210.724137931034483NOK
5% type I error level260.896551724137931NOK
10% type I error level270.93103448275862NOK

\begin{tabular}{lllllllll}
\hline
Meta Analysis of Goldfeld-Quandt test for Heteroskedasticity \tabularnewline
Description & # significant tests & % significant tests & OK/NOK \tabularnewline
1% type I error level & 21 & 0.724137931034483 & NOK \tabularnewline
5% type I error level & 26 & 0.896551724137931 & NOK \tabularnewline
10% type I error level & 27 & 0.93103448275862 & NOK \tabularnewline
\hline
\end{tabular}
%Source: https://freestatistics.org/blog/index.php?pk=58220&T=6

[TABLE]
[ROW][C]Meta Analysis of Goldfeld-Quandt test for Heteroskedasticity[/C][/ROW]
[ROW][C]Description[/C][C]# significant tests[/C][C]% significant tests[/C][C]OK/NOK[/C][/ROW]
[ROW][C]1% type I error level[/C][C]21[/C][C]0.724137931034483[/C][C]NOK[/C][/ROW]
[ROW][C]5% type I error level[/C][C]26[/C][C]0.896551724137931[/C][C]NOK[/C][/ROW]
[ROW][C]10% type I error level[/C][C]27[/C][C]0.93103448275862[/C][C]NOK[/C][/ROW]
[/TABLE]
Source: https://freestatistics.org/blog/index.php?pk=58220&T=6

Globally Unique Identifier (entire table): ba.freestatistics.org/blog/index.php?pk=58220&T=6

As an alternative you can also use a QR Code:  

The GUIDs for individual cells are displayed in the table below:

Meta Analysis of Goldfeld-Quandt test for Heteroskedasticity
Description# significant tests% significant testsOK/NOK
1% type I error level210.724137931034483NOK
5% type I error level260.896551724137931NOK
10% type I error level270.93103448275862NOK


Parameters (Session):
par1 = 1 ; par2 = Include Monthly Dummies ; par3 = No Linear Trend ;
Parameters (R input):
par1 = 1 ; par2 = Include Monthly Dummies ; par3 = No Linear Trend ;
R code (references can be found in the software module):
library(lattice)
library(lmtest)
n25 <- 25 #minimum number of obs. for Goldfeld-Quandt test
par1 <- as.numeric(par1)
x <- t(y)
k <- length(x[1,])
n <- length(x[,1])
x1 <- cbind(x[,par1], x[,1:k!=par1])
mycolnames <- c(colnames(x)[par1], colnames(x)[1:k!=par1])
colnames(x1) <- mycolnames #colnames(x)[par1]
x <- x1
if (par3 == 'First Differences'){
x2 <- array(0, dim=c(n-1,k), dimnames=list(1:(n-1), paste('(1-B)',colnames(x),sep='')))
for (i in 1:n-1) {
for (j in 1:k) {
x2[i,j] <- x[i+1,j] - x[i,j]
}
}
x <- x2
}
if (par2 == 'Include Monthly Dummies'){
x2 <- array(0, dim=c(n,11), dimnames=list(1:n, paste('M', seq(1:11), sep ='')))
for (i in 1:11){
x2[seq(i,n,12),i] <- 1
}
x <- cbind(x, x2)
}
if (par2 == 'Include Quarterly Dummies'){
x2 <- array(0, dim=c(n,3), dimnames=list(1:n, paste('Q', seq(1:3), sep ='')))
for (i in 1:3){
x2[seq(i,n,4),i] <- 1
}
x <- cbind(x, x2)
}
k <- length(x[1,])
if (par3 == 'Linear Trend'){
x <- cbind(x, c(1:n))
colnames(x)[k+1] <- 't'
}
x
k <- length(x[1,])
df <- as.data.frame(x)
(mylm <- lm(df))
(mysum <- summary(mylm))
if (n > n25) {
kp3 <- k + 3
nmkm3 <- n - k - 3
gqarr <- array(NA, dim=c(nmkm3-kp3+1,3))
numgqtests <- 0
numsignificant1 <- 0
numsignificant5 <- 0
numsignificant10 <- 0
for (mypoint in kp3:nmkm3) {
j <- 0
numgqtests <- numgqtests + 1
for (myalt in c('greater', 'two.sided', 'less')) {
j <- j + 1
gqarr[mypoint-kp3+1,j] <- gqtest(mylm, point=mypoint, alternative=myalt)$p.value
}
if (gqarr[mypoint-kp3+1,2] < 0.01) numsignificant1 <- numsignificant1 + 1
if (gqarr[mypoint-kp3+1,2] < 0.05) numsignificant5 <- numsignificant5 + 1
if (gqarr[mypoint-kp3+1,2] < 0.10) numsignificant10 <- numsignificant10 + 1
}
gqarr
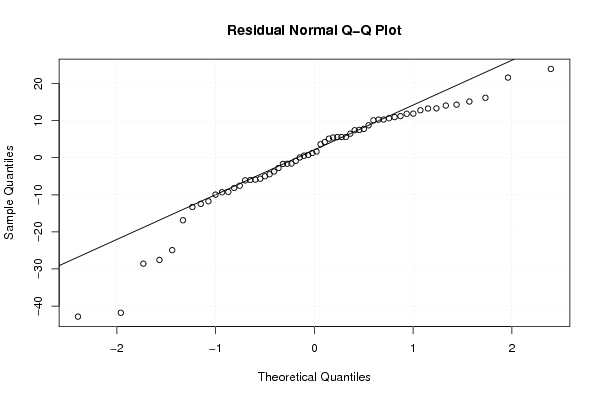
}
bitmap(file='test0.png')
plot(x[,1], type='l', main='Actuals and Interpolation', ylab='value of Actuals and Interpolation (dots)', xlab='time or index')
points(x[,1]-mysum$resid)
grid()
dev.off()
bitmap(file='test1.png')
plot(mysum$resid, type='b', pch=19, main='Residuals', ylab='value of Residuals', xlab='time or index')
grid()
dev.off()
bitmap(file='test2.png')
hist(mysum$resid, main='Residual Histogram', xlab='values of Residuals')
grid()
dev.off()
bitmap(file='test3.png')
densityplot(~mysum$resid,col='black',main='Residual Density Plot', xlab='values of Residuals')
dev.off()
bitmap(file='test4.png')
qqnorm(mysum$resid, main='Residual Normal Q-Q Plot')
qqline(mysum$resid)
grid()
dev.off()
(myerror <- as.ts(mysum$resid))
bitmap(file='test5.png')
dum <- cbind(lag(myerror,k=1),myerror)
dum
dum1 <- dum[2:length(myerror),]
dum1
z <- as.data.frame(dum1)
z
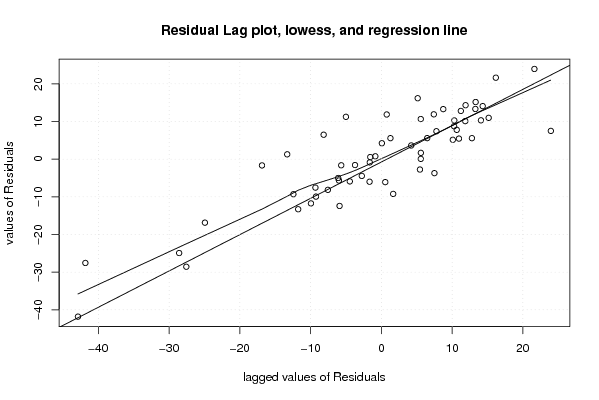
plot(z,main=paste('Residual Lag plot, lowess, and regression line'), ylab='values of Residuals', xlab='lagged values of Residuals')
lines(lowess(z))
abline(lm(z))
grid()
dev.off()
bitmap(file='test6.png')
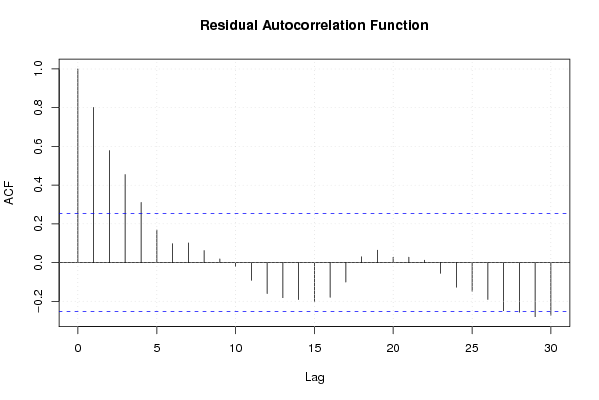
acf(mysum$resid, lag.max=length(mysum$resid)/2, main='Residual Autocorrelation Function')
grid()
dev.off()
bitmap(file='test7.png')
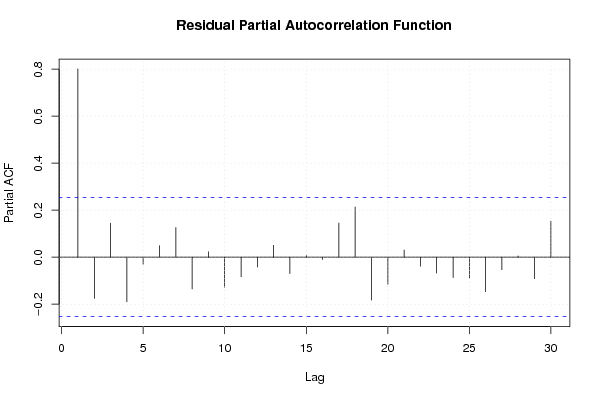
pacf(mysum$resid, lag.max=length(mysum$resid)/2, main='Residual Partial Autocorrelation Function')
grid()
dev.off()
bitmap(file='test8.png')
opar <- par(mfrow = c(2,2), oma = c(0, 0, 1.1, 0))
plot(mylm, las = 1, sub='Residual Diagnostics')
par(opar)
dev.off()
if (n > n25) {
bitmap(file='test9.png')
plot(kp3:nmkm3,gqarr[,2], main='Goldfeld-Quandt test',ylab='2-sided p-value',xlab='breakpoint')
grid()
dev.off()
}
load(file='createtable')
a<-table.start()
a<-table.row.start(a)
a<-table.element(a, 'Multiple Linear Regression - Estimated Regression Equation', 1, TRUE)
a<-table.row.end(a)
myeq <- colnames(x)[1]
myeq <- paste(myeq, '[t] = ', sep='')
for (i in 1:k){
if (mysum$coefficients[i,1] > 0) myeq <- paste(myeq, '+', '')
myeq <- paste(myeq, mysum$coefficients[i,1], sep=' ')
if (rownames(mysum$coefficients)[i] != '(Intercept)') {
myeq <- paste(myeq, rownames(mysum$coefficients)[i], sep='')
if (rownames(mysum$coefficients)[i] != 't') myeq <- paste(myeq, '[t]', sep='')
}
}
myeq <- paste(myeq, ' + e[t]')
a<-table.row.start(a)
a<-table.element(a, myeq)
a<-table.row.end(a)
a<-table.end(a)
table.save(a,file='mytable1.tab')
a<-table.start()
a<-table.row.start(a)
a<-table.element(a,hyperlink('ols1.htm','Multiple Linear Regression - Ordinary Least Squares',''), 6, TRUE)
a<-table.row.end(a)
a<-table.row.start(a)
a<-table.element(a,'Variable',header=TRUE)
a<-table.element(a,'Parameter',header=TRUE)
a<-table.element(a,'S.D.',header=TRUE)
a<-table.element(a,'T-STAT
H0: parameter = 0',header=TRUE)
a<-table.element(a,'2-tail p-value',header=TRUE)
a<-table.element(a,'1-tail p-value',header=TRUE)
a<-table.row.end(a)
for (i in 1:k){
a<-table.row.start(a)
a<-table.element(a,rownames(mysum$coefficients)[i],header=TRUE)
a<-table.element(a,mysum$coefficients[i,1])
a<-table.element(a, round(mysum$coefficients[i,2],6))
a<-table.element(a, round(mysum$coefficients[i,3],4))
a<-table.element(a, round(mysum$coefficients[i,4],6))
a<-table.element(a, round(mysum$coefficients[i,4]/2,6))
a<-table.row.end(a)
}
a<-table.end(a)
table.save(a,file='mytable2.tab')
a<-table.start()
a<-table.row.start(a)
a<-table.element(a, 'Multiple Linear Regression - Regression Statistics', 2, TRUE)
a<-table.row.end(a)
a<-table.row.start(a)
a<-table.element(a, 'Multiple R',1,TRUE)
a<-table.element(a, sqrt(mysum$r.squared))
a<-table.row.end(a)
a<-table.row.start(a)
a<-table.element(a, 'R-squared',1,TRUE)
a<-table.element(a, mysum$r.squared)
a<-table.row.end(a)
a<-table.row.start(a)
a<-table.element(a, 'Adjusted R-squared',1,TRUE)
a<-table.element(a, mysum$adj.r.squared)
a<-table.row.end(a)
a<-table.row.start(a)
a<-table.element(a, 'F-TEST (value)',1,TRUE)
a<-table.element(a, mysum$fstatistic[1])
a<-table.row.end(a)
a<-table.row.start(a)
a<-table.element(a, 'F-TEST (DF numerator)',1,TRUE)
a<-table.element(a, mysum$fstatistic[2])
a<-table.row.end(a)
a<-table.row.start(a)
a<-table.element(a, 'F-TEST (DF denominator)',1,TRUE)
a<-table.element(a, mysum$fstatistic[3])
a<-table.row.end(a)
a<-table.row.start(a)
a<-table.element(a, 'p-value',1,TRUE)
a<-table.element(a, 1-pf(mysum$fstatistic[1],mysum$fstatistic[2],mysum$fstatistic[3]))
a<-table.row.end(a)
a<-table.row.start(a)
a<-table.element(a, 'Multiple Linear Regression - Residual Statistics', 2, TRUE)
a<-table.row.end(a)
a<-table.row.start(a)
a<-table.element(a, 'Residual Standard Deviation',1,TRUE)
a<-table.element(a, mysum$sigma)
a<-table.row.end(a)
a<-table.row.start(a)
a<-table.element(a, 'Sum Squared Residuals',1,TRUE)
a<-table.element(a, sum(myerror*myerror))
a<-table.row.end(a)
a<-table.end(a)
table.save(a,file='mytable3.tab')
a<-table.start()
a<-table.row.start(a)
a<-table.element(a, 'Multiple Linear Regression - Actuals, Interpolation, and Residuals', 4, TRUE)
a<-table.row.end(a)
a<-table.row.start(a)
a<-table.element(a, 'Time or Index', 1, TRUE)
a<-table.element(a, 'Actuals', 1, TRUE)
a<-table.element(a, 'Interpolation
Forecast', 1, TRUE)
a<-table.element(a, 'Residuals
Prediction Error', 1, TRUE)
a<-table.row.end(a)
for (i in 1:n) {
a<-table.row.start(a)
a<-table.element(a,i, 1, TRUE)
a<-table.element(a,x[i])
a<-table.element(a,x[i]-mysum$resid[i])
a<-table.element(a,mysum$resid[i])
a<-table.row.end(a)
}
a<-table.end(a)
table.save(a,file='mytable4.tab')
if (n > n25) {
a<-table.start()
a<-table.row.start(a)
a<-table.element(a,'Goldfeld-Quandt test for Heteroskedasticity',4,TRUE)
a<-table.row.end(a)
a<-table.row.start(a)
a<-table.element(a,'p-values',header=TRUE)
a<-table.element(a,'Alternative Hypothesis',3,header=TRUE)
a<-table.row.end(a)
a<-table.row.start(a)
a<-table.element(a,'breakpoint index',header=TRUE)
a<-table.element(a,'greater',header=TRUE)
a<-table.element(a,'2-sided',header=TRUE)
a<-table.element(a,'less',header=TRUE)
a<-table.row.end(a)
for (mypoint in kp3:nmkm3) {
a<-table.row.start(a)
a<-table.element(a,mypoint,header=TRUE)
a<-table.element(a,gqarr[mypoint-kp3+1,1])
a<-table.element(a,gqarr[mypoint-kp3+1,2])
a<-table.element(a,gqarr[mypoint-kp3+1,3])
a<-table.row.end(a)
}
a<-table.end(a)
table.save(a,file='mytable5.tab')
a<-table.start()
a<-table.row.start(a)
a<-table.element(a,'Meta Analysis of Goldfeld-Quandt test for Heteroskedasticity',4,TRUE)
a<-table.row.end(a)
a<-table.row.start(a)
a<-table.element(a,'Description',header=TRUE)
a<-table.element(a,'# significant tests',header=TRUE)
a<-table.element(a,'% significant tests',header=TRUE)
a<-table.element(a,'OK/NOK',header=TRUE)
a<-table.row.end(a)
a<-table.row.start(a)
a<-table.element(a,'1% type I error level',header=TRUE)
a<-table.element(a,numsignificant1)
a<-table.element(a,numsignificant1/numgqtests)
if (numsignificant1/numgqtests < 0.01) dum <- 'OK' else dum <- 'NOK'
a<-table.element(a,dum)
a<-table.row.end(a)
a<-table.row.start(a)
a<-table.element(a,'5% type I error level',header=TRUE)
a<-table.element(a,numsignificant5)
a<-table.element(a,numsignificant5/numgqtests)
if (numsignificant5/numgqtests < 0.05) dum <- 'OK' else dum <- 'NOK'
a<-table.element(a,dum)
a<-table.row.end(a)
a<-table.row.start(a)
a<-table.element(a,'10% type I error level',header=TRUE)
a<-table.element(a,numsignificant10)
a<-table.element(a,numsignificant10/numgqtests)
if (numsignificant10/numgqtests < 0.1) dum <- 'OK' else dum <- 'NOK'
a<-table.element(a,dum)
a<-table.row.end(a)
a<-table.end(a)
table.save(a,file='mytable6.tab')
}