| Multiple Linear Regression - Estimated Regression Equation |
| Ipzb[t] = + 83.9746433207604 + 0.449803219171789Cvn[t] + 15.8344486602883M1[t] + 16.6232873000092M2[t] + 12.2457874767055M3[t] + 8.49751985477916M4[t] + 7.08868121505829M5[t] + 6.75848443423008M6[t] + 15.6974411424479M7[t] + 8.15647656299695M8[t] + 7.28570876437425M9[t] + 15.3939763863006M10[t] -1.13501967808283M11[t] + e[t] |
| Multiple Linear Regression - Ordinary Least Squares | |||||
| Variable | Parameter | S.D. | T-STAT H0: parameter = 0 | 2-tail p-value | 1-tail p-value |
| (Intercept) | 83.9746433207604 | 2.786635 | 30.1348 | 0 | 0 |
| Cvn | 0.449803219171789 | 0.055755 | 8.0675 | 0 | 0 |
| M1 | 15.8344486602883 | 2.908746 | 5.4437 | 2e-06 | 1e-06 |
| M2 | 16.6232873000092 | 2.907107 | 5.7182 | 1e-06 | 0 |
| M3 | 12.2457874767055 | 2.906591 | 4.2131 | 0.000113 | 5.7e-05 |
| M4 | 8.49751985477916 | 2.90915 | 2.921 | 0.005346 | 0.002673 |
| M5 | 7.08868121505829 | 2.907371 | 2.4382 | 0.018596 | 0.009298 |
| M6 | 6.75848443423008 | 2.909636 | 2.3228 | 0.02457 | 0.012285 |
| M7 | 15.6974411424479 | 2.910278 | 5.3938 | 2e-06 | 1e-06 |
| M8 | 8.15647656299695 | 2.909749 | 2.8032 | 0.007331 | 0.003665 |
| M9 | 7.28570876437425 | 2.907139 | 2.5061 | 0.015725 | 0.007862 |
| M10 | 15.3939763863006 | 2.905975 | 5.2974 | 3e-06 | 2e-06 |
| M11 | -1.13501967808283 | 2.905973 | -0.3906 | 0.697871 | 0.348936 |
| Multiple Linear Regression - Regression Statistics | |
| Multiple R | 0.882397287601617 |
| R-squared | 0.77862497316669 |
| Adjusted R-squared | 0.722103689719887 |
| F-TEST (value) | 13.7757836638569 |
| F-TEST (DF numerator) | 12 |
| F-TEST (DF denominator) | 47 |
| p-value | 1.33876243424425e-11 |
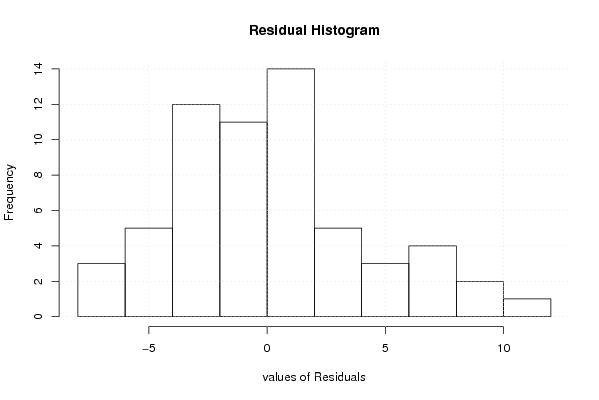
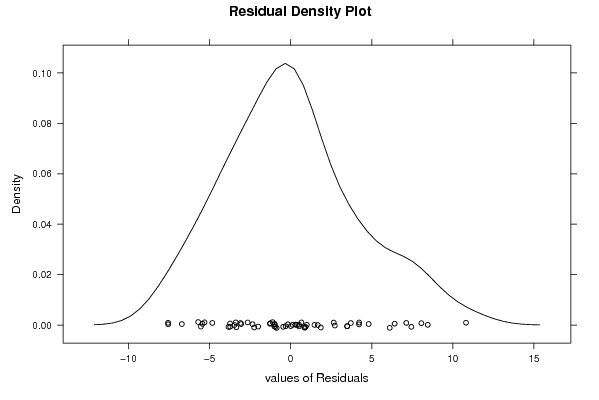
| Multiple Linear Regression - Residual Statistics | |
| Residual Standard Deviation | 4.59473754725227 |
| Sum Squared Residuals | 992.245817022102 |
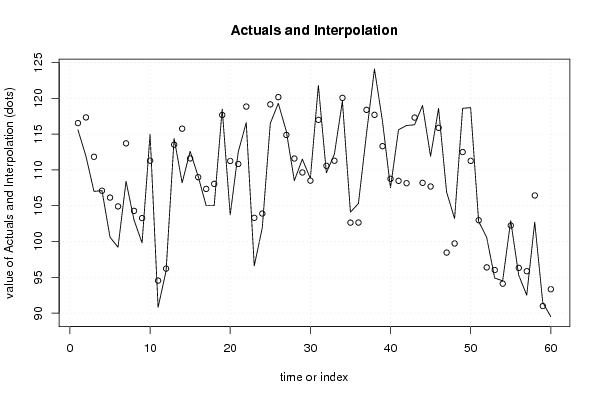
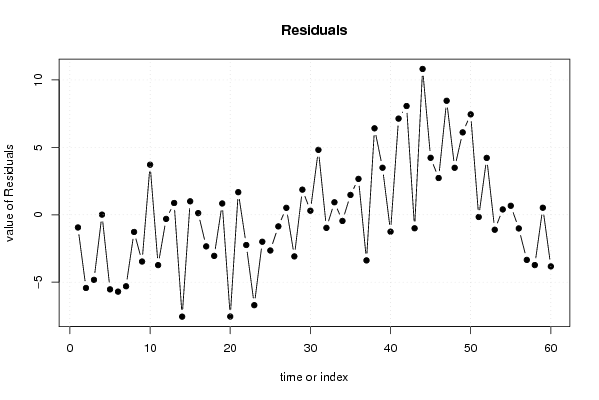
| Multiple Linear Regression - Actuals, Interpolation, and Residuals | |||
| Time or Index | Actuals | Interpolation Forecast | Residuals Prediction Error |
| 1 | 115.6 | 116.541771734239 | -0.941771734239318 |
| 2 | 111.9 | 117.330610373960 | -5.43061037396014 |
| 3 | 107 | 111.828602502727 | -4.82860250272701 |
| 4 | 107.1 | 107.090767798623 | 0.00923220137728752 |
| 5 | 100.6 | 106.131732378074 | -5.53173237807365 |
| 6 | 99.2 | 104.901929158902 | -5.70192915890184 |
| 7 | 108.4 | 113.705944901368 | -5.3059449013681 |
| 8 | 103 | 104.275806801396 | -1.27580680139567 |
| 9 | 99.8 | 103.270098037021 | -3.47009803702143 |
| 10 | 115 | 111.288405015113 | 3.71159498488658 |
| 11 | 90.8 | 94.534507341144 | -3.7345073411441 |
| 12 | 95.9 | 96.209290882233 | -0.309290882233061 |
| 13 | 114.4 | 113.528090165788 | 0.871909834211727 |
| 14 | 108.2 | 115.756299106859 | -7.55629910685888 |
| 15 | 112.6 | 111.603700893141 | 0.996299106858876 |
| 16 | 109.1 | 108.979941319144 | 0.120058680855773 |
| 17 | 105 | 107.346201069837 | -2.34620106983746 |
| 18 | 105 | 108.050551693104 | -3.05055169310437 |
| 19 | 118.5 | 117.664213230080 | 0.835786769920157 |
| 20 | 103.7 | 111.247756698558 | -7.54775669855839 |
| 21 | 112.5 | 110.826792119107 | 1.67320788089253 |
| 22 | 116.6 | 118.845099097199 | -2.24509909719948 |
| 23 | 96.6 | 103.305670114994 | -6.70567011499398 |
| 24 | 101.9 | 103.900925930071 | -2.00092593007065 |
| 25 | 116.5 | 119.150630405436 | -2.65063040543564 |
| 26 | 119.3 | 120.164370654742 | -0.864370654742411 |
| 27 | 115.4 | 114.887264393095 | 0.512735606904831 |
| 28 | 108.5 | 111.588799990341 | -3.08879999034060 |
| 29 | 111.5 | 109.640197487614 | 1.85980251238642 |
| 30 | 108.8 | 108.500354912276 | 0.299645087723842 |
| 31 | 121.8 | 116.989508401322 | 4.81049159867784 |
| 32 | 109.6 | 110.573051869801 | -0.973051869800714 |
| 33 | 112.2 | 111.276595338279 | 0.923404661720744 |
| 34 | 119.6 | 120.059567788963 | -0.459567788963312 |
| 35 | 104.1 | 102.630965286236 | 1.4690347137637 |
| 36 | 105.3 | 102.641476916390 | 2.65852308361035 |
| 37 | 115 | 118.385964932844 | -3.3859649328436 |
| 38 | 124.1 | 117.690452949298 | 6.40954705070242 |
| 39 | 116.8 | 113.312953125994 | 3.48704687400608 |
| 40 | 107.5 | 108.755039709558 | -1.25503970955833 |
| 41 | 115.6 | 108.470709117767 | 7.12929088223307 |
| 42 | 116.2 | 108.140512336939 | 8.05948766306128 |
| 43 | 116.3 | 117.304370654742 | -1.00437065474242 |
| 44 | 119 | 108.189094808190 | 10.8109051918098 |
| 45 | 111.9 | 107.678169584905 | 4.22183041509506 |
| 46 | 118.6 | 115.876397850666 | 2.72360214933432 |
| 47 | 106.9 | 98.4477953479387 | 8.45220465206135 |
| 48 | 103.2 | 99.717755991773 | 3.48224400822698 |
| 49 | 118.6 | 112.493542761693 | 6.10645723830683 |
| 50 | 118.7 | 111.258266915141 | 7.44173308485901 |
| 51 | 102.8 | 102.967479085043 | -0.167479085042776 |
| 52 | 100.6 | 96.3854511823341 | 4.21454881766586 |
| 53 | 94.9 | 96.0111599467084 | -1.11115994670838 |
| 54 | 94.5 | 94.106651898779 | 0.393348101221087 |
| 55 | 102.9 | 102.235962812487 | 0.664037187512518 |
| 56 | 95.3 | 96.314289822055 | -1.01428982205500 |
| 57 | 92.5 | 95.848344920687 | -3.3483449206869 |
| 58 | 102.7 | 106.430530248058 | -3.73053024805811 |
| 59 | 91.5 | 90.981061909687 | 0.518938090313036 |
| 60 | 89.5 | 93.3305502795336 | -3.83055027953362 |
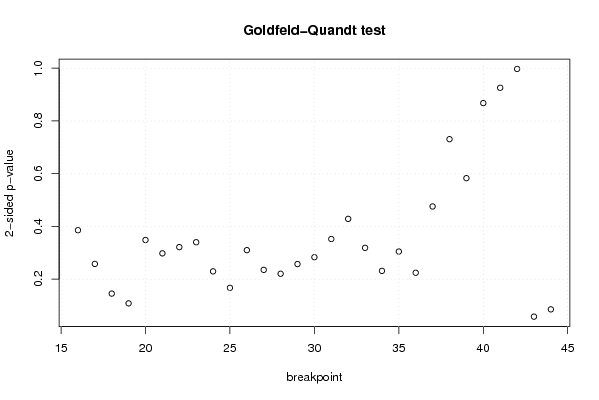
| Goldfeld-Quandt test for Heteroskedasticity | |||
| p-values | Alternative Hypothesis | ||
| breakpoint index | greater | 2-sided | less |
| 16 | 0.192835538361676 | 0.385671076723352 | 0.807164461638324 |
| 17 | 0.128877047446012 | 0.257754094892023 | 0.871122952553988 |
| 18 | 0.0726052416138662 | 0.145210483227732 | 0.927394758386134 |
| 19 | 0.0540805010827415 | 0.108161002165483 | 0.945919498917259 |
| 20 | 0.174250369044208 | 0.348500738088415 | 0.825749630955792 |
| 21 | 0.148977735100687 | 0.297955470201374 | 0.851022264899313 |
| 22 | 0.160738461632094 | 0.321476923264189 | 0.839261538367906 |
| 23 | 0.170019095669223 | 0.340038191338446 | 0.829980904330777 |
| 24 | 0.114827660040753 | 0.229655320081505 | 0.885172339959247 |
| 25 | 0.0835394255488194 | 0.167078851097639 | 0.91646057445118 |
| 26 | 0.154999450782601 | 0.309998901565201 | 0.8450005492174 |
| 27 | 0.117643465621823 | 0.235286931243647 | 0.882356534378177 |
| 28 | 0.110270396251308 | 0.220540792502615 | 0.889729603748692 |
| 29 | 0.128621244702281 | 0.257242489404562 | 0.871378755297719 |
| 30 | 0.141630597144501 | 0.283261194289002 | 0.858369402855499 |
| 31 | 0.176135333335317 | 0.352270666670633 | 0.823864666664683 |
| 32 | 0.214341570134370 | 0.428683140268739 | 0.78565842986563 |
| 33 | 0.159387849089173 | 0.318775698178345 | 0.840612150910827 |
| 34 | 0.115687907602501 | 0.231375815205002 | 0.884312092397499 |
| 35 | 0.152362383011397 | 0.304724766022793 | 0.847637616988603 |
| 36 | 0.112124202913979 | 0.224248405827958 | 0.887875797086021 |
| 37 | 0.237895322277685 | 0.47579064455537 | 0.762104677722315 |
| 38 | 0.365441590897366 | 0.730883181794732 | 0.634558409102634 |
| 39 | 0.291497784289026 | 0.582995568578051 | 0.708502215710974 |
| 40 | 0.566113915930408 | 0.867772168139184 | 0.433886084069592 |
| 41 | 0.537009323603977 | 0.925981352792047 | 0.462990676396023 |
| 42 | 0.501338247689561 | 0.997323504620878 | 0.498661752310439 |
| 43 | 0.971124520400416 | 0.0577509591991691 | 0.0288754795995845 |
| 44 | 0.957263291143931 | 0.0854734177121371 | 0.0427367088560685 |
| Meta Analysis of Goldfeld-Quandt test for Heteroskedasticity | |||
| Description | # significant tests | % significant tests | OK/NOK |
| 1% type I error level | 0 | 0 | OK |
| 5% type I error level | 0 | 0 | OK |
| 10% type I error level | 2 | 0.0689655172413793 | OK |