| Multiple Linear Regression - Estimated Regression Equation |
| Y[t] = -61.2630376829935 + 1.40627113005073X[t] + 13.2467444431871M1[t] + 7.91357507008057M2[t] + 7.41658892601371M3[t] + 2.76204361780485M4[t] + 0.583789724495387M5[t] + 3.66873901237363M6[t] + 4.0687525356061M7[t] + 1.47739688535246M8[t] -1.83149088257830M9[t] -5.53454530820887M10[t] -5.8656710635106M11[t] + e[t] |
| Multiple Linear Regression - Ordinary Least Squares | |||||
| Variable | Parameter | S.D. | T-STAT H0: parameter = 0 | 2-tail p-value | 1-tail p-value |
| (Intercept) | -61.2630376829935 | 10.518752 | -5.8242 | 0 | 0 |
| X | 1.40627113005073 | 0.046038 | 30.5457 | 0 | 0 |
| M1 | 13.2467444431871 | 9.750864 | 1.3585 | 0.180784 | 0.090392 |
| M2 | 7.91357507008057 | 9.740656 | 0.8124 | 0.420643 | 0.210321 |
| M3 | 7.41658892601371 | 9.719264 | 0.7631 | 0.449228 | 0.224614 |
| M4 | 2.76204361780485 | 9.698131 | 0.2848 | 0.777047 | 0.388524 |
| M5 | 0.583789724495387 | 9.691556 | 0.0602 | 0.952222 | 0.476111 |
| M6 | 3.66873901237363 | 9.691199 | 0.3786 | 0.706716 | 0.353358 |
| M7 | 4.0687525356061 | 9.691171 | 0.4198 | 0.676515 | 0.338257 |
| M8 | 1.47739688535246 | 9.693774 | 0.1524 | 0.879518 | 0.439759 |
| M9 | -1.83149088257830 | 9.705371 | -0.1887 | 0.851133 | 0.425567 |
| M10 | -5.53454530820887 | 9.698271 | -0.5707 | 0.57094 | 0.28547 |
| M11 | -5.8656710635106 | 9.69169 | -0.6052 | 0.54794 | 0.27397 |
| Multiple Linear Regression - Regression Statistics | |
| Multiple R | 0.976467560440171 |
| R-squared | 0.95348889659198 |
| Adjusted R-squared | 0.941613721253761 |
| F-TEST (value) | 80.2926162718081 |
| F-TEST (DF numerator) | 12 |
| F-TEST (DF denominator) | 47 |
| p-value | 0 |
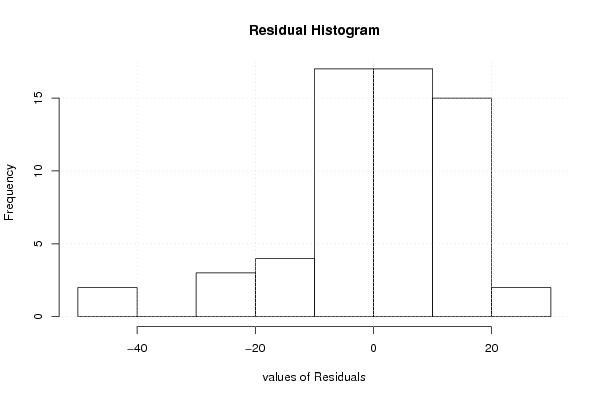
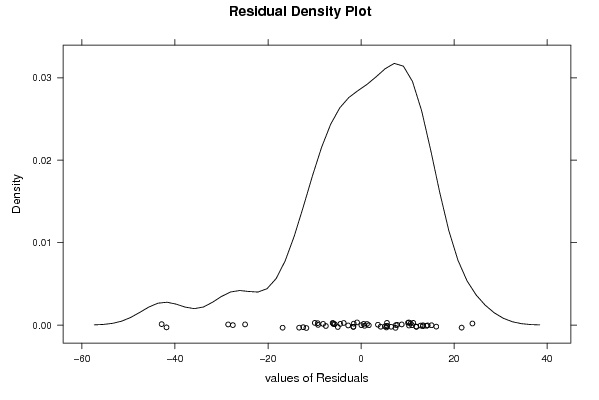
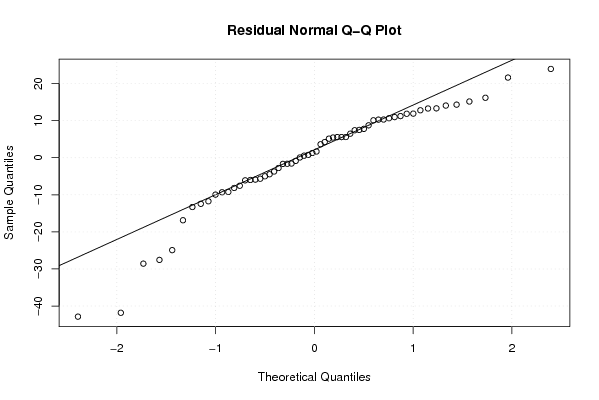
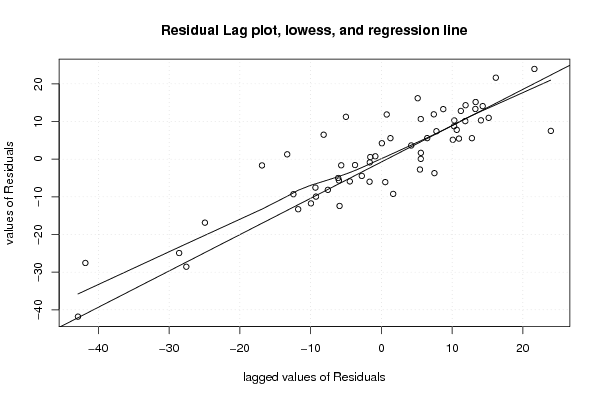
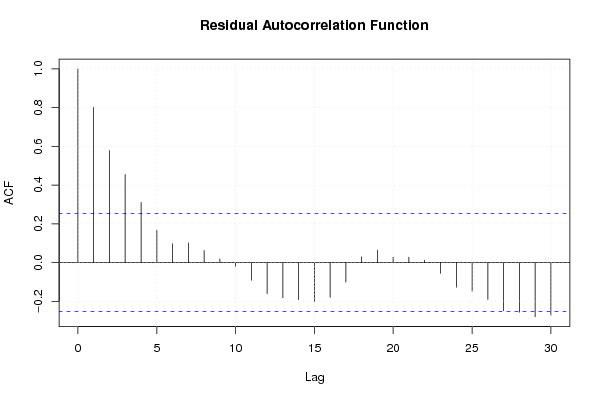
| Multiple Linear Regression - Residual Statistics | |
| Residual Standard Deviation | 15.3230850012099 |
| Sum Squared Residuals | 11035.4558958523 |
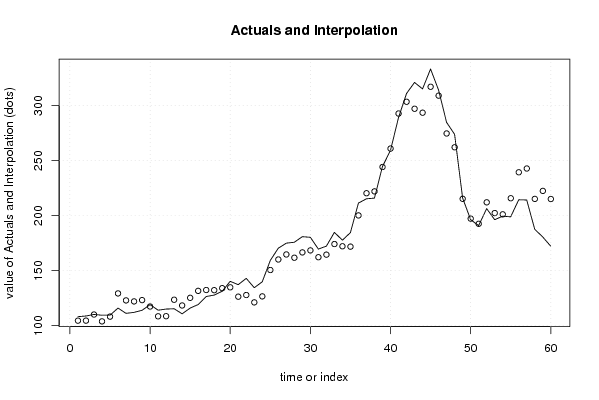
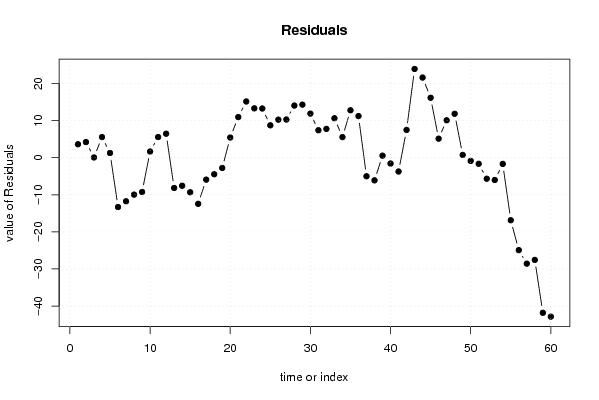
| Multiple Linear Regression - Actuals, Interpolation, and Residuals | |||
| Time or Index | Actuals | Interpolation Forecast | Residuals Prediction Error |
| 1 | 108.2 | 104.564124370698 | 3.63587562930221 |
| 2 | 108.8 | 104.574785291784 | 4.22521470821608 |
| 3 | 110.2 | 110.124765006935 | 0.0752349930646857 |
| 4 | 109.5 | 103.923321455671 | 5.57667854432937 |
| 5 | 109.5 | 108.213914760595 | 1.28608523940550 |
| 6 | 116 | 129.299134513122 | -13.2991345131221 |
| 7 | 111.2 | 122.949046612111 | -11.7490466121111 |
| 8 | 112.1 | 122.045216317918 | -9.94521631791834 |
| 9 | 114 | 123.23639616615 | -9.23639616614988 |
| 10 | 119.1 | 117.423935045443 | 1.67606495455677 |
| 11 | 114.1 | 108.514555396832 | 5.58544460316795 |
| 12 | 115.1 | 108.614514827135 | 6.48548517286534 |
| 13 | 115.4 | 123.548784626383 | -8.1487846263826 |
| 14 | 110.8 | 118.356242366281 | -7.55624236628117 |
| 15 | 116 | 125.312493211483 | -9.31249321148318 |
| 16 | 119.2 | 131.62686271767 | -12.4268627176700 |
| 17 | 126.5 | 132.401778197467 | -5.9017781974671 |
| 18 | 127.8 | 132.252303886229 | -4.45230388622864 |
| 19 | 131.3 | 134.058588539512 | -2.75858853951184 |
| 20 | 140.3 | 134.84228360138 | 5.45771639862005 |
| 21 | 137.3 | 126.330192652261 | 10.9698073477385 |
| 22 | 143 | 127.830341407819 | 15.1696585921814 |
| 23 | 134.5 | 121.170995567289 | 13.3290044327114 |
| 24 | 139.9 | 126.614785291784 | 13.2852147082160 |
| 25 | 159.3 | 150.549190323357 | 8.7508096766434 |
| 26 | 170.4 | 160.122494928788 | 10.2775050712121 |
| 27 | 175 | 164.688084852904 | 10.3119151470964 |
| 28 | 175.8 | 161.721064900756 | 14.0789350992444 |
| 29 | 180.9 | 166.574166657700 | 14.3258333423002 |
| 30 | 180.3 | 168.393471928532 | 11.9065280714676 |
| 31 | 169.6 | 162.184011140526 | 7.41598885947356 |
| 32 | 172.3 | 164.514604445450 | 7.78539555454966 |
| 33 | 184.8 | 174.143411073986 | 10.6565889260137 |
| 34 | 177.7 | 172.127882004417 | 5.57211799558337 |
| 35 | 184.6 | 171.796756249115 | 12.8032437508851 |
| 36 | 211.4 | 200.162765393437 | 11.2372346065628 |
| 37 | 215.3 | 220.300238373873 | -5.00023837387282 |
| 38 | 215.9 | 221.99842465102 | -6.09842465101997 |
| 39 | 244.7 | 244.14240370077 | 0.557596299230145 |
| 40 | 259.3 | 260.863179569332 | -1.56317956933206 |
| 41 | 289 | 292.71668702325 | -3.71668702325026 |
| 42 | 310.9 | 303.395500413402 | 7.50449958659752 |
| 43 | 321 | 297.045412512391 | 23.9545874876086 |
| 44 | 315.1 | 293.469667071102 | 21.6303329288978 |
| 45 | 333.2 | 317.020557887140 | 16.1794421128595 |
| 46 | 314.1 | 308.958062958353 | 5.14193704164743 |
| 47 | 284.7 | 274.595175855823 | 10.1048241441768 |
| 48 | 273.9 | 262.038695115669 | 11.8613048843307 |
| 49 | 216 | 215.23766230569 | 0.76233769430982 |
| 50 | 196.4 | 197.248052762127 | -0.84805276212709 |
| 51 | 190.9 | 192.532253227908 | -1.63225322790804 |
| 52 | 206.4 | 212.065571356572 | -5.66557135657176 |
| 53 | 196.3 | 202.293453360988 | -5.99345336098833 |
| 54 | 199.5 | 201.159589258714 | -1.6595892587144 |
| 55 | 198.9 | 215.762941195459 | -16.8629411954592 |
| 56 | 214.4 | 239.328228564149 | -24.9282285641491 |
| 57 | 214.2 | 242.769442220462 | -28.5694422204619 |
| 58 | 187.6 | 215.159778583969 | -27.5597785839689 |
| 59 | 180.6 | 222.422516930941 | -41.8225169309412 |
| 60 | 172.2 | 215.069239371975 | -42.8692393719749 |
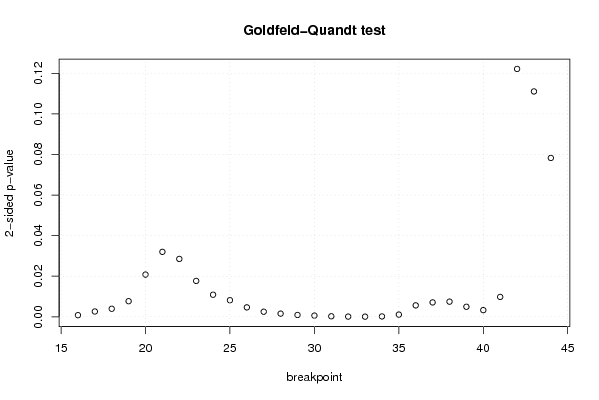
| Goldfeld-Quandt test for Heteroskedasticity | |||
| p-values | Alternative Hypothesis | ||
| breakpoint index | greater | 2-sided | less |
| 16 | 0.000407357992510603 | 0.000814715985021206 | 0.99959264200749 |
| 17 | 0.0013183694286268 | 0.0026367388572536 | 0.998681630571373 |
| 18 | 0.00198721038728226 | 0.00397442077456453 | 0.998012789612718 |
| 19 | 0.00385251187828831 | 0.00770502375657661 | 0.996147488121712 |
| 20 | 0.0104130641626156 | 0.0208261283252311 | 0.989586935837384 |
| 21 | 0.0160100781138721 | 0.0320201562277442 | 0.983989921886128 |
| 22 | 0.0142664671453903 | 0.0285329342907806 | 0.98573353285461 |
| 23 | 0.00884568990862177 | 0.0176913798172435 | 0.991154310091378 |
| 24 | 0.00544787519050626 | 0.0108957503810125 | 0.994552124809494 |
| 25 | 0.00409842368202886 | 0.00819684736405772 | 0.995901576317971 |
| 26 | 0.00233296523058913 | 0.00466593046117826 | 0.99766703476941 |
| 27 | 0.00126218236105666 | 0.00252436472211332 | 0.998737817638943 |
| 28 | 0.000793285039678112 | 0.00158657007935622 | 0.999206714960322 |
| 29 | 0.000460510389383422 | 0.000921020778766843 | 0.999539489610617 |
| 30 | 0.000303498939612387 | 0.000606997879224775 | 0.999696501060388 |
| 31 | 0.000134253499237871 | 0.000268506998475742 | 0.999865746500762 |
| 32 | 6.08751260054167e-05 | 0.000121750252010833 | 0.999939124873995 |
| 33 | 4.55975484705643e-05 | 9.11950969411286e-05 | 0.99995440245153 |
| 34 | 9.9320347869373e-05 | 0.000198640695738746 | 0.99990067965213 |
| 35 | 0.000556684135736519 | 0.00111336827147304 | 0.999443315864263 |
| 36 | 0.00282943437735838 | 0.00565886875471676 | 0.997170565622642 |
| 37 | 0.00355456483278249 | 0.00710912966556498 | 0.996445435167218 |
| 38 | 0.00373779845596837 | 0.00747559691193673 | 0.996262201544032 |
| 39 | 0.00248200918384885 | 0.0049640183676977 | 0.99751799081615 |
| 40 | 0.00165044702435918 | 0.00330089404871836 | 0.99834955297564 |
| 41 | 0.00490733924283078 | 0.00981467848566156 | 0.99509266075717 |
| 42 | 0.0610637032814655 | 0.122127406562931 | 0.938936296718534 |
| 43 | 0.0555231331771037 | 0.111046266354207 | 0.944476866822896 |
| 44 | 0.0391379886566149 | 0.0782759773132297 | 0.960862011343385 |
| Meta Analysis of Goldfeld-Quandt test for Heteroskedasticity | |||
| Description | # significant tests | % significant tests | OK/NOK |
| 1% type I error level | 21 | 0.724137931034483 | NOK |
| 5% type I error level | 26 | 0.896551724137931 | NOK |
| 10% type I error level | 27 | 0.93103448275862 | NOK |