| Multiple Linear Regression - Estimated Regression Equation |
| y[t] = + 4985.55555555556 -615.222222222222`x `[t] + e[t] |
| Multiple Linear Regression - Ordinary Least Squares | |||||
| Variable | Parameter | S.D. | T-STAT H0: parameter = 0 | 2-tail p-value | 1-tail p-value |
| (Intercept) | 4985.55555555556 | 97.258671 | 51.2608 | 0 | 0 |
| `x ` | -615.222222222222 | 147.041289 | -4.184 | 0.000127 | 6.4e-05 |
| Multiple Linear Regression - Regression Statistics | |
| Multiple R | 0.525031716755973 |
| R-squared | 0.275658303599724 |
| Adjusted R-squared | 0.259911744982327 |
| F-TEST (value) | 17.5059395705147 |
| F-TEST (DF numerator) | 1 |
| F-TEST (DF denominator) | 46 |
| p-value | 0.000127485491903001 |
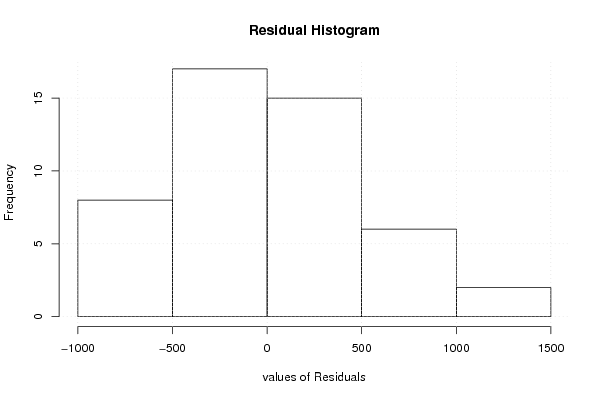
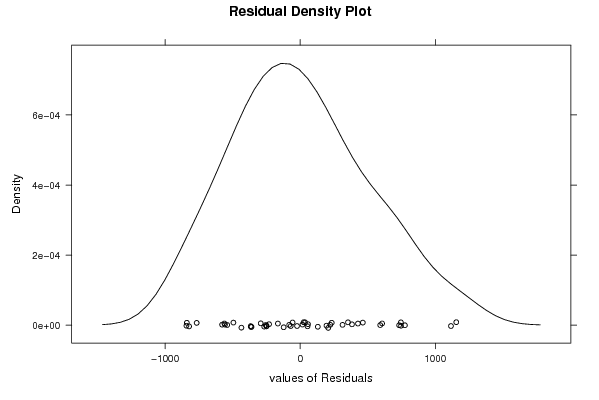
| Multiple Linear Regression - Residual Statistics | |
| Residual Standard Deviation | 505.370878303926 |
| Sum Squared Residuals | 11748387.3333333 |
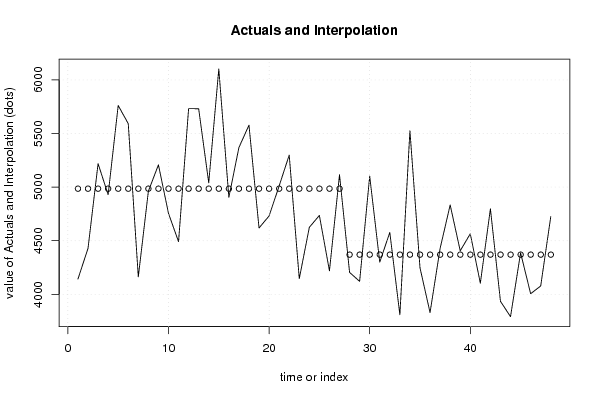
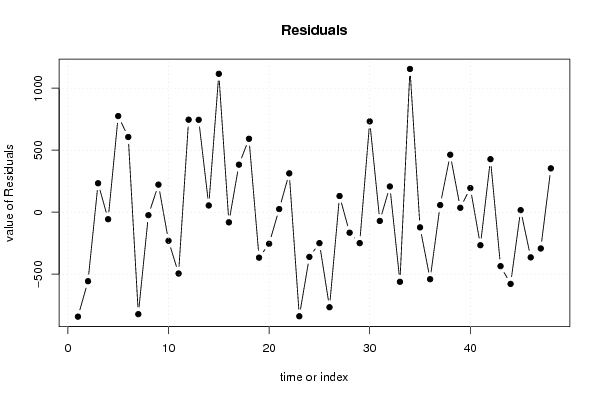
| Multiple Linear Regression - Actuals, Interpolation, and Residuals | |||
| Time or Index | Actuals | Interpolation Forecast | Residuals Prediction Error |
| 1 | 4143 | 4985.55555555555 | -842.555555555554 |
| 2 | 4429 | 4985.55555555556 | -556.555555555557 |
| 3 | 5219 | 4985.55555555556 | 233.444444444444 |
| 4 | 4929 | 4985.55555555556 | -56.5555555555557 |
| 5 | 5761 | 4985.55555555556 | 775.444444444444 |
| 6 | 5592 | 4985.55555555556 | 606.444444444444 |
| 7 | 4163 | 4985.55555555556 | -822.555555555556 |
| 8 | 4962 | 4985.55555555556 | -23.5555555555557 |
| 9 | 5208 | 4985.55555555556 | 222.444444444444 |
| 10 | 4755 | 4985.55555555556 | -230.555555555556 |
| 11 | 4491 | 4985.55555555556 | -494.555555555556 |
| 12 | 5732 | 4985.55555555556 | 746.444444444444 |
| 13 | 5731 | 4985.55555555556 | 745.444444444444 |
| 14 | 5040 | 4985.55555555556 | 54.4444444444443 |
| 15 | 6102 | 4985.55555555556 | 1116.44444444444 |
| 16 | 4904 | 4985.55555555556 | -81.5555555555557 |
| 17 | 5369 | 4985.55555555556 | 383.444444444444 |
| 18 | 5578 | 4985.55555555556 | 592.444444444444 |
| 19 | 4619 | 4985.55555555556 | -366.555555555556 |
| 20 | 4731 | 4985.55555555556 | -254.555555555556 |
| 21 | 5011 | 4985.55555555556 | 25.4444444444443 |
| 22 | 5299 | 4985.55555555556 | 313.444444444444 |
| 23 | 4146 | 4985.55555555556 | -839.555555555556 |
| 24 | 4625 | 4985.55555555556 | -360.555555555556 |
| 25 | 4736 | 4985.55555555556 | -249.555555555556 |
| 26 | 4219 | 4985.55555555556 | -766.555555555556 |
| 27 | 5116 | 4985.55555555556 | 130.444444444444 |
| 28 | 4205 | 4370.33333333333 | -165.333333333333 |
| 29 | 4121 | 4370.33333333333 | -249.333333333333 |
| 30 | 5103 | 4370.33333333333 | 732.666666666667 |
| 31 | 4300 | 4370.33333333333 | -70.3333333333333 |
| 32 | 4578 | 4370.33333333333 | 207.666666666667 |
| 33 | 3809 | 4370.33333333333 | -561.333333333333 |
| 34 | 5526 | 4370.33333333333 | 1155.66666666667 |
| 35 | 4248 | 4370.33333333333 | -122.333333333333 |
| 36 | 3830 | 4370.33333333333 | -540.333333333333 |
| 37 | 4428 | 4370.33333333333 | 57.6666666666667 |
| 38 | 4834 | 4370.33333333333 | 463.666666666667 |
| 39 | 4406 | 4370.33333333333 | 35.6666666666667 |
| 40 | 4565 | 4370.33333333333 | 194.666666666667 |
| 41 | 4104 | 4370.33333333333 | -266.333333333333 |
| 42 | 4798 | 4370.33333333333 | 427.666666666667 |
| 43 | 3935 | 4370.33333333333 | -435.333333333333 |
| 44 | 3792 | 4370.33333333333 | -578.333333333333 |
| 45 | 4387 | 4370.33333333333 | 16.6666666666667 |
| 46 | 4006 | 4370.33333333333 | -364.333333333333 |
| 47 | 4078 | 4370.33333333333 | -292.333333333333 |
| 48 | 4724 | 4370.33333333333 | 353.666666666667 |
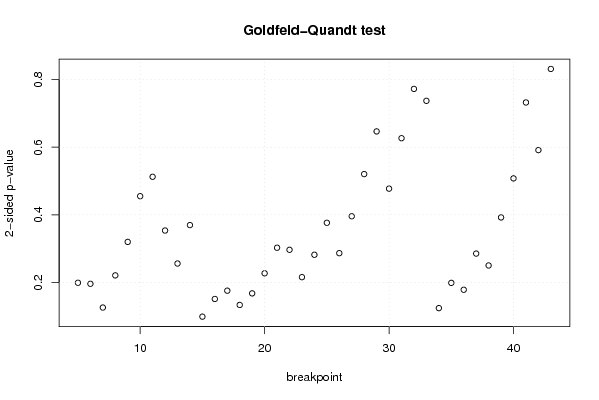
| Goldfeld-Quandt test for Heteroskedasticity | |||
| p-values | Alternative Hypothesis | ||
| breakpoint index | greater | 2-sided | less |
| 5 | 0.900413581018297 | 0.199172837963406 | 0.0995864189817031 |
| 6 | 0.901900296370626 | 0.196199407258747 | 0.0980997036293736 |
| 7 | 0.937050632985213 | 0.125898734029574 | 0.0629493670147869 |
| 8 | 0.889479059555258 | 0.221041880889484 | 0.110520940444742 |
| 9 | 0.839976894589292 | 0.320046210821416 | 0.160023105410708 |
| 10 | 0.77242078421633 | 0.45515843156734 | 0.22757921578367 |
| 11 | 0.743725454799302 | 0.512549090401397 | 0.256274545200699 |
| 12 | 0.823175927817014 | 0.353648144365972 | 0.176824072182986 |
| 13 | 0.87197496892194 | 0.256050062156121 | 0.128025031078060 |
| 14 | 0.815125860001184 | 0.369748279997632 | 0.184874139998816 |
| 15 | 0.950503115115813 | 0.0989937697683748 | 0.0494968848841874 |
| 16 | 0.924367850664382 | 0.151264298671235 | 0.0756321493356176 |
| 17 | 0.912119312713336 | 0.175761374573329 | 0.0878806872866645 |
| 18 | 0.933181699306396 | 0.133636601387208 | 0.0668183006936039 |
| 19 | 0.916065530942141 | 0.167868938115717 | 0.0839344690578587 |
| 20 | 0.886427119558052 | 0.227145760883896 | 0.113572880441948 |
| 21 | 0.84860999230043 | 0.302780015399142 | 0.151390007699571 |
| 22 | 0.851679808249105 | 0.29664038350179 | 0.148320191750895 |
| 23 | 0.892124883878942 | 0.215750232242116 | 0.107875116121058 |
| 24 | 0.858996976287674 | 0.282006047424652 | 0.141003023712326 |
| 25 | 0.811748460429618 | 0.376503079140764 | 0.188251539570382 |
| 26 | 0.856658324098416 | 0.286683351803167 | 0.143341675901584 |
| 27 | 0.802108779259104 | 0.395782441481793 | 0.197891220740896 |
| 28 | 0.739713738085988 | 0.520572523828024 | 0.260286261914012 |
| 29 | 0.676623379678843 | 0.646753240642314 | 0.323376620321157 |
| 30 | 0.76127808505849 | 0.47744382988302 | 0.23872191494151 |
| 31 | 0.686710841334627 | 0.626578317330746 | 0.313289158665373 |
| 32 | 0.613830144916773 | 0.772339710166453 | 0.386169855083227 |
| 33 | 0.631424768574376 | 0.737150462851249 | 0.368575231425624 |
| 34 | 0.937906627026837 | 0.124186745946326 | 0.062093372973163 |
| 35 | 0.90054782250219 | 0.198904354995621 | 0.0994521774978103 |
| 36 | 0.910746512307235 | 0.17850697538553 | 0.089253487692765 |
| 37 | 0.857265341424059 | 0.285469317151883 | 0.142734658575941 |
| 38 | 0.874826149406152 | 0.250347701187696 | 0.125173850593848 |
| 39 | 0.80382501368336 | 0.392349972633282 | 0.196174986316641 |
| 40 | 0.746069683598215 | 0.507860632803569 | 0.253930316401785 |
| 41 | 0.63386899575294 | 0.732262008494119 | 0.366131004247060 |
| 42 | 0.704292114552753 | 0.591415770894494 | 0.295707885447247 |
| 43 | 0.584311455975233 | 0.831377088049534 | 0.415688544024767 |
| Meta Analysis of Goldfeld-Quandt test for Heteroskedasticity | |||
| Description | # significant tests | % significant tests | OK/NOK |
| 1% type I error level | 0 | 0 | OK |
| 5% type I error level | 0 | 0 | OK |
| 10% type I error level | 1 | 0.0256410256410256 | OK |