| Multiple Linear Regression - Estimated Regression Equation |
| Y[t] = + 10.0677699988789 -0.472058006916226X[t] + 0.531978236551268Y1[t] + 1.74353611810301M1[t] -0.0263393303035021M2[t] -0.132935853998509M3[t] + 0.328484544608762M4[t] + 1.35657645102915M5[t] + 0.0193567875649408M6[t] + 0.990763891111386M7[t] -0.413799987410524M8[t] -0.0984001383469897M9[t] -0.059648819742844M10[t] + 0.557106126102756M11[t] -0.0280919064203895t + e[t] |
| Multiple Linear Regression - Ordinary Least Squares | |||||
| Variable | Parameter | S.D. | T-STAT H0: parameter = 0 | 2-tail p-value | 1-tail p-value |
| (Intercept) | 10.0677699988789 | 2.61959 | 3.8433 | 0.000312 | 0.000156 |
| X | -0.472058006916226 | 0.626745 | -0.7532 | 0.454491 | 0.227245 |
| Y1 | 0.531978236551268 | 0.113645 | 4.6811 | 1.9e-05 | 9e-06 |
| M1 | 1.74353611810301 | 0.812681 | 2.1454 | 0.036271 | 0.018135 |
| M2 | -0.0263393303035021 | 0.823564 | -0.032 | 0.9746 | 0.4873 |
| M3 | -0.132935853998509 | 0.812266 | -0.1637 | 0.870588 | 0.435294 |
| M4 | 0.328484544608762 | 0.81384 | 0.4036 | 0.688027 | 0.344014 |
| M5 | 1.35657645102915 | 0.81273 | 1.6692 | 0.100668 | 0.050334 |
| M6 | 0.0193567875649408 | 0.819414 | 0.0236 | 0.981238 | 0.490619 |
| M7 | 0.990763891111386 | 0.811743 | 1.2205 | 0.227375 | 0.113687 |
| M8 | -0.413799987410524 | 0.815706 | -0.5073 | 0.613943 | 0.306971 |
| M9 | -0.0984001383469897 | 0.81226 | -0.1211 | 0.904011 | 0.452005 |
| M10 | -0.059648819742844 | 0.814731 | -0.0732 | 0.941898 | 0.470949 |
| M11 | 0.557106126102756 | 0.816485 | 0.6823 | 0.497848 | 0.248924 |
| t | -0.0280919064203895 | 0.015916 | -1.765 | 0.083022 | 0.041511 |
| Multiple Linear Regression - Regression Statistics | |
| Multiple R | 0.853205467466476 |
| R-squared | 0.727959569714688 |
| Adjusted R-squared | 0.65994946214336 |
| F-TEST (value) | 10.7036967843524 |
| F-TEST (DF numerator) | 14 |
| F-TEST (DF denominator) | 56 |
| p-value | 3.20220516769609e-11 |
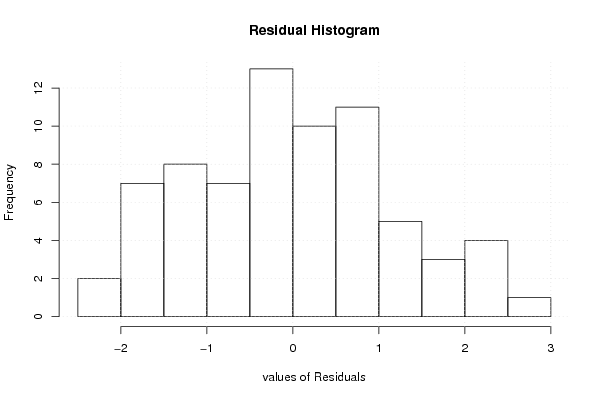
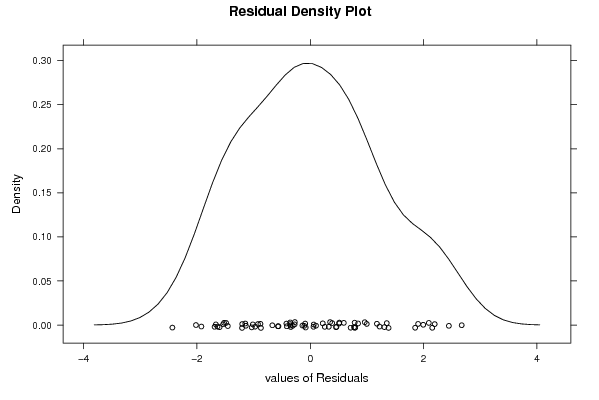
| Multiple Linear Regression - Residual Statistics | |
| Residual Standard Deviation | 1.33914328879777 |
| Sum Squared Residuals | 100.425065884198 |
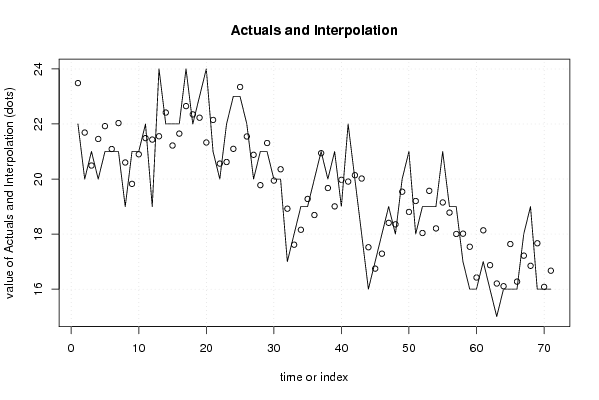
| Multiple Linear Regression - Actuals, Interpolation, and Residuals | |||
| Time or Index | Actuals | Interpolation Forecast | Residuals Prediction Error |
| 1 | 22 | 23.4867354146894 | -1.48673541468945 |
| 2 | 20 | 21.6887680598625 | -1.68876805986253 |
| 3 | 21 | 20.4901231566446 | 0.509876843355412 |
| 4 | 20 | 21.4554298853827 | -1.45542988538274 |
| 5 | 21 | 21.9234516488315 | -0.92345164883147 |
| 6 | 21 | 21.0901183154981 | -0.0901183154981386 |
| 7 | 21 | 22.0334335126242 | -1.03343351262419 |
| 8 | 19 | 20.6007777276819 | -1.60077772768189 |
| 9 | 21 | 19.8241291972225 | 1.17587080277750 |
| 10 | 21 | 20.8987450825088 | 0.101254917491207 |
| 11 | 22 | 21.487408121934 | 0.512591878065995 |
| 12 | 19 | 21.4341883259621 | -2.43418832596213 |
| 13 | 24 | 21.5536978279909 | 2.44630217200906 |
| 14 | 22 | 22.4156216559204 | -0.41562165592038 |
| 15 | 22 | 21.2169767527025 | 0.78302324729755 |
| 16 | 22 | 21.6503052448893 | 0.349694755110669 |
| 17 | 24 | 22.6503052448893 | 1.34969475511067 |
| 18 | 22 | 22.3489501481073 | -0.348950148107265 |
| 19 | 23 | 22.2283088721308 | 0.771691127869213 |
| 20 | 24 | 21.3276313237398 | 2.67236867626025 |
| 21 | 21 | 22.1469175029342 | -1.14691750293417 |
| 22 | 20 | 20.5616422054641 | -0.561642205464119 |
| 23 | 22 | 20.6183270083381 | 1.38167299166194 |
| 24 | 23 | 21.0970854489175 | 1.90291455108255 |
| 25 | 23 | 23.3445078971513 | -0.344507897151338 |
| 26 | 22 | 21.5465405423244 | 0.453459457675561 |
| 27 | 20 | 20.8798738756578 | -0.879873875657774 |
| 28 | 21 | 19.7771878878259 | 1.22281211217410 |
| 29 | 21 | 21.3091661243772 | -0.309166124377163 |
| 30 | 20 | 19.9438545544926 | 0.0561454455074385 |
| 31 | 20 | 20.3551915150674 | -0.35519151506735 |
| 32 | 17 | 18.9225357301251 | -1.92253573012505 |
| 33 | 18 | 17.6139089631144 | 0.386091036885607 |
| 34 | 19 | 18.1565466118494 | 0.843453388150584 |
| 35 | 19 | 19.2771878878259 | -0.277187887825895 |
| 36 | 20 | 18.6919898553027 | 1.30801014469725 |
| 37 | 21 | 20.9394123035366 | 0.0605876964633657 |
| 38 | 20 | 19.673423185261 | 0.326576814738997 |
| 39 | 21 | 19.0067565185943 | 1.99324348140566 |
| 40 | 19 | 19.9720632473325 | -0.972063247332488 |
| 41 | 22 | 19.9081067742300 | 2.09189322577005 |
| 42 | 20 | 20.1387299139992 | -0.138729913999155 |
| 43 | 18 | 20.0180886380227 | -2.01808863802268 |
| 44 | 16 | 17.5214763799778 | -1.52147637997784 |
| 45 | 17 | 16.7448278495185 | 0.255172150481548 |
| 46 | 18 | 17.2874654982535 | 0.712534501746525 |
| 47 | 19 | 18.4081067742300 | 0.591893225770047 |
| 48 | 18 | 18.3548869782581 | -0.354886978258075 |
| 49 | 20 | 19.5383529533894 | 0.461647046610574 |
| 50 | 21 | 18.8043420716651 | 2.19565792833494 |
| 51 | 18 | 19.2016318781009 | -1.20163187810093 |
| 52 | 19 | 18.039025660634 | 0.960974339365988 |
| 53 | 19 | 19.5710038971853 | -0.57100389718528 |
| 54 | 19 | 18.2056923273007 | 0.794307672699321 |
| 55 | 21 | 19.1490075244267 | 1.85099247557326 |
| 56 | 19 | 18.7803082125870 | 0.21969178741303 |
| 57 | 19 | 18.0036596821276 | 0.99634031787242 |
| 58 | 17 | 18.0143190943113 | -1.01431909431134 |
| 59 | 16 | 17.539025660634 | -1.53902566063401 |
| 60 | 16 | 16.4218493915596 | -0.4218493915596 |
| 61 | 17 | 18.1372936032422 | -1.13729360324222 |
| 62 | 16 | 16.8713044849666 | -0.871304484966586 |
| 63 | 15 | 16.2046378182999 | -1.20463781829992 |
| 64 | 16 | 16.1059880739355 | -0.105988073935537 |
| 65 | 16 | 17.6379663104868 | -1.63796631048680 |
| 66 | 16 | 16.2726547406022 | -0.272654740602203 |
| 67 | 18 | 17.2159699377283 | 0.784030062271741 |
| 68 | 19 | 16.8472706258885 | 2.15272937411151 |
| 69 | 16 | 17.6665568050829 | -1.66655680508291 |
| 70 | 16 | 16.0812815076129 | -0.0812815076128598 |
| 71 | 16 | 16.6699445470381 | -0.669944547038071 |
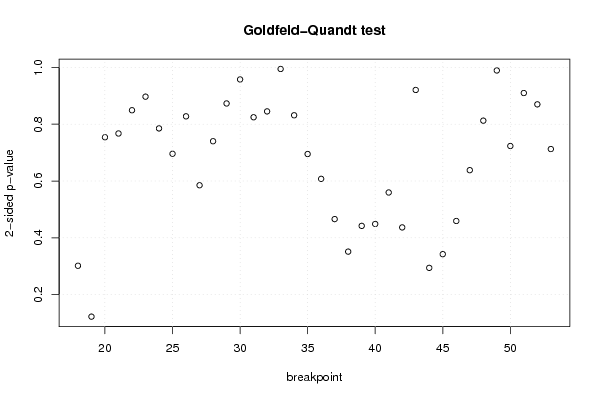
| Goldfeld-Quandt test for Heteroskedasticity | |||
| p-values | Alternative Hypothesis | ||
| breakpoint index | greater | 2-sided | less |
| 18 | 0.150678253935444 | 0.301356507870889 | 0.849321746064556 |
| 19 | 0.0610202015740142 | 0.122040403148028 | 0.938979798425986 |
| 20 | 0.377111645621302 | 0.754223291242605 | 0.622888354378698 |
| 21 | 0.383710211691481 | 0.767420423382961 | 0.616289788308519 |
| 22 | 0.575347474139889 | 0.849305051720223 | 0.424652525860111 |
| 23 | 0.55144900711186 | 0.897101985776279 | 0.448550992888139 |
| 24 | 0.607341139264424 | 0.785317721471151 | 0.392658860735576 |
| 25 | 0.652038342865371 | 0.695923314269259 | 0.347961657134629 |
| 26 | 0.586078614288065 | 0.82784277142387 | 0.413921385711935 |
| 27 | 0.707511456265643 | 0.584977087468713 | 0.292488543734356 |
| 28 | 0.62991538891208 | 0.74016922217584 | 0.37008461108792 |
| 29 | 0.563406635490622 | 0.873186729018756 | 0.436593364509378 |
| 30 | 0.478908669742914 | 0.957817339485828 | 0.521091330257086 |
| 31 | 0.41229153494486 | 0.82458306988972 | 0.58770846505514 |
| 32 | 0.577351901919543 | 0.845296196160915 | 0.422648098080457 |
| 33 | 0.497396649130457 | 0.994793298260914 | 0.502603350869543 |
| 34 | 0.41578634005736 | 0.83157268011472 | 0.58421365994264 |
| 35 | 0.347533118048977 | 0.695066236097955 | 0.652466881951023 |
| 36 | 0.303774971368919 | 0.607549942737838 | 0.696225028631081 |
| 37 | 0.232880581824874 | 0.465761163649748 | 0.767119418175126 |
| 38 | 0.175587396079851 | 0.351174792159702 | 0.824412603920149 |
| 39 | 0.22095670575049 | 0.44191341150098 | 0.77904329424951 |
| 40 | 0.224268803528788 | 0.448537607057576 | 0.775731196471212 |
| 41 | 0.279770989797058 | 0.559541979594116 | 0.720229010202942 |
| 42 | 0.218232578710617 | 0.436465157421234 | 0.781767421289383 |
| 43 | 0.539606909584226 | 0.920786180831548 | 0.460393090415774 |
| 44 | 0.853029762630654 | 0.293940474738693 | 0.146970237369346 |
| 45 | 0.828898071903608 | 0.342203856192785 | 0.171101928096392 |
| 46 | 0.770460078546877 | 0.459079842906246 | 0.229539921453123 |
| 47 | 0.680916393432516 | 0.638167213134969 | 0.319083606567484 |
| 48 | 0.593699594028872 | 0.812600811942255 | 0.406300405971128 |
| 49 | 0.494747405608444 | 0.989494811216888 | 0.505252594391556 |
| 50 | 0.638363157805637 | 0.723273684388727 | 0.361636842194363 |
| 51 | 0.545008134216622 | 0.909983731566755 | 0.454991865783378 |
| 52 | 0.435030829534142 | 0.870061659068284 | 0.564969170465858 |
| 53 | 0.356297295839447 | 0.712594591678894 | 0.643702704160553 |
| Meta Analysis of Goldfeld-Quandt test for Heteroskedasticity | |||
| Description | # significant tests | % significant tests | OK/NOK |
| 1% type I error level | 0 | 0 | OK |
| 5% type I error level | 0 | 0 | OK |
| 10% type I error level | 0 | 0 | OK |