| Multiple Linear Regression - Estimated Regression Equation |
| Y[t] = -73.1510170709155 + 1.59969233247625X[t] + 11.1606847397861M1[t] + 6.0224322816004M2[t] + 5.10915205278968M3[t] -0.50326670695449M4[t] -3.26028849504525M5[t] -0.0384486529738717M6[t] + 1.08645587982531M7[t] -1.87090434254156M8[t] -5.83979691027234M9[t] -8.29572307978729M10[t] -6.8884307248126M11[t] -0.601101440014372t + e[t] |
| Multiple Linear Regression - Ordinary Least Squares | |||||
| Variable | Parameter | S.D. | T-STAT H0: parameter = 0 | 2-tail p-value | 1-tail p-value |
| (Intercept) | -73.1510170709155 | 10.228513 | -7.1517 | 0 | 0 |
| X | 1.59969233247625 | 0.07222 | 22.1502 | 0 | 0 |
| M1 | 11.1606847397861 | 8.892078 | 1.2551 | 0.215772 | 0.107886 |
| M2 | 6.0224322816004 | 8.878778 | 0.6783 | 0.500983 | 0.250491 |
| M3 | 5.10915205278968 | 8.868485 | 0.5761 | 0.567354 | 0.283677 |
| M4 | -0.50326670695449 | 8.877189 | -0.0567 | 0.955036 | 0.477518 |
| M5 | -3.26028849504525 | 8.892682 | -0.3666 | 0.715579 | 0.35779 |
| M6 | -0.0384486529738717 | 8.88698 | -0.0043 | 0.996567 | 0.498283 |
| M7 | 1.08645587982531 | 8.861671 | 0.1226 | 0.902957 | 0.451478 |
| M8 | -1.87090434254156 | 8.876112 | -0.2108 | 0.83399 | 0.416995 |
| M9 | -5.83979691027234 | 8.911837 | -0.6553 | 0.515548 | 0.257774 |
| M10 | -8.29572307978729 | 8.861467 | -0.9362 | 0.354081 | 0.177041 |
| M11 | -6.8884307248126 | 8.821069 | -0.7809 | 0.438858 | 0.219429 |
| t | -0.601101440014372 | 0.182858 | -3.2873 | 0.001943 | 0.000971 |
| Multiple Linear Regression - Regression Statistics | |
| Multiple R | 0.98098756551415 |
| R-squared | 0.96233660369338 |
| Adjusted R-squared | 0.951692600389335 |
| F-TEST (value) | 90.4111522896355 |
| F-TEST (DF numerator) | 13 |
| F-TEST (DF denominator) | 46 |
| p-value | 0 |
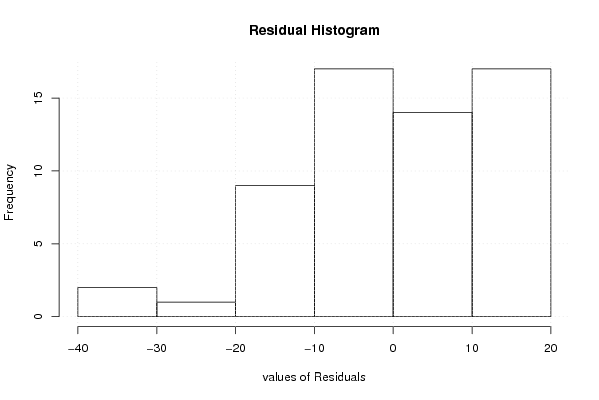
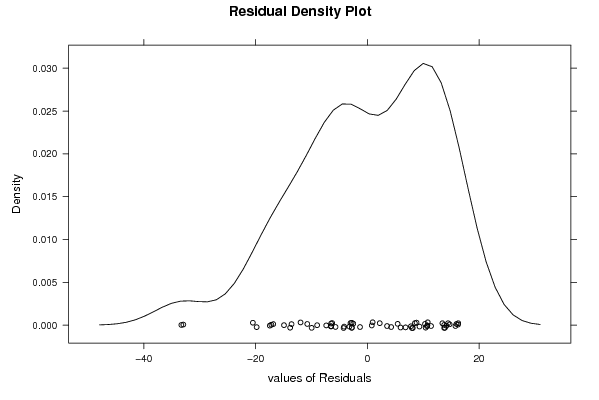
| Multiple Linear Regression - Residual Statistics | |
| Residual Standard Deviation | 13.9379095736167 |
| Sum Squared Residuals | 8936.20487098658 |
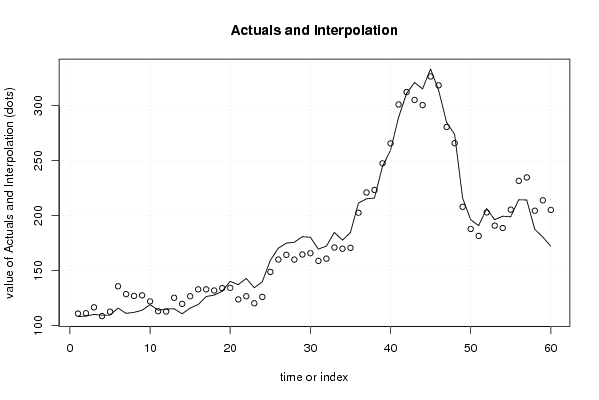
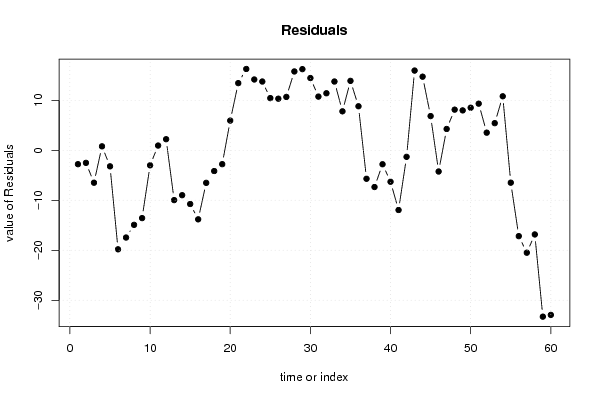
| Multiple Linear Regression - Actuals, Interpolation, and Residuals | |||
| Time or Index | Actuals | Interpolation Forecast | Residuals Prediction Error |
| 1 | 108.2 | 110.975184302529 | -2.77518430252921 |
| 2 | 108.8 | 111.314661267739 | -2.51466126773874 |
| 3 | 110.2 | 116.678956628562 | -6.47895662856164 |
| 4 | 109.5 | 108.705774863079 | 0.794225136920803 |
| 5 | 109.5 | 112.706236364365 | -3.20623636436480 |
| 6 | 116 | 135.803036622118 | -19.8030366221178 |
| 7 | 111.2 | 128.648316519017 | -17.4483165190166 |
| 8 | 112.1 | 127.009485655607 | -14.9094856556069 |
| 9 | 114 | 127.558507111786 | -13.5585071117857 |
| 10 | 119.1 | 122.101941003542 | -3.00194100354202 |
| 11 | 114.1 | 113.150008690397 | 0.94999130960277 |
| 12 | 115.1 | 112.878599412043 | 2.22140058795716 |
| 13 | 115.4 | 125.357813510786 | -9.95781351078607 |
| 14 | 110.8 | 119.778428845834 | -8.9784288458336 |
| 15 | 116 | 126.742416539133 | -10.7424165391326 |
| 16 | 119.2 | 133.006496532689 | -13.8064965326888 |
| 17 | 126.5 | 133.007727202784 | -6.50772720278385 |
| 18 | 127.8 | 131.949173240145 | -4.14917324014544 |
| 19 | 131.3 | 134.072668665406 | -2.7726686654065 |
| 20 | 140.3 | 134.353468600968 | 5.94653139903174 |
| 21 | 137.3 | 123.864612963061 | 13.4353870369390 |
| 22 | 143 | 126.726446983694 | 16.2735530163062 |
| 23 | 134.5 | 120.334022402511 | 14.165977597489 |
| 24 | 139.9 | 126.141443987566 | 13.7585560124337 |
| 25 | 159.3 | 148.858689014158 | 10.4413109858424 |
| 26 | 170.4 | 160.076073840206 | 10.3239261597943 |
| 27 | 175 | 164.320584568295 | 10.6794154317049 |
| 28 | 175.8 | 160.026695167508 | 15.7733048324919 |
| 29 | 180.9 | 164.667033601784 | 16.2329663982158 |
| 30 | 180.3 | 165.848048904613 | 14.4519510953875 |
| 31 | 169.6 | 158.853298034759 | 10.746701965241 |
| 32 | 172.3 | 160.893759536045 | 11.4062404639554 |
| 33 | 184.8 | 171.040934987081 | 13.7590650129191 |
| 34 | 177.7 | 169.903538176523 | 7.79646182347684 |
| 35 | 184.6 | 170.709729091483 | 13.8902709085165 |
| 36 | 211.4 | 202.592135695902 | 8.80786430409833 |
| 37 | 215.3 | 220.990211424807 | -5.69021142480705 |
| 38 | 215.9 | 223.249319188988 | -7.34931918898821 |
| 39 | 244.7 | 247.489984073031 | -2.78998407303071 |
| 40 | 259.3 | 265.591787326911 | -6.29178732691112 |
| 41 | 289 | 300.946218544731 | -11.9462185447312 |
| 42 | 310.9 | 312.20529554216 | -1.30529554215997 |
| 43 | 321 | 305.050575439059 | 15.9494245609412 |
| 44 | 315.1 | 300.372329143944 | 14.7276708560559 |
| 45 | 333.2 | 326.356458686495 | 6.84354131350461 |
| 46 | 314.1 | 318.340384846290 | -4.24038484628962 |
| 47 | 284.7 | 280.434021315325 | 4.26597868467522 |
| 48 | 273.9 | 265.765381044684 | 8.13461895531582 |
| 49 | 216 | 208.01810174772 | 7.98189825227993 |
| 50 | 196.4 | 187.881516857234 | 8.51848314276628 |
| 51 | 190.9 | 181.56805819098 | 9.33194180902012 |
| 52 | 206.4 | 202.869246109813 | 3.53075389018716 |
| 53 | 196.3 | 190.872784286336 | 5.42721571366405 |
| 54 | 199.5 | 188.694445690964 | 10.8055543090358 |
| 55 | 198.9 | 205.375141341759 | -6.47514134175912 |
| 56 | 214.4 | 231.570957063436 | -17.1709570634361 |
| 57 | 214.2 | 234.679486251577 | -20.4794862515770 |
| 58 | 187.6 | 204.427688989951 | -16.8276889899514 |
| 59 | 180.6 | 213.872218500284 | -33.2722185002835 |
| 60 | 172.2 | 205.122439859805 | -32.922439859805 |
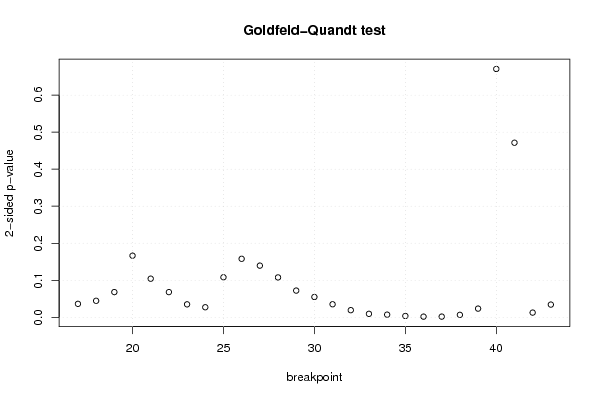
| Goldfeld-Quandt test for Heteroskedasticity | |||
| p-values | Alternative Hypothesis | ||
| breakpoint index | greater | 2-sided | less |
| 17 | 0.0182214542183781 | 0.0364429084367562 | 0.981778545781622 |
| 18 | 0.0223383754802711 | 0.0446767509605421 | 0.977661624519729 |
| 19 | 0.0340856820240459 | 0.0681713640480918 | 0.965914317975954 |
| 20 | 0.0832368997365275 | 0.166473799473055 | 0.916763100263473 |
| 21 | 0.0521837515871436 | 0.104367503174287 | 0.947816248412856 |
| 22 | 0.0340875532131432 | 0.0681751064262864 | 0.965912446786857 |
| 23 | 0.0175753554567922 | 0.0351507109135844 | 0.982424644543208 |
| 24 | 0.0136325892755490 | 0.0272651785510979 | 0.986367410724451 |
| 25 | 0.05412061301816 | 0.10824122603632 | 0.94587938698184 |
| 26 | 0.0790382883989726 | 0.158076576797945 | 0.920961711601027 |
| 27 | 0.0698140093499216 | 0.139628018699843 | 0.930185990650078 |
| 28 | 0.0538865463029298 | 0.107773092605860 | 0.94611345369707 |
| 29 | 0.0361243050540651 | 0.0722486101081303 | 0.963875694945935 |
| 30 | 0.0275220948747921 | 0.0550441897495842 | 0.972477905125208 |
| 31 | 0.0176591054635552 | 0.0353182109271103 | 0.982340894536445 |
| 32 | 0.0096869953941402 | 0.0193739907882804 | 0.99031300460586 |
| 33 | 0.00472693247756947 | 0.00945386495513895 | 0.99527306752243 |
| 34 | 0.00364272054589821 | 0.00728544109179642 | 0.996357279454102 |
| 35 | 0.00187561810696449 | 0.00375123621392898 | 0.998124381893035 |
| 36 | 0.000937080700437572 | 0.00187416140087514 | 0.999062919299562 |
| 37 | 0.00099217923653893 | 0.00198435847307786 | 0.999007820763461 |
| 38 | 0.00335499158042932 | 0.00670998316085863 | 0.99664500841957 |
| 39 | 0.0117907893164319 | 0.0235815786328639 | 0.988209210683568 |
| 40 | 0.335347773992306 | 0.670695547984612 | 0.664652226007694 |
| 41 | 0.764260316454262 | 0.471479367091476 | 0.235739683545738 |
| 42 | 0.993606485394936 | 0.0127870292101271 | 0.00639351460506355 |
| 43 | 0.9827755588013 | 0.034448882397402 | 0.017224441198701 |
| Meta Analysis of Goldfeld-Quandt test for Heteroskedasticity | |||
| Description | # significant tests | % significant tests | OK/NOK |
| 1% type I error level | 6 | 0.222222222222222 | NOK |
| 5% type I error level | 15 | 0.555555555555556 | NOK |
| 10% type I error level | 19 | 0.703703703703704 | NOK |