| Multiple Linear Regression - Estimated Regression Equation |
| Ipzb[t] = + 51.0021787849945 + 0.358521246109701Cvn[t] + 0.469136445952469Y3[t] -11.5251626923923M1[t] -13.1131829422958M2[t] -11.0020240353219M3[t] -0.0947099776184548M4[t] -7.1883374189211M5[t] -7.64246158228107M6[t] -3.61421218000356M7[t] -16.6986202389138M8[t] -15.4519614926944M9[t] -4.3902634927507M10[t] + 5.74431082396985M11[t] + 0.0569955207934599t + e[t] |
| Multiple Linear Regression - Ordinary Least Squares | |||||
| Variable | Parameter | S.D. | T-STAT H0: parameter = 0 | 2-tail p-value | 1-tail p-value |
| (Intercept) | 51.0021787849945 | 8.636948 | 5.9051 | 1e-06 | 0 |
| Cvn | 0.358521246109701 | 0.060597 | 5.9165 | 1e-06 | 0 |
| Y3 | 0.469136445952469 | 0.097855 | 4.7942 | 2.1e-05 | 1e-05 |
| M1 | -11.5251626923923 | 2.71509 | -4.2449 | 0.000118 | 5.9e-05 |
| M2 | -13.1131829422958 | 2.708507 | -4.8415 | 1.8e-05 | 9e-06 |
| M3 | -11.0020240353219 | 2.456632 | -4.4785 | 5.7e-05 | 2.8e-05 |
| M4 | -0.0947099776184548 | 2.313072 | -0.0409 | 0.967533 | 0.483767 |
| M5 | -7.1883374189211 | 2.284485 | -3.1466 | 0.003034 | 0.001517 |
| M6 | -7.64246158228107 | 2.260646 | -3.3807 | 0.001573 | 0.000786 |
| M7 | -3.61421218000356 | 2.49769 | -1.447 | 0.155314 | 0.077657 |
| M8 | -16.6986202389138 | 2.270694 | -7.354 | 0 | 0 |
| M9 | -15.4519614926944 | 2.264783 | -6.8227 | 0 | 0 |
| M10 | -4.3902634927507 | 2.771358 | -1.5842 | 0.12066 | 0.06033 |
| M11 | 5.74431082396985 | 2.379751 | 2.4138 | 0.020224 | 0.010112 |
| t | 0.0569955207934599 | 0.034523 | 1.6509 | 0.106214 | 0.053107 |
| Multiple Linear Regression - Regression Statistics | |
| Multiple R | 0.945402534098933 |
| R-squared | 0.893785951480684 |
| Adjusted R-squared | 0.858381268640912 |
| F-TEST (value) | 25.2448512397531 |
| F-TEST (DF numerator) | 14 |
| F-TEST (DF denominator) | 42 |
| p-value | 5.55111512312578e-16 |
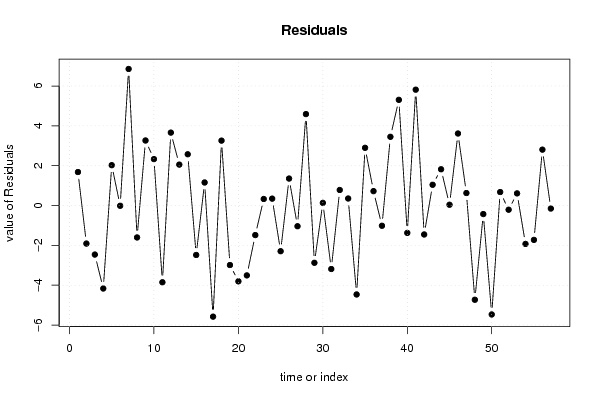
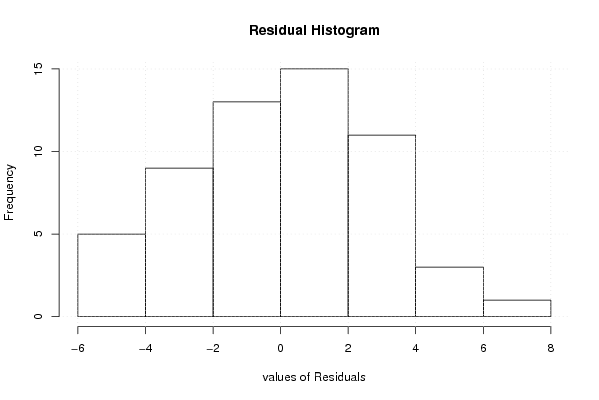
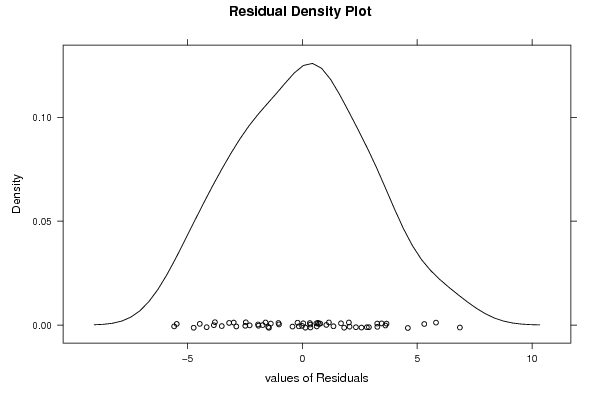
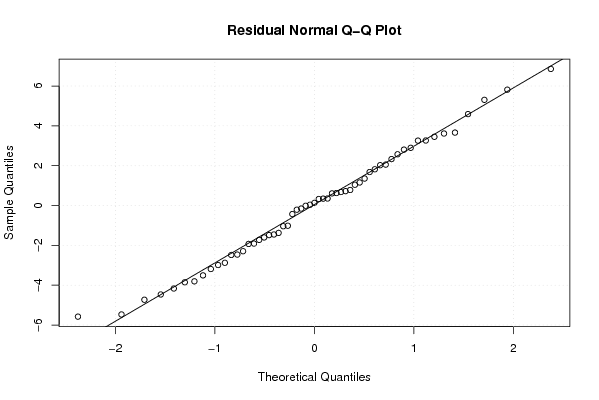
| Multiple Linear Regression - Residual Statistics | |
| Residual Standard Deviation | 3.33903353153817 |
| Sum Squared Residuals | 468.264086838924 |
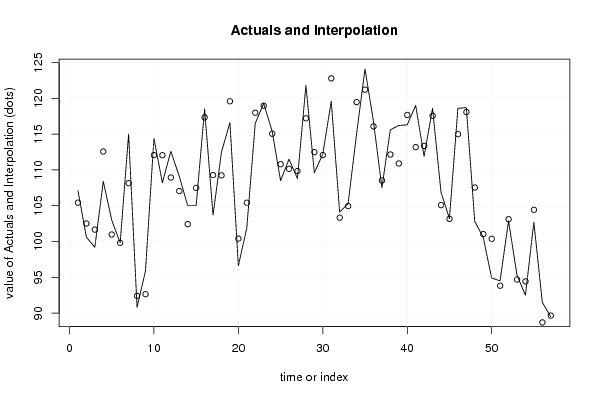
| Multiple Linear Regression - Actuals, Interpolation, and Residuals | |||
| Time or Index | Actuals | Interpolation Forecast | Residuals Prediction Error |
| 1 | 107.1 | 105.418125264066 | 1.68187473593373 |
| 2 | 100.6 | 102.509816931042 | -1.90981693104196 |
| 3 | 99.2 | 101.662160281423 | -2.46216028142278 |
| 4 | 108.4 | 112.565827130682 | -4.16582713068201 |
| 5 | 103 | 100.974019077821 | 2.02598092217896 |
| 6 | 99.8 | 99.8125430370881 | -0.0125430370881479 |
| 7 | 115 | 108.1421390137 | 6.85786098630009 |
| 8 | 90.8 | 92.402129044385 | -1.60212904438496 |
| 9 | 95.9 | 92.6347721796816 | 3.26522782031844 |
| 10 | 114.4 | 112.067459791058 | 2.33254020894176 |
| 11 | 108.2 | 112.053195624074 | -3.85319562407355 |
| 12 | 112.6 | 108.937736818310 | 3.66226318169039 |
| 13 | 109.1 | 107.044897012106 | 2.05510298789429 |
| 14 | 105 | 102.425965695036 | 2.57403430496448 |
| 15 | 105 | 107.482919351046 | -2.48291935104603 |
| 16 | 118.5 | 117.343033237874 | 1.15696676212616 |
| 17 | 103.7 | 109.279245004234 | -5.57924500423379 |
| 18 | 112.5 | 109.240637607777 | 3.25936239222302 |
| 19 | 116.6 | 119.587520301984 | -2.98752030198435 |
| 20 | 96.6 | 100.405635105212 | -3.80563510521238 |
| 21 | 101.9 | 105.407464601275 | -3.50746460127532 |
| 22 | 116.5 | 117.983539930475 | -1.48353993047498 |
| 23 | 119.3 | 118.971641471994 | 0.328358528005538 |
| 24 | 115.4 | 115.053706840147 | 0.346293159853243 |
| 25 | 108.5 | 110.793453025564 | -2.29345302556367 |
| 26 | 111.5 | 110.145784849789 | 1.35421515021108 |
| 27 | 108.8 | 109.838968895344 | -1.03896889534417 |
| 28 | 121.8 | 117.207715750659 | 4.59228424934067 |
| 29 | 109.6 | 112.474796283282 | -2.87479628328181 |
| 30 | 112.2 | 112.065823598028 | 0.134176401972424 |
| 31 | 119.6 | 122.787624187645 | -3.18762418764521 |
| 32 | 104.1 | 103.319704516689 | 0.780295483311092 |
| 33 | 105.3 | 104.946810427904 | 0.353189572096055 |
| 34 | 115 | 119.465409399467 | -4.46540939946741 |
| 35 | 124.1 | 121.202244212556 | 2.89775578744385 |
| 36 | 116.8 | 116.077892644523 | 0.722107355477284 |
| 37 | 107.5 | 108.515010755665 | -1.01501075566537 |
| 38 | 115.6 | 112.149430799997 | 3.45056920000292 |
| 39 | 116.2 | 110.892889172311 | 5.30711082768863 |
| 40 | 116.3 | 117.673490426505 | -1.37349042650517 |
| 41 | 119 | 113.182039356827 | 5.81796064317297 |
| 42 | 111.9 | 113.353209578720 | -1.45320957871975 |
| 43 | 118.6 | 117.557072395608 | 1.04292760439208 |
| 44 | 106.9 | 105.079285769343 | 1.82071423065660 |
| 45 | 103.2 | 103.159627643927 | 0.0403723560733419 |
| 46 | 118.6 | 114.983590878999 | 3.61640912100062 |
| 47 | 118.7 | 118.072918691376 | 0.62708130862416 |
| 48 | 102.8 | 107.530663697021 | -4.73066369702092 |
| 49 | 100.6 | 101.028513942599 | -0.428513942598980 |
| 50 | 94.9 | 100.369001724137 | -5.46900172413651 |
| 51 | 94.5 | 93.8230622998756 | 0.676937700124361 |
| 52 | 102.9 | 103.109933454280 | -0.209933454279638 |
| 53 | 95.3 | 94.6899002778363 | 0.610099722163675 |
| 54 | 92.5 | 94.4277861783875 | -1.92778617838755 |
| 55 | 102.7 | 104.425644101063 | -1.72564410106262 |
| 56 | 91.5 | 88.6932455643704 | 2.80675443562964 |
| 57 | 89.5 | 89.6513251472125 | -0.151325147212517 |
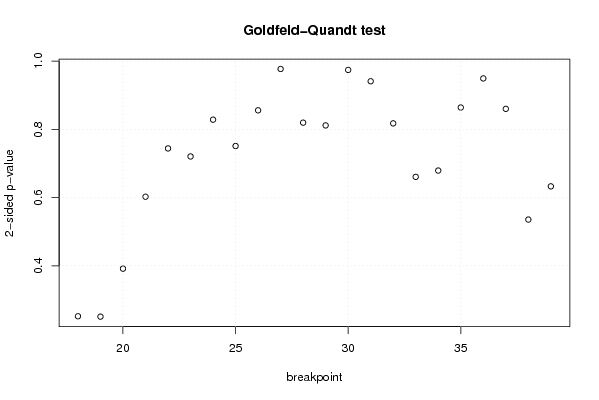
| Goldfeld-Quandt test for Heteroskedasticity | |||
| p-values | Alternative Hypothesis | ||
| breakpoint index | greater | 2-sided | less |
| 18 | 0.873847963918947 | 0.252304072162105 | 0.126152036081052 |
| 19 | 0.874428091373619 | 0.251143817252762 | 0.125571908626381 |
| 20 | 0.804084304750084 | 0.391831390499832 | 0.195915695249916 |
| 21 | 0.698659613108289 | 0.602680773783423 | 0.301340386891711 |
| 22 | 0.627872981234583 | 0.744254037530835 | 0.372127018765417 |
| 23 | 0.639654982627519 | 0.720690034744963 | 0.360345017372481 |
| 24 | 0.585742407374648 | 0.828515185250703 | 0.414257592625352 |
| 25 | 0.624379061851658 | 0.751241876296683 | 0.375620938148342 |
| 26 | 0.572057531329474 | 0.855884937341051 | 0.427942468670525 |
| 27 | 0.488569532841829 | 0.977139065683659 | 0.511430467158171 |
| 28 | 0.590148867815914 | 0.819702264368172 | 0.409851132184086 |
| 29 | 0.594170352428188 | 0.811659295143624 | 0.405829647571812 |
| 30 | 0.5128899053316 | 0.9742201893368 | 0.4871100946684 |
| 31 | 0.470528397910771 | 0.941056795821542 | 0.529471602089229 |
| 32 | 0.408832667395718 | 0.817665334791437 | 0.591167332604282 |
| 33 | 0.330428305808291 | 0.660856611616582 | 0.669571694191709 |
| 34 | 0.660317441055427 | 0.679365117889147 | 0.339682558944573 |
| 35 | 0.567947831169296 | 0.864104337661407 | 0.432052168830704 |
| 36 | 0.525323698111024 | 0.949352603777951 | 0.474676301888976 |
| 37 | 0.569887932728465 | 0.86022413454307 | 0.430112067271535 |
| 38 | 0.732149409188331 | 0.535701181623338 | 0.267850590811669 |
| 39 | 0.683462583639897 | 0.633074832720206 | 0.316537416360103 |
| Meta Analysis of Goldfeld-Quandt test for Heteroskedasticity | |||
| Description | # significant tests | % significant tests | OK/NOK |
| 1% type I error level | 0 | 0 | OK |
| 5% type I error level | 0 | 0 | OK |
| 10% type I error level | 0 | 0 | OK |