| Multiple Linear Regression - Estimated Regression Equation |
| Y[t] = + 18279.6417582418 -946.104395604395X[t] + 1908.22637362637M1[t] + 4080.77912087912M2[t] -7.22087912088476M3[t] -6466.62087912088M4[t] + 11876.7791208791M5[t] + 9079.37912087912M6[t] + 12321.1791208791M7[t] + 9625.8M8[t] + 6215.4M9[t] + 7320.2M10[t] + 1254.40000000000M11[t] + e[t] |
| Multiple Linear Regression - Ordinary Least Squares | |||||
| Variable | Parameter | S.D. | T-STAT H0: parameter = 0 | 2-tail p-value | 1-tail p-value |
| (Intercept) | 18279.6417582418 | 906.255645 | 20.1705 | 0 | 0 |
| X | -946.104395604395 | 563.482576 | -1.679 | 0.099645 | 0.049823 |
| M1 | 1908.22637362637 | 1189.112908 | 1.6047 | 0.11511 | 0.057555 |
| M2 | 4080.77912087912 | 1246.473047 | 3.2739 | 0.001972 | 0.000986 |
| M3 | -7.22087912088476 | 1246.473047 | -0.0058 | 0.995402 | 0.497701 |
| M4 | -6466.62087912088 | 1246.473047 | -5.1879 | 4e-06 | 2e-06 |
| M5 | 11876.7791208791 | 1246.473047 | 9.5283 | 0 | 0 |
| M6 | 9079.37912087912 | 1246.473047 | 7.2841 | 0 | 0 |
| M7 | 12321.1791208791 | 1246.473047 | 9.8848 | 0 | 0 |
| M8 | 9625.8 | 1241.368017 | 7.7542 | 0 | 0 |
| M9 | 6215.4 | 1241.368017 | 5.0069 | 8e-06 | 4e-06 |
| M10 | 7320.2 | 1241.368017 | 5.8969 | 0 | 0 |
| M11 | 1254.40000000000 | 1241.368017 | 1.0105 | 0.317324 | 0.158662 |
| Multiple Linear Regression - Regression Statistics | |
| Multiple R | 0.951725983616065 |
| R-squared | 0.905782347889966 |
| Adjusted R-squared | 0.882227934862457 |
| F-TEST (value) | 38.4548894014946 |
| F-TEST (DF numerator) | 12 |
| F-TEST (DF denominator) | 48 |
| p-value | 0 |
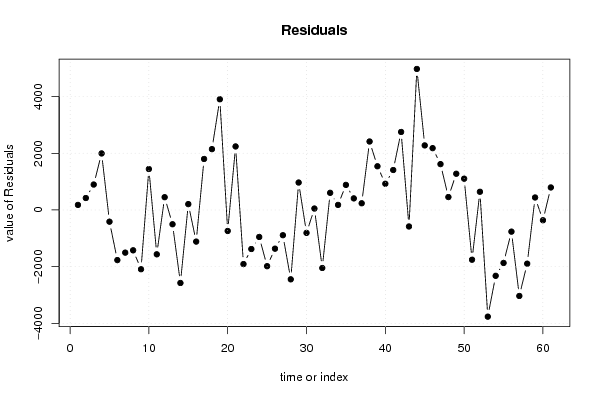
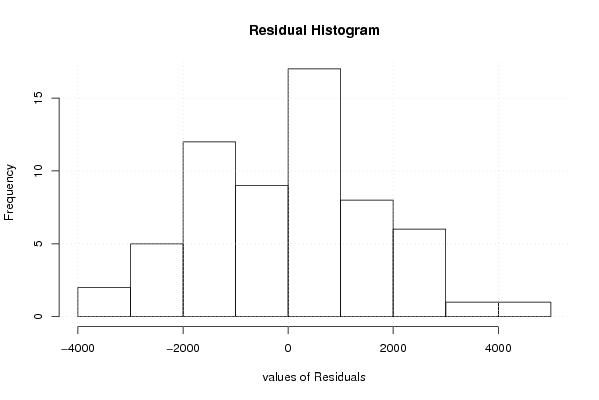
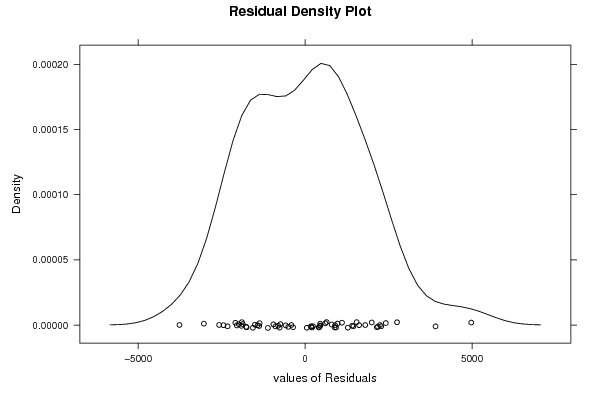
| Multiple Linear Regression - Residual Statistics | |
| Residual Standard Deviation | 1962.77517338917 |
| Sum Squared Residuals | 184919346.301099 |
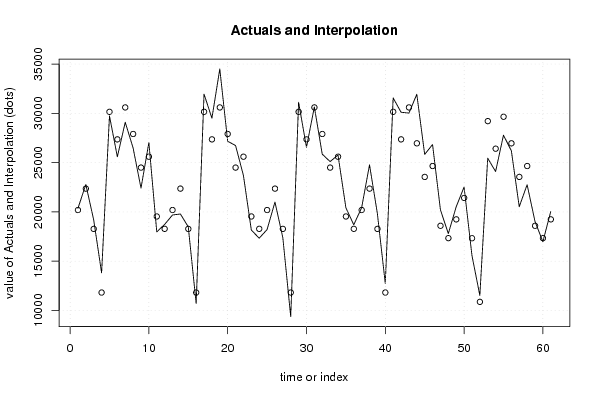
| Multiple Linear Regression - Actuals, Interpolation, and Residuals | |||
| Time or Index | Actuals | Interpolation Forecast | Residuals Prediction Error |
| 1 | 20366 | 20187.8681318682 | 178.131868131848 |
| 2 | 22782 | 22360.4208791209 | 421.579120879116 |
| 3 | 19169 | 18272.4208791209 | 896.579120879119 |
| 4 | 13807 | 11813.0208791209 | 1993.97912087913 |
| 5 | 29743 | 30156.4208791209 | -413.420879120878 |
| 6 | 25591 | 27359.0208791209 | -1768.02087912088 |
| 7 | 29096 | 30600.8208791209 | -1504.82087912089 |
| 8 | 26482 | 27905.4417582418 | -1423.44175824175 |
| 9 | 22405 | 24495.0417582418 | -2090.04175824175 |
| 10 | 27044 | 25599.8417582418 | 1444.15824175824 |
| 11 | 17970 | 19534.0417582418 | -1564.04175824175 |
| 12 | 18730 | 18279.6417582418 | 450.358241758241 |
| 13 | 19684 | 20187.8681318681 | -503.868131868128 |
| 14 | 19785 | 22360.4208791209 | -2575.42087912088 |
| 15 | 18479 | 18272.4208791209 | 206.579120879122 |
| 16 | 10698 | 11813.0208791209 | -1115.02087912088 |
| 17 | 31956 | 30156.4208791209 | 1799.57912087912 |
| 18 | 29506 | 27359.0208791209 | 2146.97912087912 |
| 19 | 34506 | 30600.8208791209 | 3905.17912087912 |
| 20 | 27165 | 27905.4417582418 | -740.441758241761 |
| 21 | 26736 | 24495.0417582418 | 2240.95824175824 |
| 22 | 23691 | 25599.8417582418 | -1908.84175824176 |
| 23 | 18157 | 19534.0417582418 | -1377.04175824176 |
| 24 | 17328 | 18279.6417582418 | -951.641758241757 |
| 25 | 18205 | 20187.8681318681 | -1982.86813186813 |
| 26 | 20995 | 22360.4208791209 | -1365.42087912088 |
| 27 | 17382 | 18272.4208791209 | -890.420879120877 |
| 28 | 9367 | 11813.0208791209 | -2446.02087912088 |
| 29 | 31124 | 30156.4208791209 | 967.579120879122 |
| 30 | 26551 | 27359.0208791209 | -808.02087912088 |
| 31 | 30651 | 30600.8208791209 | 50.1791208791221 |
| 32 | 25859 | 27905.4417582418 | -2046.44175824176 |
| 33 | 25100 | 24495.0417582418 | 604.95824175824 |
| 34 | 25778 | 25599.8417582418 | 178.158241758242 |
| 35 | 20418 | 19534.0417582418 | 883.95824175824 |
| 36 | 18688 | 18279.6417582418 | 408.358241758243 |
| 37 | 20424 | 20187.8681318681 | 236.131868131871 |
| 38 | 24776 | 22360.4208791209 | 2415.57912087912 |
| 39 | 19814 | 18272.4208791209 | 1541.57912087912 |
| 40 | 12738 | 11813.0208791209 | 924.979120879121 |
| 41 | 31566 | 30156.4208791209 | 1409.57912087912 |
| 42 | 30111 | 27359.0208791209 | 2751.97912087912 |
| 43 | 30019 | 30600.8208791209 | -581.820879120878 |
| 44 | 31934 | 26959.3373626374 | 4974.66263736264 |
| 45 | 25826 | 23548.9373626374 | 2277.06263736263 |
| 46 | 26835 | 24653.7373626374 | 2181.26263736264 |
| 47 | 20205 | 18587.9373626374 | 1617.06263736263 |
| 48 | 17789 | 17333.5373626374 | 455.462637362638 |
| 49 | 20520 | 19241.7637362637 | 1278.23626373627 |
| 50 | 22518 | 21414.3164835165 | 1103.68351648352 |
| 51 | 15572 | 17326.3164835165 | -1754.31648351648 |
| 52 | 11509 | 10866.9164835165 | 642.083516483515 |
| 53 | 25447 | 29210.3164835165 | -3763.31648351649 |
| 54 | 24090 | 26412.9164835165 | -2322.91648351648 |
| 55 | 27786 | 29654.7164835165 | -1868.71648351648 |
| 56 | 26195 | 26959.3373626374 | -764.337362637366 |
| 57 | 20516 | 23548.9373626374 | -3032.93736263737 |
| 58 | 22759 | 24653.7373626374 | -1894.73736263736 |
| 59 | 19028 | 18587.9373626374 | 440.062637362636 |
| 60 | 16971 | 17333.5373626374 | -362.537362637362 |
| 61 | 20036 | 19241.7637362637 | 794.236263736267 |
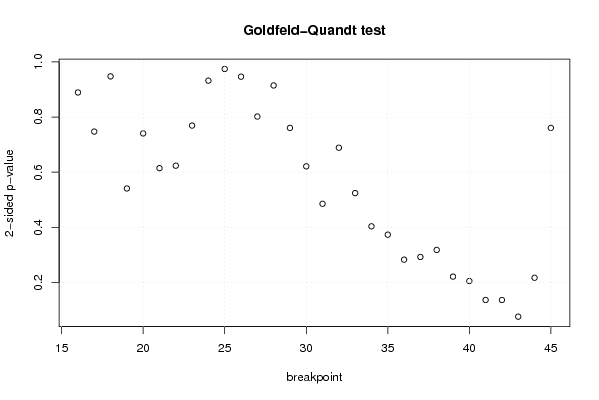
| Goldfeld-Quandt test for Heteroskedasticity | |||
| p-values | Alternative Hypothesis | ||
| breakpoint index | greater | 2-sided | less |
| 16 | 0.444646728861701 | 0.889293457723403 | 0.555353271138299 |
| 17 | 0.373734125999532 | 0.747468251999064 | 0.626265874000468 |
| 18 | 0.473765815152593 | 0.947531630305186 | 0.526234184847407 |
| 19 | 0.729445454765014 | 0.541109090469971 | 0.270554545234986 |
| 20 | 0.629623140223638 | 0.740753719552724 | 0.370376859776362 |
| 21 | 0.692604734125284 | 0.614790531749432 | 0.307395265874716 |
| 22 | 0.68811130452436 | 0.623777390951279 | 0.311888695475640 |
| 23 | 0.615387884392322 | 0.769224231215356 | 0.384612115607678 |
| 24 | 0.533973162300977 | 0.932053675398046 | 0.466026837699023 |
| 25 | 0.512736578420784 | 0.974526843158432 | 0.487263421579216 |
| 26 | 0.473233939862382 | 0.946467879724765 | 0.526766060137618 |
| 27 | 0.40095321850008 | 0.80190643700016 | 0.59904678149992 |
| 28 | 0.45731230031979 | 0.91462460063958 | 0.54268769968021 |
| 29 | 0.380376314153221 | 0.760752628306443 | 0.619623685846779 |
| 30 | 0.31068454542381 | 0.62136909084762 | 0.68931545457619 |
| 31 | 0.242797239427937 | 0.485594478855874 | 0.757202760572063 |
| 32 | 0.344424389811744 | 0.688848779623487 | 0.655575610188256 |
| 33 | 0.262124225735962 | 0.524248451471925 | 0.737875774264038 |
| 34 | 0.201962132053665 | 0.40392426410733 | 0.798037867946335 |
| 35 | 0.186802908789842 | 0.373605817579684 | 0.813197091210158 |
| 36 | 0.141507782374813 | 0.283015564749626 | 0.858492217625187 |
| 37 | 0.146402066498895 | 0.292804132997789 | 0.853597933501105 |
| 38 | 0.159153131255997 | 0.318306262511993 | 0.840846868744003 |
| 39 | 0.110716339025206 | 0.221432678050412 | 0.889283660974794 |
| 40 | 0.102797706666297 | 0.205595413332594 | 0.897202293333703 |
| 41 | 0.0684697624078916 | 0.136939524815783 | 0.931530237592108 |
| 42 | 0.0683108443845984 | 0.136621688769197 | 0.931689155615402 |
| 43 | 0.0381611037632188 | 0.0763222075264377 | 0.961838896236781 |
| 44 | 0.108675702773237 | 0.217351405546474 | 0.891324297226763 |
| 45 | 0.380341107985626 | 0.760682215971251 | 0.619658892014374 |
| Meta Analysis of Goldfeld-Quandt test for Heteroskedasticity | |||
| Description | # significant tests | % significant tests | OK/NOK |
| 1% type I error level | 0 | 0 | OK |
| 5% type I error level | 0 | 0 | OK |
| 10% type I error level | 1 | 0.0333333333333333 | OK |