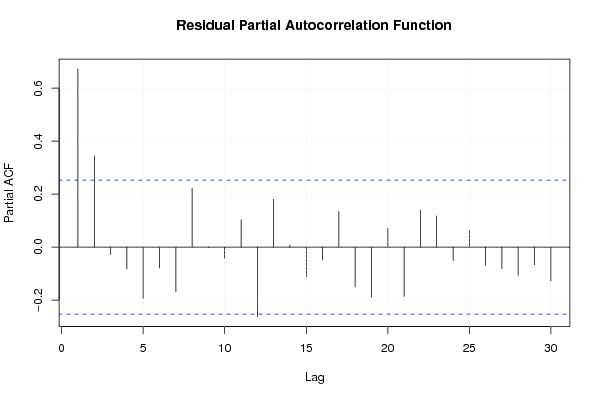
| Multiple Linear Regression - Estimated Regression Equation |
| Totind[t] = + 46.8345190965529 + 0.831862377966146Bouw[t] -24.5731310346029M1[t] -20.8424166591775M2[t] -19.2178354252768M3[t] -17.4348159005623M4[t] -9.18521148879648M5[t] -13.0270296530995M6[t] -18.7968268731994M7[t] -17.1531730835365M8[t] -21.9379740483817M9[t] -21.3356964790573M10[t] -21.1853261587166M11[t] -0.0143074877310507t + e[t] |
| Multiple Linear Regression - Ordinary Least Squares | |||||
| Variable | Parameter | S.D. | T-STAT H0: parameter = 0 | 2-tail p-value | 1-tail p-value |
| (Intercept) | 46.8345190965529 | 4.888213 | 9.5811 | 0 | 0 |
| Bouw | 0.831862377966146 | 0.091244 | 9.1169 | 0 | 0 |
| M1 | -24.5731310346029 | 4.714995 | -5.2117 | 4e-06 | 2e-06 |
| M2 | -20.8424166591775 | 5.788456 | -3.6007 | 0.000775 | 0.000387 |
| M3 | -19.2178354252768 | 5.614245 | -3.423 | 0.001311 | 0.000655 |
| M4 | -17.4348159005623 | 4.813629 | -3.622 | 0.000727 | 0.000363 |
| M5 | -9.18521148879648 | 3.436444 | -2.6729 | 0.010371 | 0.005185 |
| M6 | -13.0270296530995 | 3.757899 | -3.4666 | 0.001154 | 0.000577 |
| M7 | -18.7968268731994 | 4.372697 | -4.2987 | 8.8e-05 | 4.4e-05 |
| M8 | -17.1531730835365 | 5.039153 | -3.404 | 0.001386 | 0.000693 |
| M9 | -21.9379740483817 | 4.90522 | -4.4724 | 5e-05 | 2.5e-05 |
| M10 | -21.3356964790573 | 4.794551 | -4.45 | 5.4e-05 | 2.7e-05 |
| M11 | -21.1853261587166 | 5.670517 | -3.736 | 0.000515 | 0.000257 |
| t | -0.0143074877310507 | 0.029684 | -0.482 | 0.632092 | 0.316046 |
| Multiple Linear Regression - Regression Statistics | |
| Multiple R | 0.931746328205055 |
| R-squared | 0.868151220123602 |
| Adjusted R-squared | 0.830889608419402 |
| F-TEST (value) | 23.2988102343882 |
| F-TEST (DF numerator) | 13 |
| F-TEST (DF denominator) | 46 |
| p-value | 6.66133814775094e-16 |
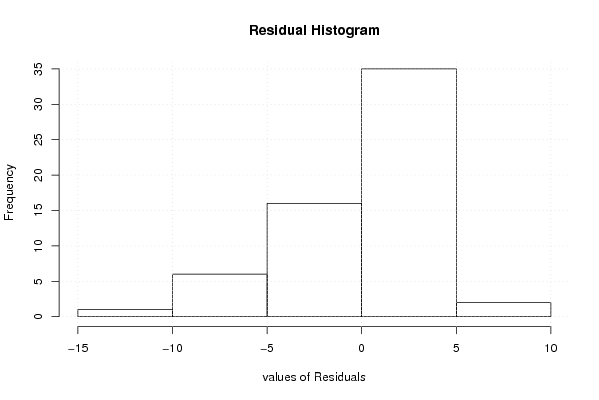
| Multiple Linear Regression - Residual Statistics | |
| Residual Standard Deviation | 3.89283805003852 |
| Sum Squared Residuals | 697.092651856073 |
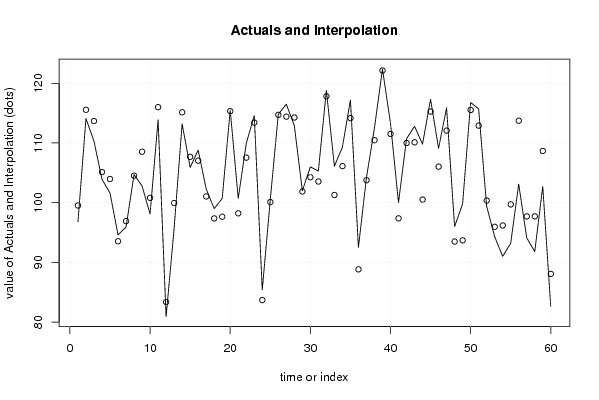
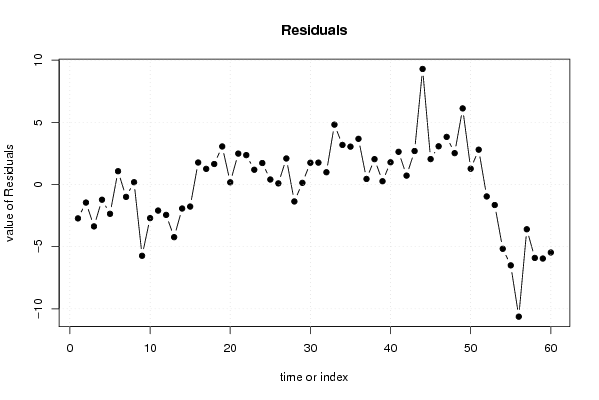
| Multiple Linear Regression - Actuals, Interpolation, and Residuals | |||
| Time or Index | Actuals | Interpolation Forecast | Residuals Prediction Error |
| 1 | 96.8 | 99.5270954872742 | -2.72709548727416 |
| 2 | 114.1 | 115.555065568867 | -1.45506556886731 |
| 3 | 110.3 | 113.671517327579 | -3.37151732757907 |
| 4 | 103.9 | 105.125135877782 | -1.22513587778233 |
| 5 | 101.6 | 103.960387930800 | -2.36038793079965 |
| 6 | 94.6 | 93.532549492833 | 1.06745050716704 |
| 7 | 95.9 | 96.8989309426297 | -0.998930942629699 |
| 8 | 104.7 | 104.517686365918 | 0.182313634082246 |
| 9 | 102.8 | 108.536319119783 | -5.73631911978272 |
| 10 | 98.1 | 100.805665421715 | -2.70566542171457 |
| 11 | 113.9 | 115.998437295511 | -2.09843729551147 |
| 12 | 80.9 | 83.3479601120873 | -2.44796011208735 |
| 13 | 95.7 | 99.9377092990777 | -4.23770929907767 |
| 14 | 113.2 | 115.133817002705 | -1.93381700270485 |
| 15 | 105.9 | 107.676790829043 | -1.77679082904343 |
| 16 | 108.8 | 107.033101969925 | 1.76689803007489 |
| 17 | 102.3 | 101.043552230739 | 1.25644776926124 |
| 18 | 99 | 97.3537990542979 | 1.64620094570213 |
| 19 | 100.7 | 97.6422897056198 | 3.05771029438016 |
| 20 | 115.5 | 115.326579902298 | 0.173420097701714 |
| 21 | 100.7 | 98.2159082558231 | 2.48409174417688 |
| 22 | 109.9 | 107.538433306061 | 2.36156669393907 |
| 23 | 114.6 | 113.414346546637 | 1.18565345336296 |
| 24 | 85.4 | 83.6753876860944 | 1.72461231390557 |
| 25 | 100.5 | 100.098764397492 | 0.401235602508471 |
| 26 | 114.8 | 114.712568436542 | 0.0874315634576082 |
| 27 | 116.5 | 114.409558713390 | 2.09044128661015 |
| 28 | 112.9 | 114.264987281051 | -1.36498728105120 |
| 29 | 102 | 101.870097231526 | 0.129902768474479 |
| 30 | 106 | 104.252939414238 | 1.74706058576250 |
| 31 | 105.3 | 103.543195212000 | 1.75680478799990 |
| 32 | 118.8 | 117.816849659017 | 0.983150340982653 |
| 33 | 106.1 | 101.288481677118 | 4.8115183228815 |
| 34 | 109.3 | 106.118949886339 | 3.18105011366088 |
| 35 | 117.2 | 114.157705309627 | 3.04229469037281 |
| 36 | 92.5 | 88.8276170523052 | 3.67238294769485 |
| 37 | 104.2 | 103.753641483363 | 0.446358516636813 |
| 38 | 112.5 | 110.464752931736 | 2.03524706826433 |
| 39 | 122.4 | 122.140561451296 | 0.259438548704380 |
| 40 | 113.3 | 111.514524056584 | 1.78547594341645 |
| 41 | 100 | 97.372723013329 | 2.62727698667105 |
| 42 | 110.7 | 109.987472445025 | 0.71252755497547 |
| 43 | 112.8 | 110.109590620753 | 2.69040937924671 |
| 44 | 109.8 | 100.508794820142 | 9.29120517985787 |
| 45 | 117.3 | 115.258452249770 | 2.04154775022963 |
| 46 | 109.1 | 106.030446271363 | 3.06955372863688 |
| 47 | 115.9 | 112.072731987532 | 3.82726801246756 |
| 48 | 96 | 93.4807289917362 | 2.51927100826381 |
| 49 | 99.8 | 93.6827893327934 | 6.11721066720655 |
| 50 | 116.8 | 115.533796060150 | 1.26620393985022 |
| 51 | 115.7 | 112.901571678692 | 2.79842832130797 |
| 52 | 99.4 | 100.362250814658 | -0.962250814657801 |
| 53 | 94.3 | 95.9532395936071 | -1.65323959360713 |
| 54 | 91 | 96.1732395936071 | -5.17323959360713 |
| 55 | 93.2 | 99.705993518997 | -6.50599351899707 |
| 56 | 103.1 | 113.730089252624 | -10.6300892526245 |
| 57 | 94.1 | 97.7008386975053 | -3.6008386975053 |
| 58 | 91.8 | 97.7065051145223 | -5.90650511452227 |
| 59 | 102.7 | 108.656778860692 | -5.95677886069186 |
| 60 | 82.6 | 88.0683061577769 | -5.46830615777687 |
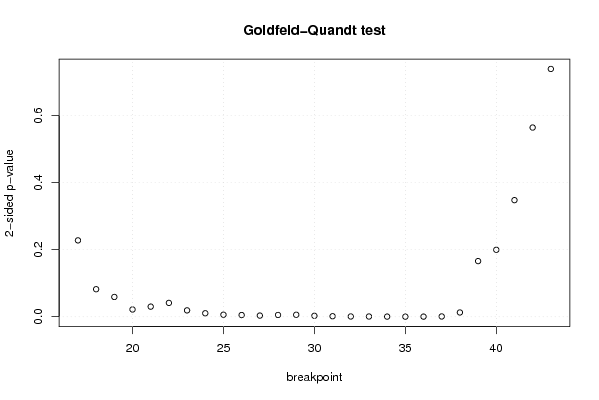
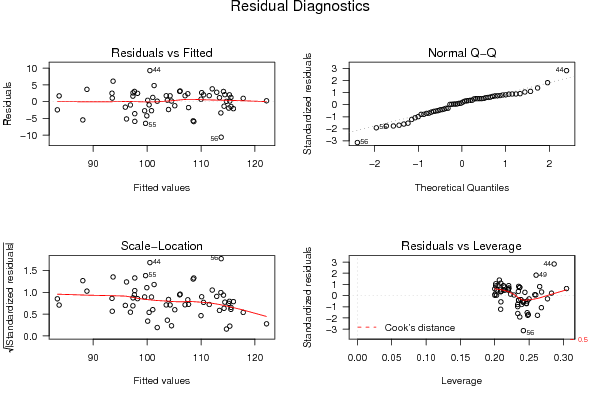
| Goldfeld-Quandt test for Heteroskedasticity | |||
| p-values | Alternative Hypothesis | ||
| breakpoint index | greater | 2-sided | less |
| 17 | 0.113874213278235 | 0.227748426556471 | 0.886125786721764 |
| 18 | 0.0410011311648618 | 0.0820022623297237 | 0.958998868835138 |
| 19 | 0.0294542609900538 | 0.0589085219801076 | 0.970545739009946 |
| 20 | 0.010795871589367 | 0.021591743178734 | 0.989204128410633 |
| 21 | 0.0150031566033695 | 0.0300063132067389 | 0.98499684339663 |
| 22 | 0.0205691931470765 | 0.0411383862941531 | 0.979430806852923 |
| 23 | 0.00942995973931924 | 0.0188599194786385 | 0.99057004026068 |
| 24 | 0.00511795768136993 | 0.0102359153627399 | 0.99488204231863 |
| 25 | 0.00294814828562365 | 0.0058962965712473 | 0.997051851714376 |
| 26 | 0.00243439667869610 | 0.00486879335739221 | 0.997565603321304 |
| 27 | 0.00166236417673400 | 0.00332472835346801 | 0.998337635823266 |
| 28 | 0.00254971757329334 | 0.00509943514658668 | 0.997450282426707 |
| 29 | 0.00285802563122181 | 0.00571605126244361 | 0.997141974368778 |
| 30 | 0.00133498176527175 | 0.00266996353054351 | 0.998665018234728 |
| 31 | 0.00068783040222106 | 0.00137566080444212 | 0.999312169597779 |
| 32 | 0.00032940176457545 | 0.0006588035291509 | 0.999670598235425 |
| 33 | 0.00027429711718506 | 0.00054859423437012 | 0.999725702882815 |
| 34 | 0.000121750594505441 | 0.000243501189010882 | 0.999878249405495 |
| 35 | 6.14326897591207e-05 | 0.000122865379518241 | 0.99993856731024 |
| 36 | 7.80544792508097e-05 | 0.000156108958501619 | 0.99992194552075 |
| 37 | 0.000346702008752065 | 0.000693404017504131 | 0.999653297991248 |
| 38 | 0.0062984835677087 | 0.0125969671354174 | 0.993701516432291 |
| 39 | 0.0829807541467307 | 0.165961508293461 | 0.917019245853269 |
| 40 | 0.0998126047626075 | 0.199625209525215 | 0.900187395237393 |
| 41 | 0.826101648425665 | 0.347796703148669 | 0.173898351574335 |
| 42 | 0.717742902980433 | 0.564514194039134 | 0.282257097019567 |
| 43 | 0.630318512645692 | 0.739362974708615 | 0.369681487354307 |
| Meta Analysis of Goldfeld-Quandt test for Heteroskedasticity | |||
| Description | # significant tests | % significant tests | OK/NOK |
| 1% type I error level | 13 | 0.481481481481481 | NOK |
| 5% type I error level | 19 | 0.703703703703704 | NOK |
| 10% type I error level | 21 | 0.777777777777778 | NOK |