| Multiple Linear Regression - Estimated Regression Equation |
| Y[t] = + 28.7874757977706 + 6.15526572196082X[t] + 1.04029525238940Y1[t] + 0.0529115814345462Y2[t] + 0.000173275377241103Y3[t] -0.0312486051569905Y4[t] -0.198417939743371Y5[t] + 0.0757211734654301Y6[t] + 14.3560144531145M1[t] + 62.1202569021121M2[t] + 16.8839583220259M3[t] -6.39068623716835M4[t] -13.4526057109252M5[t] -9.6089386884101M6[t] + 20.2085543548741M7[t] + 18.6461381200220M8[t] + 9.29765253960246M9[t] + 2.08312154381163M10[t] + 3.61754925754264M11[t] -0.203568749204859t + e[t] |
| Multiple Linear Regression - Ordinary Least Squares | |||||
| Variable | Parameter | S.D. | T-STAT H0: parameter = 0 | 2-tail p-value | 1-tail p-value |
| (Intercept) | 28.7874757977706 | 26.845366 | 1.0723 | 0.289412 | 0.144706 |
| X | 6.15526572196082 | 4.21047 | 1.4619 | 0.150876 | 0.075438 |
| Y1 | 1.04029525238940 | 0.148868 | 6.988 | 0 | 0 |
| Y2 | 0.0529115814345462 | 0.213536 | 0.2478 | 0.805451 | 0.402726 |
| Y3 | 0.000173275377241103 | 0.21149 | 8e-04 | 0.99935 | 0.499675 |
| Y4 | -0.0312486051569905 | 0.213886 | -0.1461 | 0.88451 | 0.442255 |
| Y5 | -0.198417939743371 | 0.218461 | -0.9083 | 0.368692 | 0.184346 |
| Y6 | 0.0757211734654301 | 0.157048 | 0.4822 | 0.632087 | 0.316043 |
| M1 | 14.3560144531145 | 4.401482 | 3.2616 | 0.002144 | 0.001072 |
| M2 | 62.1202569021121 | 4.712561 | 13.1818 | 0 | 0 |
| M3 | 16.8839583220259 | 9.936366 | 1.6992 | 0.096341 | 0.04817 |
| M4 | -6.39068623716835 | 10.226718 | -0.6249 | 0.535263 | 0.267632 |
| M5 | -13.4526057109252 | 9.741921 | -1.3809 | 0.174284 | 0.087142 |
| M6 | -9.6089386884101 | 9.057101 | -1.0609 | 0.294511 | 0.147256 |
| M7 | 20.2085543548741 | 9.164679 | 2.205 | 0.032723 | 0.016361 |
| M8 | 18.6461381200220 | 5.357411 | 3.4804 | 0.001142 | 0.000571 |
| M9 | 9.29765253960246 | 6.19355 | 1.5012 | 0.140451 | 0.070225 |
| M10 | 2.08312154381163 | 6.225964 | 0.3346 | 0.739527 | 0.369763 |
| M11 | 3.61754925754264 | 5.389623 | 0.6712 | 0.505598 | 0.252799 |
| t | -0.203568749204859 | 0.09105 | -2.2358 | 0.030486 | 0.015243 |
| Multiple Linear Regression - Regression Statistics | |
| Multiple R | 0.990492291244139 |
| R-squared | 0.981074979014064 |
| Adjusted R-squared | 0.972902810861046 |
| F-TEST (value) | 120.050757723549 |
| F-TEST (DF numerator) | 19 |
| F-TEST (DF denominator) | 44 |
| p-value | 0 |
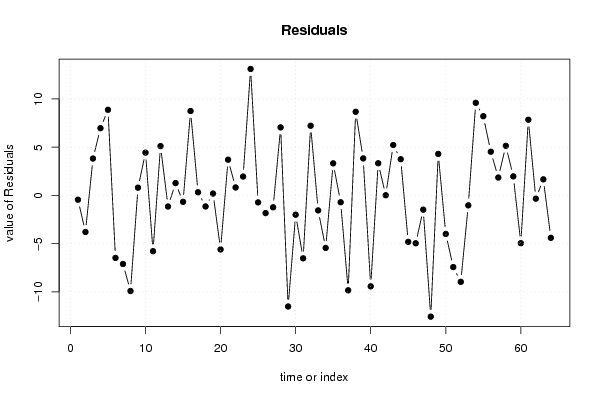
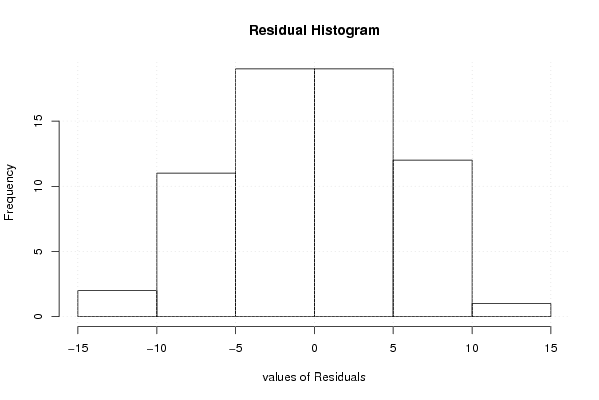
| Multiple Linear Regression - Residual Statistics | |
| Residual Standard Deviation | 6.88896340432147 |
| Sum Squared Residuals | 2088.14393858754 |
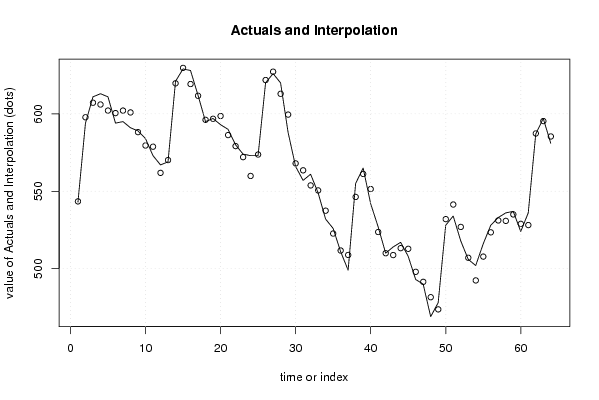
| Multiple Linear Regression - Actuals, Interpolation, and Residuals | |||
| Time or Index | Actuals | Interpolation Forecast | Residuals Prediction Error |
| 1 | 543 | 543.442441814016 | -0.442441814015519 |
| 2 | 594 | 597.788557713896 | -3.78855771389591 |
| 3 | 611 | 607.178525939152 | 3.82147406084762 |
| 4 | 613 | 606.031872759282 | 6.9681272407183 |
| 5 | 611 | 602.123810008867 | 8.87618999113269 |
| 6 | 594 | 600.477851905956 | -6.47785190595618 |
| 7 | 595 | 602.105066123513 | -7.10506612351298 |
| 8 | 591 | 600.905710617489 | -9.90571061748938 |
| 9 | 589 | 588.195362458068 | 0.804637541931634 |
| 10 | 584 | 579.564703672019 | 4.43529632798065 |
| 11 | 573 | 578.77798413377 | -5.77798413376995 |
| 12 | 567 | 561.888030424784 | 5.11196957521583 |
| 13 | 569 | 570.147700984444 | -1.14770098444407 |
| 14 | 621 | 619.719783882669 | 1.28021611733133 |
| 15 | 629 | 629.664435196745 | -0.664435196744697 |
| 16 | 628 | 619.251815793604 | 8.74818420639645 |
| 17 | 612 | 611.673412809372 | 0.326587190628115 |
| 18 | 595 | 596.141171277592 | -1.14117127759233 |
| 19 | 597 | 596.807038341742 | 0.192961658258436 |
| 20 | 593 | 598.600780679453 | -5.60078067945272 |
| 21 | 590 | 586.294587831705 | 3.70541216829463 |
| 22 | 580 | 579.174494704655 | 0.825505295344876 |
| 23 | 574 | 572.042042289351 | 1.95795771064883 |
| 24 | 573 | 559.890415720019 | 13.1095842799810 |
| 25 | 573 | 573.722223850535 | -0.72222385053484 |
| 26 | 620 | 621.833801493568 | -1.83380149356791 |
| 27 | 626 | 627.23214525918 | -1.23214525918055 |
| 28 | 620 | 612.947092301504 | 7.05290769849558 |
| 29 | 588 | 599.509536894495 | -11.5095368944948 |
| 30 | 566 | 567.999351639157 | -1.99935163915652 |
| 31 | 557 | 563.51943532362 | -6.51943532361981 |
| 32 | 561 | 553.777072609784 | 7.22292739021642 |
| 33 | 549 | 550.550973042783 | -1.55097304278301 |
| 34 | 532 | 537.441933460907 | -5.44193346090666 |
| 35 | 526 | 522.676881828981 | 3.32311817101918 |
| 36 | 511 | 511.707317339806 | -0.707317339805665 |
| 37 | 499 | 508.834740029575 | -9.8347400295755 |
| 38 | 555 | 546.332283585365 | 8.66771641463513 |
| 39 | 565 | 561.163354807001 | 3.83664519299912 |
| 40 | 542 | 551.421040045206 | -9.4210400452062 |
| 41 | 527 | 523.664505570001 | 3.33549442999873 |
| 42 | 510 | 509.980217224396 | 0.0197827756040731 |
| 43 | 514 | 508.778918413877 | 5.22108158612308 |
| 44 | 517 | 513.246942659573 | 3.75305734042712 |
| 45 | 508 | 512.814028157548 | -4.81402815754841 |
| 46 | 493 | 497.958607380975 | -4.95860738097528 |
| 47 | 490 | 491.47691182787 | -1.47691182787005 |
| 48 | 469 | 481.564997340684 | -12.5649973406842 |
| 49 | 478 | 473.698777190499 | 4.30122280950121 |
| 50 | 528 | 531.992099180980 | -3.9920991809804 |
| 51 | 534 | 541.428084271581 | -7.42808427158064 |
| 52 | 518 | 526.954437953186 | -8.95443795318585 |
| 53 | 506 | 507.028734717265 | -1.02873471726476 |
| 54 | 502 | 492.401407952899 | 9.59859204710095 |
| 55 | 516 | 507.789541797249 | 8.21045820275127 |
| 56 | 528 | 523.469493433701 | 4.53050656629855 |
| 57 | 533 | 531.145048509895 | 1.85495149010515 |
| 58 | 536 | 530.860260781444 | 5.13973921855641 |
| 59 | 537 | 535.026179920028 | 1.97382007997199 |
| 60 | 524 | 528.949239174707 | -4.94923917470695 |
| 61 | 536 | 528.154116130931 | 7.84588386906871 |
| 62 | 587 | 587.333474143522 | -0.333474143522253 |
| 63 | 597 | 595.333454526341 | 1.66654547365915 |
| 64 | 581 | 585.393741147218 | -4.39374114721826 |
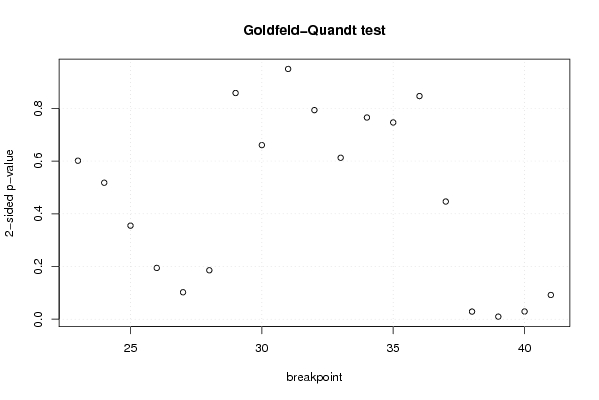
| Goldfeld-Quandt test for Heteroskedasticity | |||
| p-values | Alternative Hypothesis | ||
| breakpoint index | greater | 2-sided | less |
| 23 | 0.300758191034921 | 0.601516382069841 | 0.69924180896508 |
| 24 | 0.258959550679212 | 0.517919101358424 | 0.741040449320788 |
| 25 | 0.177514612711509 | 0.355029225423017 | 0.822485387288491 |
| 26 | 0.097285402685992 | 0.194570805371984 | 0.902714597314008 |
| 27 | 0.0511426249603833 | 0.102285249920767 | 0.948857375039617 |
| 28 | 0.0928543658048047 | 0.185708731609609 | 0.907145634195195 |
| 29 | 0.429199187113733 | 0.858398374227466 | 0.570800812886267 |
| 30 | 0.330381198735007 | 0.660762397470013 | 0.669618801264993 |
| 31 | 0.474849529784302 | 0.949699059568604 | 0.525150470215698 |
| 32 | 0.396705888746081 | 0.793411777492162 | 0.603294111253919 |
| 33 | 0.306326249588484 | 0.612652499176968 | 0.693673750411516 |
| 34 | 0.382702389603274 | 0.765404779206549 | 0.617297610396726 |
| 35 | 0.373304160346015 | 0.746608320692031 | 0.626695839653985 |
| 36 | 0.42338153189096 | 0.84676306378192 | 0.57661846810904 |
| 37 | 0.776706575534544 | 0.446586848930911 | 0.223293424465456 |
| 38 | 0.985546029578099 | 0.0289079408438027 | 0.0144539704219013 |
| 39 | 0.995152056030306 | 0.00969588793938782 | 0.00484794396969391 |
| 40 | 0.985369731901414 | 0.0292605361971721 | 0.0146302680985861 |
| 41 | 0.954050572447448 | 0.0918988551051047 | 0.0459494275525523 |
| Meta Analysis of Goldfeld-Quandt test for Heteroskedasticity | |||
| Description | # significant tests | % significant tests | OK/NOK |
| 1% type I error level | 1 | 0.0526315789473684 | NOK |
| 5% type I error level | 3 | 0.157894736842105 | NOK |
| 10% type I error level | 4 | 0.210526315789474 | NOK |