| Multiple Linear Regression - Estimated Regression Equation |
| Yt[t] = + 365.825961771422 -2.39632617023324Xt[t] + e[t] |
| Multiple Linear Regression - Ordinary Least Squares | |||||
| Variable | Parameter | S.D. | T-STAT H0: parameter = 0 | 2-tail p-value | 1-tail p-value |
| (Intercept) | 365.825961771422 | 194.027118 | 1.8854 | 0.064383 | 0.032191 |
| Xt | -2.39632617023324 | 1.775122 | -1.35 | 0.182277 | 0.091139 |
| Multiple Linear Regression - Regression Statistics | |
| Multiple R | 0.174536352936846 |
| R-squared | 0.0304629384964952 |
| Adjusted R-squared | 0.0137467822636762 |
| F-TEST (value) | 1.82236502651769 |
| F-TEST (DF numerator) | 1 |
| F-TEST (DF denominator) | 58 |
| p-value | 0.182277044430929 |
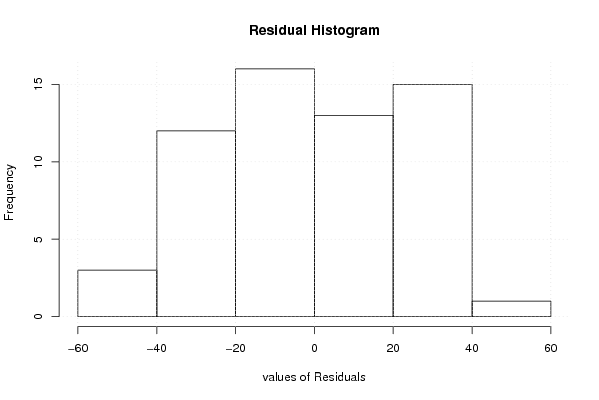
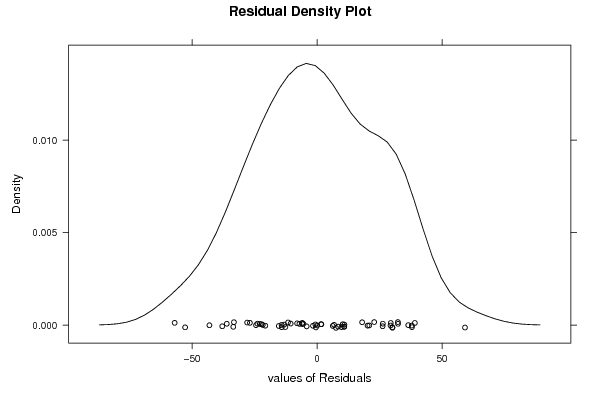
| Multiple Linear Regression - Residual Statistics | |
| Residual Standard Deviation | 25.4697443187088 |
| Sum Squared Residuals | 37625.0567883032 |
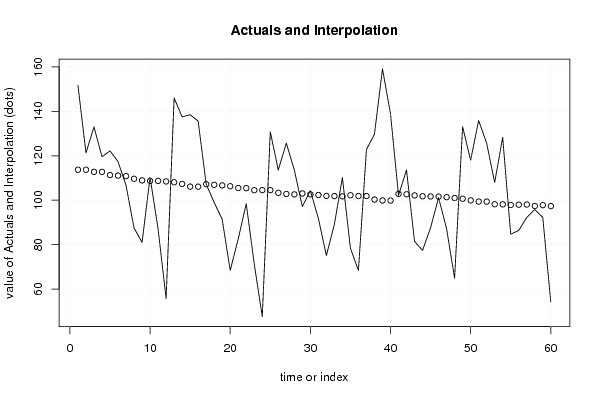
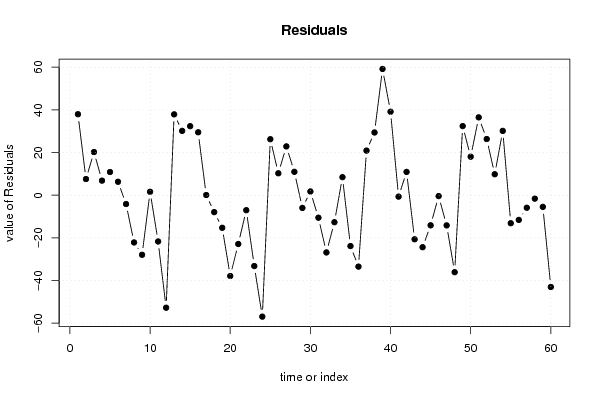
| Multiple Linear Regression - Actuals, Interpolation, and Residuals | |||
| Time or Index | Actuals | Interpolation Forecast | Residuals Prediction Error |
| 1 | 151.7 | 113.732448662885 | 37.9675513371147 |
| 2 | 121.3 | 113.732448662885 | 7.56755133711488 |
| 3 | 133 | 112.773918194792 | 20.2260818052082 |
| 4 | 119.6 | 112.773918194792 | 6.82608180520817 |
| 5 | 122.2 | 111.336122492652 | 10.8638775073481 |
| 6 | 117.4 | 111.096489875629 | 6.30351012437146 |
| 7 | 106.7 | 110.856857258605 | -4.1568572586052 |
| 8 | 87.5 | 109.658694173489 | -22.1586941734886 |
| 9 | 81 | 108.939796322419 | -27.9397963224186 |
| 10 | 110.3 | 108.700163705395 | 1.59983629460468 |
| 11 | 87 | 108.700163705395 | -21.7001637053953 |
| 12 | 55.7 | 108.460531088372 | -52.760531088372 |
| 13 | 146 | 108.101082162837 | 37.898917837163 |
| 14 | 137.5 | 107.334257788362 | 30.1657422116376 |
| 15 | 138.5 | 106.136094703246 | 32.3639052967543 |
| 16 | 135.6 | 106.112131441543 | 29.4878685584566 |
| 17 | 107.3 | 107.214441479851 | 0.085558520149303 |
| 18 | 99 | 106.950845601125 | -7.95084560112504 |
| 19 | 91.4 | 106.687249722399 | -15.2872497223994 |
| 20 | 68.4 | 106.303837535162 | -37.9038375351621 |
| 21 | 82.6 | 105.489086637283 | -22.8890866372828 |
| 22 | 98.4 | 105.441160113878 | -7.0411601138781 |
| 23 | 71.3 | 104.530556169189 | -33.2305561691895 |
| 24 | 47.6 | 104.554519430892 | -56.9545194308918 |
| 25 | 130.8 | 104.554519430892 | 26.2454805691082 |
| 26 | 113.6 | 103.332393084073 | 10.2676069159272 |
| 27 | 125.7 | 102.829164588324 | 22.8708354116761 |
| 28 | 113.6 | 102.637458494705 | 10.9625415052948 |
| 29 | 97.1 | 103.068797205347 | -5.96879720534719 |
| 30 | 104.4 | 102.661421756408 | 1.73857824359244 |
| 31 | 91.8 | 102.349899354277 | -10.5498993542772 |
| 32 | 75.1 | 101.942523905338 | -26.8425239053376 |
| 33 | 89.2 | 101.870634120231 | -12.6706341202306 |
| 34 | 110.2 | 101.750817811719 | 8.4491821882811 |
| 35 | 78.4 | 102.254046307468 | -23.8540463074679 |
| 36 | 68.4 | 101.894597381933 | -33.4945973819329 |
| 37 | 122.8 | 101.894597381933 | 20.9054026180671 |
| 38 | 129.7 | 100.289058847877 | 29.4109411521234 |
| 39 | 159.1 | 99.9056466606393 | 59.1943533393607 |
| 40 | 139 | 99.8577201372347 | 39.1422798627653 |
| 41 | 102.2 | 102.877091111729 | -0.677091111728526 |
| 42 | 113.6 | 102.685385018110 | 10.9146149818901 |
| 43 | 81.5 | 102.182156522361 | -20.6821565223609 |
| 44 | 77.4 | 101.798744335124 | -24.3987443351236 |
| 45 | 87.6 | 101.726854550017 | -14.1268545500166 |
| 46 | 101.2 | 101.631001503207 | -0.431001503207252 |
| 47 | 87.2 | 101.367405624482 | -14.1674056244816 |
| 48 | 64.9 | 101.007956698947 | -36.1079566989466 |
| 49 | 133.1 | 100.696434296816 | 32.4035657031837 |
| 50 | 118 | 99.953573184044 | 18.0464268159560 |
| 51 | 135.9 | 99.4024181648903 | 36.4975818351097 |
| 52 | 125.7 | 99.378454903188 | 26.321545096812 |
| 53 | 108 | 98.1802918180714 | 9.8197081819286 |
| 54 | 128.3 | 98.156328556369 | 30.1436714436310 |
| 55 | 84.7 | 97.8448061542387 | -13.1448061542387 |
| 56 | 86.4 | 97.9885857244527 | -11.5885857244527 |
| 57 | 92.2 | 98.084438771262 | -5.88443877126205 |
| 58 | 95.8 | 97.4134674435967 | -1.61346744359675 |
| 59 | 92.3 | 97.7729163691317 | -5.47291636913175 |
| 60 | 54.3 | 97.3415776584897 | -43.0415776584898 |
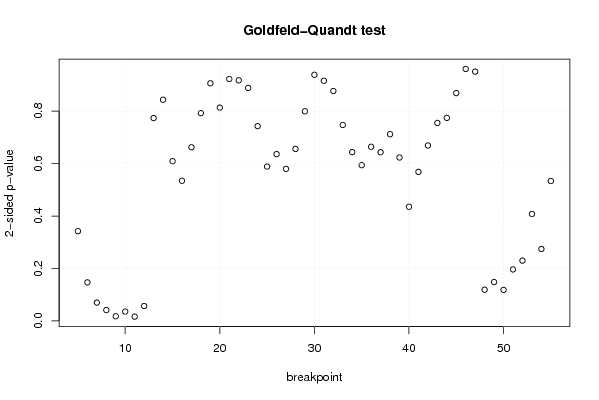
| Goldfeld-Quandt test for Heteroskedasticity | |||
| p-values | Alternative Hypothesis | ||
| breakpoint index | greater | 2-sided | less |
| 5 | 0.171100588575401 | 0.342201177150802 | 0.8288994114246 |
| 6 | 0.0734769637408745 | 0.146953927481749 | 0.926523036259125 |
| 7 | 0.0348935994022638 | 0.0697871988045277 | 0.965106400597736 |
| 8 | 0.0207043254936354 | 0.0414086509872708 | 0.979295674506365 |
| 9 | 0.00893283742056554 | 0.0178656748411311 | 0.991067162579435 |
| 10 | 0.0178256647300455 | 0.0356513294600910 | 0.982174335269955 |
| 11 | 0.00814155488689397 | 0.0162831097737879 | 0.991858445113106 |
| 12 | 0.028464636945616 | 0.056929273891232 | 0.971535363054384 |
| 13 | 0.386808980071187 | 0.773617960142373 | 0.613191019928813 |
| 14 | 0.578222635484976 | 0.843554729030048 | 0.421777364515024 |
| 15 | 0.695382826939092 | 0.609234346121817 | 0.304617173060908 |
| 16 | 0.732788765873204 | 0.534422468253592 | 0.267211234126796 |
| 17 | 0.668857461697494 | 0.662285076605011 | 0.331142538302506 |
| 18 | 0.603762285896497 | 0.792475428207005 | 0.396237714103503 |
| 19 | 0.546885769378923 | 0.906228461242153 | 0.453114230621077 |
| 20 | 0.59327439828207 | 0.813451203435861 | 0.406725601717931 |
| 21 | 0.538659595603253 | 0.922680808793494 | 0.461340404396747 |
| 22 | 0.458786733157614 | 0.917573466315228 | 0.541213266842386 |
| 23 | 0.44434489542246 | 0.88868979084492 | 0.55565510457754 |
| 24 | 0.628596083418815 | 0.74280783316237 | 0.371403916581185 |
| 25 | 0.705638263394662 | 0.588723473210675 | 0.294361736605338 |
| 26 | 0.681884511935282 | 0.636230976129436 | 0.318115488064718 |
| 27 | 0.710055893833342 | 0.579888212333317 | 0.289944106166658 |
| 28 | 0.672036340915984 | 0.655927318168032 | 0.327963659084016 |
| 29 | 0.600194082004376 | 0.799611835991248 | 0.399805917995624 |
| 30 | 0.530671788602366 | 0.938656422795268 | 0.469328211397634 |
| 31 | 0.457995878858921 | 0.915991757717842 | 0.542004121141079 |
| 32 | 0.438387727190830 | 0.876775454381661 | 0.56161227280917 |
| 33 | 0.373645422674904 | 0.747290845349807 | 0.626354577325096 |
| 34 | 0.321875919367459 | 0.643751838734918 | 0.678124080632541 |
| 35 | 0.296991449989887 | 0.593982899979775 | 0.703008550010113 |
| 36 | 0.332040847216316 | 0.664081694432632 | 0.667959152783684 |
| 37 | 0.321647036767394 | 0.643294073534788 | 0.678352963232606 |
| 38 | 0.356066464908364 | 0.712132929816729 | 0.643933535091636 |
| 39 | 0.688376509419476 | 0.623246981161048 | 0.311623490580524 |
| 40 | 0.782321633474313 | 0.435356733051375 | 0.217678366525687 |
| 41 | 0.715754355383872 | 0.568491289232256 | 0.284245644616128 |
| 42 | 0.665456523628025 | 0.66908695274395 | 0.334543476371975 |
| 43 | 0.622454116164237 | 0.755091767671525 | 0.377545883835763 |
| 44 | 0.612826686231173 | 0.774346627537653 | 0.387173313768827 |
| 45 | 0.565619319934384 | 0.868761360131233 | 0.434380680065616 |
| 46 | 0.480480804118231 | 0.960961608236463 | 0.519519195881769 |
| 47 | 0.475408062274529 | 0.950816124549058 | 0.524591937725471 |
| 48 | 0.940428382975215 | 0.119143234049569 | 0.0595716170247847 |
| 49 | 0.925951592988213 | 0.148096814023574 | 0.0740484070117868 |
| 50 | 0.940842398052434 | 0.118315203895133 | 0.0591576019475664 |
| 51 | 0.90181314500877 | 0.196373709982458 | 0.098186854991229 |
| 52 | 0.885004227995472 | 0.229991544009057 | 0.114995772004528 |
| 53 | 0.796074174790923 | 0.407851650418154 | 0.203925825209077 |
| 54 | 0.862796489493782 | 0.274407021012436 | 0.137203510506218 |
| 55 | 0.733258260294772 | 0.533483479410456 | 0.266741739705228 |
| Meta Analysis of Goldfeld-Quandt test for Heteroskedasticity | |||
| Description | # significant tests | % significant tests | OK/NOK |
| 1% type I error level | 0 | 0 | OK |
| 5% type I error level | 4 | 0.0784313725490196 | NOK |
| 10% type I error level | 6 | 0.117647058823529 | NOK |