| Multiple Linear Regression - Estimated Regression Equation |
| Totind[t] = -29.5139603340959 + 0.665616707652597Bouw[t] + 0.284368980405653`Yt-1`[t] + 0.289338994260551`Yt-2`[t] + 0.157257661996291`Yt-3`[t] -0.0641304861653082`Yt-4`[t] + 5.1106498875945M1[t] + 7.13200327844603M2[t] + 5.96646531169032M3[t] + 9.41343049457463M4[t] + 0.972856350450679M5[t] + 0.391300760931872M6[t] + 3.03306035447898M7[t] + 14.0194673929411M8[t] + 0.117239138123227M9[t] + 8.83732777976529M10[t] + 8.1309443614198M11[t] -0.0421476113852508t + e[t] |
| Multiple Linear Regression - Ordinary Least Squares | |||||
| Variable | Parameter | S.D. | T-STAT H0: parameter = 0 | 2-tail p-value | 1-tail p-value |
| (Intercept) | -29.5139603340959 | 6.195053 | -4.7641 | 2.8e-05 | 1.4e-05 |
| Bouw | 0.665616707652597 | 0.049005 | 13.5825 | 0 | 0 |
| `Yt-1` | 0.284368980405653 | 0.071642 | 3.9693 | 0.000309 | 0.000155 |
| `Yt-2` | 0.289338994260551 | 0.055434 | 5.2195 | 7e-06 | 3e-06 |
| `Yt-3` | 0.157257661996291 | 0.067752 | 2.3211 | 0.025746 | 0.012873 |
| `Yt-4` | -0.0641304861653082 | 0.07538 | -0.8508 | 0.400233 | 0.200117 |
| M1 | 5.1106498875945 | 2.576104 | 1.9839 | 0.054529 | 0.027264 |
| M2 | 7.13200327844603 | 3.6609 | 1.9482 | 0.05881 | 0.029405 |
| M3 | 5.96646531169032 | 3.435764 | 1.7366 | 0.090564 | 0.045282 |
| M4 | 9.41343049457463 | 2.709243 | 3.4746 | 0.001295 | 0.000647 |
| M5 | 0.972856350450679 | 1.87042 | 0.5201 | 0.605992 | 0.302996 |
| M6 | 0.391300760931872 | 1.966985 | 0.1989 | 0.843375 | 0.421687 |
| M7 | 3.03306035447898 | 2.397002 | 1.2654 | 0.213448 | 0.106724 |
| M8 | 14.0194673929411 | 3.3133 | 4.2313 | 0.000141 | 7.1e-05 |
| M9 | 0.117239138123227 | 3.37804 | 0.0347 | 0.972496 | 0.486248 |
| M10 | 8.83732777976529 | 3.496589 | 2.5274 | 0.015771 | 0.007885 |
| M11 | 8.1309443614198 | 2.851922 | 2.851 | 0.007006 | 0.003503 |
| t | -0.0421476113852508 | 0.016227 | -2.5973 | 0.013292 | 0.006646 |
| Multiple Linear Regression - Regression Statistics | |
| Multiple R | 0.988348734440301 |
| R-squared | 0.976833220869745 |
| Adjusted R-squared | 0.966469135469368 |
| F-TEST (value) | 94.2517533514537 |
| F-TEST (DF numerator) | 17 |
| F-TEST (DF denominator) | 38 |
| p-value | 0 |
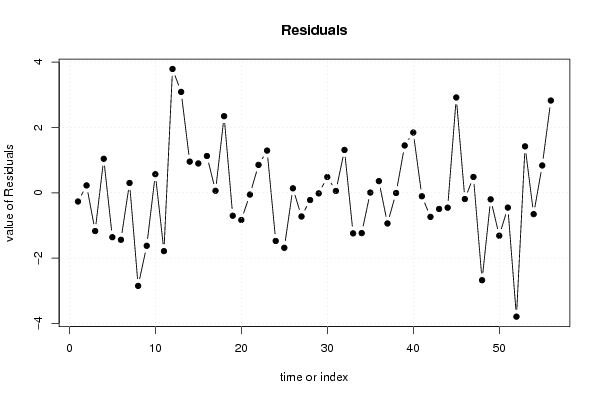
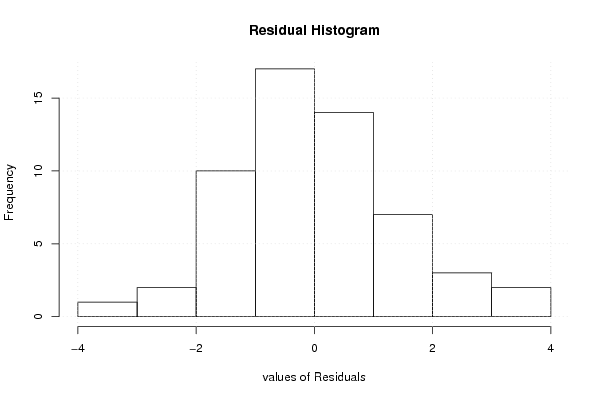
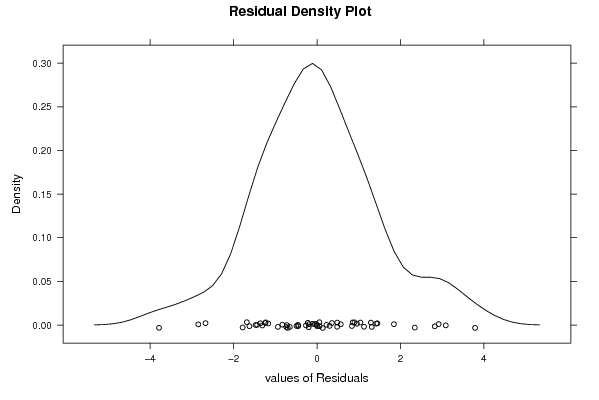
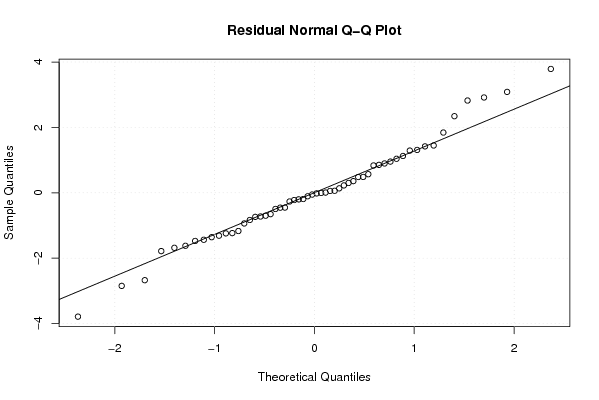
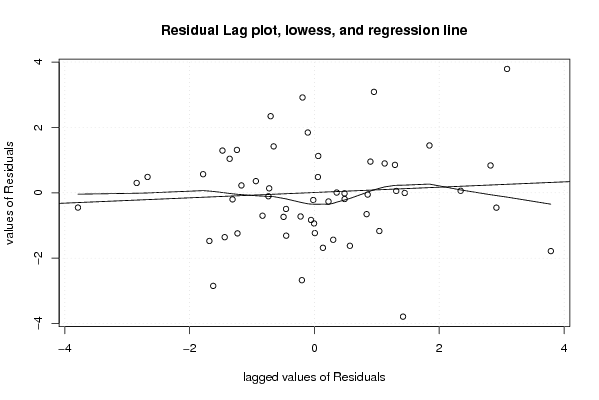
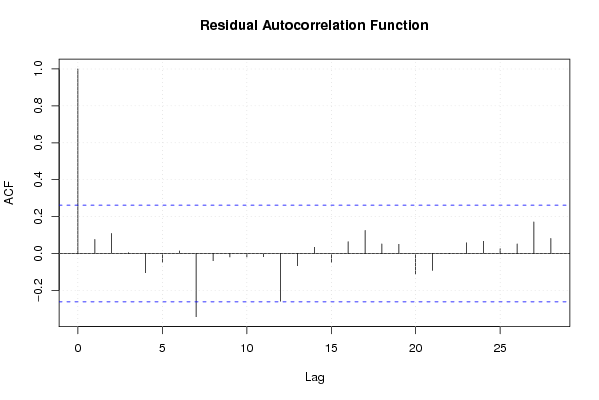
| Multiple Linear Regression - Residual Statistics | |
| Residual Standard Deviation | 1.76382842703576 |
| Sum Squared Residuals | 118.221447360738 |
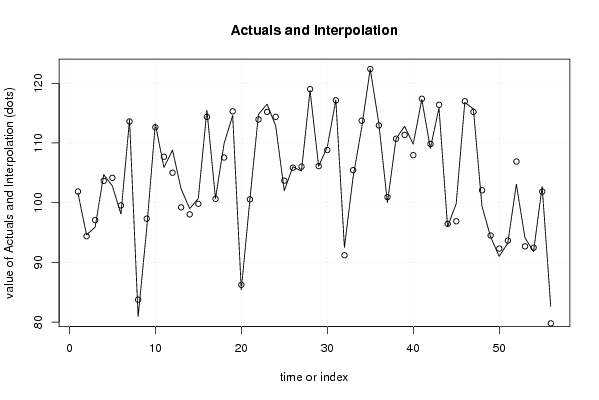
| Multiple Linear Regression - Actuals, Interpolation, and Residuals | |||
| Time or Index | Actuals | Interpolation Forecast | Residuals Prediction Error |
| 1 | 101.6 | 101.866051516852 | -0.266051516851691 |
| 2 | 94.6 | 94.3740305614162 | 0.225969438583834 |
| 3 | 95.9 | 97.0693130284668 | -1.16931302846682 |
| 4 | 104.7 | 103.659620098635 | 1.04037990136542 |
| 5 | 102.8 | 104.157719648558 | -1.35771964855756 |
| 6 | 98.1 | 99.537079821602 | -1.43707982160198 |
| 7 | 113.9 | 113.598573708827 | 0.301426291173327 |
| 8 | 80.9 | 83.7474309321176 | -2.84743093211761 |
| 9 | 95.7 | 97.3211987629797 | -1.62119876297968 |
| 10 | 113.2 | 112.631208802766 | 0.568791197233832 |
| 11 | 105.9 | 107.683365404488 | -1.78336540448772 |
| 12 | 108.8 | 105.011243263089 | 3.78875673691121 |
| 13 | 102.3 | 99.2130731132015 | 3.08692688679845 |
| 14 | 99 | 98.0458225044514 | 0.954177495548632 |
| 15 | 100.7 | 99.8022175629381 | 0.89778243706188 |
| 16 | 115.5 | 114.373892964907 | 1.12610703509319 |
| 17 | 100.7 | 100.638479011873 | 0.0615209881274798 |
| 18 | 109.9 | 107.556276076112 | 2.34372392388758 |
| 19 | 114.6 | 115.301012416817 | -0.701012416817162 |
| 20 | 85.4 | 86.2314376978671 | -0.83143769786708 |
| 21 | 100.5 | 100.554186249729 | -0.0541862497289154 |
| 22 | 114.8 | 113.946089660614 | 0.853910339386245 |
| 23 | 116.5 | 115.208798421149 | 1.29120157885144 |
| 24 | 112.9 | 114.372963797529 | -1.47296379752900 |
| 25 | 102 | 103.682733910187 | -1.68273391018725 |
| 26 | 106 | 105.863094804518 | 0.136905195481805 |
| 27 | 105.3 | 106.024202617573 | -0.724202617573007 |
| 28 | 118.8 | 119.021453070585 | -0.221453070585327 |
| 29 | 106.1 | 106.118032623855 | -0.0180326238554691 |
| 30 | 109.3 | 108.816962695287 | 0.483037304713348 |
| 31 | 117.2 | 117.143178687603 | 0.0568213123970843 |
| 32 | 92.5 | 91.1889300131535 | 1.31106998684648 |
| 33 | 104.2 | 105.440893691775 | -1.24089369177498 |
| 34 | 112.5 | 113.732616756133 | -1.23261675613339 |
| 35 | 122.4 | 122.392681567200 | 0.0073184327998856 |
| 36 | 113.3 | 112.942604862390 | 0.357395137610363 |
| 37 | 100 | 100.937627930667 | -0.937627930667136 |
| 38 | 110.7 | 110.705520053080 | -0.00552005307985979 |
| 39 | 112.8 | 111.352316028745 | 1.44768397125529 |
| 40 | 109.8 | 107.956470663927 | 1.8435293360729 |
| 41 | 117.3 | 117.405838934343 | -0.105838934343046 |
| 42 | 109.1 | 109.836653841622 | -0.736653841622493 |
| 43 | 115.9 | 116.393914258810 | -0.49391425880954 |
| 44 | 96 | 96.4546482973823 | -0.45464829738235 |
| 45 | 99.8 | 96.8837212955164 | 2.91627870448357 |
| 46 | 116.8 | 116.990084780487 | -0.190084780486683 |
| 47 | 115.7 | 115.215154607164 | 0.484845392836394 |
| 48 | 99.4 | 102.073188076993 | -2.67318807699256 |
| 49 | 94.3 | 94.5005135290924 | -0.200513529092374 |
| 50 | 91 | 92.3115320765344 | -1.31153207653441 |
| 51 | 93.2 | 93.6519507622774 | -0.451950762277349 |
| 52 | 103.1 | 106.888563201946 | -3.78856320194618 |
| 53 | 94.1 | 92.6799297813714 | 1.42007021862860 |
| 54 | 91.8 | 92.4530275653764 | -0.653027565376453 |
| 55 | 102.7 | 101.863320927944 | 0.836679072056288 |
| 56 | 82.6 | 79.7775530594794 | 2.82244694052056 |
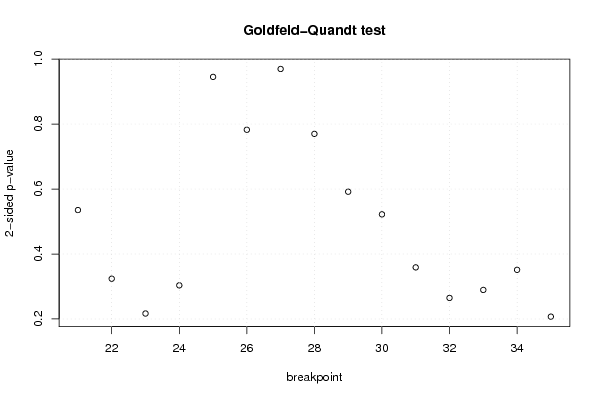
| Goldfeld-Quandt test for Heteroskedasticity | |||
| p-values | Alternative Hypothesis | ||
| breakpoint index | greater | 2-sided | less |
| 21 | 0.267688366189689 | 0.535376732379378 | 0.732311633810311 |
| 22 | 0.161996528974833 | 0.323993057949666 | 0.838003471025167 |
| 23 | 0.108426320826288 | 0.216852641652575 | 0.891573679173713 |
| 24 | 0.151794370446729 | 0.303588740893459 | 0.84820562955327 |
| 25 | 0.527355837599889 | 0.945288324800223 | 0.472644162400111 |
| 26 | 0.608719073276088 | 0.782561853447824 | 0.391280926723912 |
| 27 | 0.484886574327489 | 0.969773148654979 | 0.515113425672511 |
| 28 | 0.384973013947591 | 0.769946027895182 | 0.615026986052409 |
| 29 | 0.295909658198540 | 0.591819316397079 | 0.70409034180146 |
| 30 | 0.261085076105282 | 0.522170152210563 | 0.738914923894718 |
| 31 | 0.179440991195457 | 0.358881982390914 | 0.820559008804543 |
| 32 | 0.132421283694576 | 0.264842567389152 | 0.867578716305424 |
| 33 | 0.144730076525154 | 0.289460153050309 | 0.855269923474846 |
| 34 | 0.175654879106201 | 0.351309758212402 | 0.824345120893799 |
| 35 | 0.103593080015877 | 0.207186160031753 | 0.896406919984123 |
| Meta Analysis of Goldfeld-Quandt test for Heteroskedasticity | |||
| Description | # significant tests | % significant tests | OK/NOK |
| 1% type I error level | 0 | 0 | OK |
| 5% type I error level | 0 | 0 | OK |
| 10% type I error level | 0 | 0 | OK |