Free Statistics

of Irreproducible Research!

Author's title

Author*The author of this computation has been verified*
R Software Modulerwasp_multipleregression.wasp
Title produced by softwareMultiple Regression
Date of computationFri, 20 Nov 2009 08:37:17 -0700
Cite this page as followsStatistical Computations at FreeStatistics.org, Office for Research Development and Education, URL https://freestatistics.org/blog/index.php?v=date/2009/Nov/20/t1258731716deyxzjsv6jmj4g0.htm/, Retrieved Sat, 20 Apr 2024 01:37:29 +0000
Statistical Computations at FreeStatistics.org, Office for Research Development and Education, URL https://freestatistics.org/blog/index.php?pk=58276, Retrieved Sat, 20 Apr 2024 01:37:29 +0000
QR Codes:

Original text written by user:
IsPrivate?No (this computation is public)
User-defined keywords
Estimated Impact130
Family? (F = Feedback message, R = changed R code, M = changed R Module, P = changed Parameters, D = changed Data)
-       [Multiple Regression] [] [2009-11-20 15:37:17] [fd7715938ba69fff5a3edaf7913b7ba1] [Current]
Feedback Forum

Post a new message
Dataseries X:
101.6	595454	594167	611324	612613	610763
94.6	590865	595454	594167	611324	612613
95.9	589379	590865	595454	594167	611324
104.7	584428	589379	590865	595454	594167
102.8	573100	584428	589379	590865	595454
98.1	567456	573100	584428	589379	590865
113.9	569028	567456	573100	584428	589379
80.9	620735	569028	567456	573100	584428
95.7	628884	620735	569028	567456	573100
113.2	628232	628884	620735	569028	567456
105.9	612117	628232	628884	620735	569028
108.8	595404	612117	628232	628884	620735
102.3	597141	595404	612117	628232	628884
99	593408	597141	595404	612117	628232
100.7	590072	593408	597141	595404	612117
115.5	579799	590072	593408	597141	595404
100.7	574205	579799	590072	593408	597141
109.9	572775	574205	579799	590072	593408
114.6	572942	572775	574205	579799	590072
85.4	619567	572942	572775	574205	579799
100.5	625809	619567	572942	572775	574205
114.8	619916	625809	619567	572942	572775
116.5	587625	619916	625809	619567	572942
112.9	565742	587625	619916	625809	619567
102	557274	565742	587625	619916	625809
106	560576	557274	565742	587625	619916
105.3	548854	560576	557274	565742	587625
118.8	531673	548854	560576	557274	565742
106.1	525919	531673	548854	560576	557274
109.3	511038	525919	531673	548854	560576
117.2	498662	511038	525919	531673	548854
92.5	555362	498662	511038	525919	531673
104.2	564591	555362	498662	511038	525919
112.5	541657	564591	555362	498662	511038
122.4	527070	541657	564591	555362	498662
113.3	509846	527070	541657	564591	555362
100	514258	509846	527070	541657	564591
110.7	516922	514258	509846	527070	541657
112.8	507561	516922	514258	509846	527070
109.8	492622	507561	516922	514258	509846
117.3	490243	492622	507561	516922	514258
109.1	469357	490243	492622	507561	516922
115.9	477580	469357	490243	492622	507561
96	528379	477580	469357	490243	492622
99.8	533590	528379	477580	469357	490243
116.8	517945	533590	528379	477580	469357
115.7	506174	517945	533590	528379	477580
99.4	501866	506174	517945	533590	528379
94.3	516141	501866	506174	517945	533590
91	528222	516141	501866	506174	517945
93.2	532638	528222	516141	501866	506174
103.1	536322	532638	528222	516141	501866
94.1	536535	536322	532638	528222	516141
91.8	523597	536535	536322	532638	528222
102.7	536214	523597	536535	536322	532638
82.6	586570	536214	523597	536535	536322
89.1	596594	586570	536214	523597	536535


Summary of computational transaction
Raw Inputview raw input (R code)
Raw Outputview raw output of R engine
Computing time3 seconds
R Server'Gwilym Jenkins' @ 72.249.127.135

\begin{tabular}{lllllllll}
\hline
Summary of computational transaction \tabularnewline
Raw Input & view raw input (R code)  \tabularnewline
Raw Output & view raw output of R engine  \tabularnewline
Computing time & 3 seconds \tabularnewline
R Server & 'Gwilym Jenkins' @ 72.249.127.135 \tabularnewline
\hline
\end{tabular}
%Source: https://freestatistics.org/blog/index.php?pk=58276&T=0

[TABLE]
[ROW][C]Summary of computational transaction[/C][/ROW]
[ROW][C]Raw Input[/C][C]view raw input (R code) [/C][/ROW]
[ROW][C]Raw Output[/C][C]view raw output of R engine [/C][/ROW]
[ROW][C]Computing time[/C][C]3 seconds[/C][/ROW]
[ROW][C]R Server[/C][C]'Gwilym Jenkins' @ 72.249.127.135[/C][/ROW]
[/TABLE]
Source: https://freestatistics.org/blog/index.php?pk=58276&T=0

Globally Unique Identifier (entire table): ba.freestatistics.org/blog/index.php?pk=58276&T=0

As an alternative you can also use a QR Code:  

The GUIDs for individual cells are displayed in the table below:

Summary of computational transaction
Raw Inputview raw input (R code)
Raw Outputview raw output of R engine
Computing time3 seconds
R Server'Gwilym Jenkins' @ 72.249.127.135


Multiple Linear Regression - Estimated Regression Equation
Niet_werkende_werkzoekenden[t] = + 68970.6356205958 -418.292868757629X[t] + 0.930452455967116y1[t] + 0.0330128831486056y2[t] + 0.187881114683878y3[t] -0.219786393126637y4[t] + 17114.8877611796M1[t] + 18207.1937484543M2[t] + 12179.1884528439M3[t] + 7221.81459494864M4[t] + 8205.4763419188M5[t] + 3015.34139103115M6[t] + 20206.3648793463M7[t] + 58365.2100442902M8[t] + 23794.5572772682M9[t] + 7833.16211110014M10[t] -10011.4779756030M11[t] -53.8205884163031t + e[t]

\begin{tabular}{lllllllll}
\hline
Multiple Linear Regression - Estimated Regression Equation \tabularnewline
Niet_werkende_werkzoekenden[t] =  +  68970.6356205958 -418.292868757629X[t] +  0.930452455967116y1[t] +  0.0330128831486056y2[t] +  0.187881114683878y3[t] -0.219786393126637y4[t] +  17114.8877611796M1[t] +  18207.1937484543M2[t] +  12179.1884528439M3[t] +  7221.81459494864M4[t] +  8205.4763419188M5[t] +  3015.34139103115M6[t] +  20206.3648793463M7[t] +  58365.2100442902M8[t] +  23794.5572772682M9[t] +  7833.16211110014M10[t] -10011.4779756030M11[t] -53.8205884163031t  + e[t] \tabularnewline
\hline
\end{tabular}
%Source: https://freestatistics.org/blog/index.php?pk=58276&T=1

[TABLE]
[ROW][C]Multiple Linear Regression - Estimated Regression Equation[/C][/ROW]
[ROW][C]Niet_werkende_werkzoekenden[t] =  +  68970.6356205958 -418.292868757629X[t] +  0.930452455967116y1[t] +  0.0330128831486056y2[t] +  0.187881114683878y3[t] -0.219786393126637y4[t] +  17114.8877611796M1[t] +  18207.1937484543M2[t] +  12179.1884528439M3[t] +  7221.81459494864M4[t] +  8205.4763419188M5[t] +  3015.34139103115M6[t] +  20206.3648793463M7[t] +  58365.2100442902M8[t] +  23794.5572772682M9[t] +  7833.16211110014M10[t] -10011.4779756030M11[t] -53.8205884163031t  + e[t][/C][/ROW]
[/TABLE]
Source: https://freestatistics.org/blog/index.php?pk=58276&T=1

Globally Unique Identifier (entire table): ba.freestatistics.org/blog/index.php?pk=58276&T=1

As an alternative you can also use a QR Code:  

The GUIDs for individual cells are displayed in the table below:

Multiple Linear Regression - Estimated Regression Equation
Niet_werkende_werkzoekenden[t] = + 68970.6356205958 -418.292868757629X[t] + 0.930452455967116y1[t] + 0.0330128831486056y2[t] + 0.187881114683878y3[t] -0.219786393126637y4[t] + 17114.8877611796M1[t] + 18207.1937484543M2[t] + 12179.1884528439M3[t] + 7221.81459494864M4[t] + 8205.4763419188M5[t] + 3015.34139103115M6[t] + 20206.3648793463M7[t] + 58365.2100442902M8[t] + 23794.5572772682M9[t] + 7833.16211110014M10[t] -10011.4779756030M11[t] -53.8205884163031t + e[t]


Multiple Linear Regression - Ordinary Least Squares
VariableParameterS.D.T-STATH0: parameter = 02-tail p-value1-tail p-value
(Intercept)68970.635620595842530.5998971.62170.1129320.056466
X-418.292868757629205.895392-2.03160.049050.024525
y10.9304524559671160.1621675.73761e-061e-06
y20.03301288314860560.2110660.15640.8765170.438258
y30.1878811146838780.2203740.85260.3991120.199556
y4-0.2197863931266370.143742-1.5290.1343280.067164
M117114.88776117965565.0022893.07550.003830.001915
M218207.19374845436728.2465882.70610.0100460.005023
M312179.18845284397006.0314811.73840.0900330.045017
M47221.814594948645854.4950091.23360.2247530.112377
M58205.47634191885106.2334841.6070.1161320.058066
M63015.341391031155469.5092610.55130.5845730.292286
M720206.36487934635608.5390993.60280.000880.00044
M858365.21004429027108.1725928.21100
M923794.557277268212273.1066611.93880.0597920.029896
M107833.1621111001412856.1674140.60930.5458640.272932
M11-10011.47797560308789.739214-1.1390.2616530.130826
t-53.8205884163031112.933153-0.47660.6363280.318164

\begin{tabular}{lllllllll}
\hline
Multiple Linear Regression - Ordinary Least Squares \tabularnewline
Variable & Parameter & S.D. & T-STATH0: parameter = 0 & 2-tail p-value & 1-tail p-value \tabularnewline
(Intercept) & 68970.6356205958 & 42530.599897 & 1.6217 & 0.112932 & 0.056466 \tabularnewline
X & -418.292868757629 & 205.895392 & -2.0316 & 0.04905 & 0.024525 \tabularnewline
y1 & 0.930452455967116 & 0.162167 & 5.7376 & 1e-06 & 1e-06 \tabularnewline
y2 & 0.0330128831486056 & 0.211066 & 0.1564 & 0.876517 & 0.438258 \tabularnewline
y3 & 0.187881114683878 & 0.220374 & 0.8526 & 0.399112 & 0.199556 \tabularnewline
y4 & -0.219786393126637 & 0.143742 & -1.529 & 0.134328 & 0.067164 \tabularnewline
M1 & 17114.8877611796 & 5565.002289 & 3.0755 & 0.00383 & 0.001915 \tabularnewline
M2 & 18207.1937484543 & 6728.246588 & 2.7061 & 0.010046 & 0.005023 \tabularnewline
M3 & 12179.1884528439 & 7006.031481 & 1.7384 & 0.090033 & 0.045017 \tabularnewline
M4 & 7221.81459494864 & 5854.495009 & 1.2336 & 0.224753 & 0.112377 \tabularnewline
M5 & 8205.4763419188 & 5106.233484 & 1.607 & 0.116132 & 0.058066 \tabularnewline
M6 & 3015.34139103115 & 5469.509261 & 0.5513 & 0.584573 & 0.292286 \tabularnewline
M7 & 20206.3648793463 & 5608.539099 & 3.6028 & 0.00088 & 0.00044 \tabularnewline
M8 & 58365.2100442902 & 7108.172592 & 8.211 & 0 & 0 \tabularnewline
M9 & 23794.5572772682 & 12273.106661 & 1.9388 & 0.059792 & 0.029896 \tabularnewline
M10 & 7833.16211110014 & 12856.167414 & 0.6093 & 0.545864 & 0.272932 \tabularnewline
M11 & -10011.4779756030 & 8789.739214 & -1.139 & 0.261653 & 0.130826 \tabularnewline
t & -53.8205884163031 & 112.933153 & -0.4766 & 0.636328 & 0.318164 \tabularnewline
\hline
\end{tabular}
%Source: https://freestatistics.org/blog/index.php?pk=58276&T=2

[TABLE]
[ROW][C]Multiple Linear Regression - Ordinary Least Squares[/C][/ROW]
[ROW][C]Variable[/C][C]Parameter[/C][C]S.D.[/C][C]T-STATH0: parameter = 0[/C][C]2-tail p-value[/C][C]1-tail p-value[/C][/ROW]
[ROW][C](Intercept)[/C][C]68970.6356205958[/C][C]42530.599897[/C][C]1.6217[/C][C]0.112932[/C][C]0.056466[/C][/ROW]
[ROW][C]X[/C][C]-418.292868757629[/C][C]205.895392[/C][C]-2.0316[/C][C]0.04905[/C][C]0.024525[/C][/ROW]
[ROW][C]y1[/C][C]0.930452455967116[/C][C]0.162167[/C][C]5.7376[/C][C]1e-06[/C][C]1e-06[/C][/ROW]
[ROW][C]y2[/C][C]0.0330128831486056[/C][C]0.211066[/C][C]0.1564[/C][C]0.876517[/C][C]0.438258[/C][/ROW]
[ROW][C]y3[/C][C]0.187881114683878[/C][C]0.220374[/C][C]0.8526[/C][C]0.399112[/C][C]0.199556[/C][/ROW]
[ROW][C]y4[/C][C]-0.219786393126637[/C][C]0.143742[/C][C]-1.529[/C][C]0.134328[/C][C]0.067164[/C][/ROW]
[ROW][C]M1[/C][C]17114.8877611796[/C][C]5565.002289[/C][C]3.0755[/C][C]0.00383[/C][C]0.001915[/C][/ROW]
[ROW][C]M2[/C][C]18207.1937484543[/C][C]6728.246588[/C][C]2.7061[/C][C]0.010046[/C][C]0.005023[/C][/ROW]
[ROW][C]M3[/C][C]12179.1884528439[/C][C]7006.031481[/C][C]1.7384[/C][C]0.090033[/C][C]0.045017[/C][/ROW]
[ROW][C]M4[/C][C]7221.81459494864[/C][C]5854.495009[/C][C]1.2336[/C][C]0.224753[/C][C]0.112377[/C][/ROW]
[ROW][C]M5[/C][C]8205.4763419188[/C][C]5106.233484[/C][C]1.607[/C][C]0.116132[/C][C]0.058066[/C][/ROW]
[ROW][C]M6[/C][C]3015.34139103115[/C][C]5469.509261[/C][C]0.5513[/C][C]0.584573[/C][C]0.292286[/C][/ROW]
[ROW][C]M7[/C][C]20206.3648793463[/C][C]5608.539099[/C][C]3.6028[/C][C]0.00088[/C][C]0.00044[/C][/ROW]
[ROW][C]M8[/C][C]58365.2100442902[/C][C]7108.172592[/C][C]8.211[/C][C]0[/C][C]0[/C][/ROW]
[ROW][C]M9[/C][C]23794.5572772682[/C][C]12273.106661[/C][C]1.9388[/C][C]0.059792[/C][C]0.029896[/C][/ROW]
[ROW][C]M10[/C][C]7833.16211110014[/C][C]12856.167414[/C][C]0.6093[/C][C]0.545864[/C][C]0.272932[/C][/ROW]
[ROW][C]M11[/C][C]-10011.4779756030[/C][C]8789.739214[/C][C]-1.139[/C][C]0.261653[/C][C]0.130826[/C][/ROW]
[ROW][C]t[/C][C]-53.8205884163031[/C][C]112.933153[/C][C]-0.4766[/C][C]0.636328[/C][C]0.318164[/C][/ROW]
[/TABLE]
Source: https://freestatistics.org/blog/index.php?pk=58276&T=2

Globally Unique Identifier (entire table): ba.freestatistics.org/blog/index.php?pk=58276&T=2

As an alternative you can also use a QR Code:  

The GUIDs for individual cells are displayed in the table below:

Multiple Linear Regression - Ordinary Least Squares
VariableParameterS.D.T-STATH0: parameter = 02-tail p-value1-tail p-value
(Intercept)68970.635620595842530.5998971.62170.1129320.056466
X-418.292868757629205.895392-2.03160.049050.024525
y10.9304524559671160.1621675.73761e-061e-06
y20.03301288314860560.2110660.15640.8765170.438258
y30.1878811146838780.2203740.85260.3991120.199556
y4-0.2197863931266370.143742-1.5290.1343280.067164
M117114.88776117965565.0022893.07550.003830.001915
M218207.19374845436728.2465882.70610.0100460.005023
M312179.18845284397006.0314811.73840.0900330.045017
M47221.814594948645854.4950091.23360.2247530.112377
M58205.47634191885106.2334841.6070.1161320.058066
M63015.341391031155469.5092610.55130.5845730.292286
M720206.36487934635608.5390993.60280.000880.00044
M858365.21004429027108.1725928.21100
M923794.557277268212273.1066611.93880.0597920.029896
M107833.1621111001412856.1674140.60930.5458640.272932
M11-10011.47797560308789.739214-1.1390.2616530.130826
t-53.8205884163031112.933153-0.47660.6363280.318164


Multiple Linear Regression - Regression Statistics
Multiple R0.990937737242827
R-squared0.981957599091935
Adjusted R-squared0.974092962798675
F-TEST (value)124.857343998675
F-TEST (DF numerator)17
F-TEST (DF denominator)39
p-value0
Multiple Linear Regression - Residual Statistics
Residual Standard Deviation6734.34761480654
Sum Squared Residuals1768706074.08497

\begin{tabular}{lllllllll}
\hline
Multiple Linear Regression - Regression Statistics \tabularnewline
Multiple R & 0.990937737242827 \tabularnewline
R-squared & 0.981957599091935 \tabularnewline
Adjusted R-squared & 0.974092962798675 \tabularnewline
F-TEST (value) & 124.857343998675 \tabularnewline
F-TEST (DF numerator) & 17 \tabularnewline
F-TEST (DF denominator) & 39 \tabularnewline
p-value & 0 \tabularnewline
Multiple Linear Regression - Residual Statistics \tabularnewline
Residual Standard Deviation & 6734.34761480654 \tabularnewline
Sum Squared Residuals & 1768706074.08497 \tabularnewline
\hline
\end{tabular}
%Source: https://freestatistics.org/blog/index.php?pk=58276&T=3

[TABLE]
[ROW][C]Multiple Linear Regression - Regression Statistics[/C][/ROW]
[ROW][C]Multiple R[/C][C]0.990937737242827[/C][/ROW]
[ROW][C]R-squared[/C][C]0.981957599091935[/C][/ROW]
[ROW][C]Adjusted R-squared[/C][C]0.974092962798675[/C][/ROW]
[ROW][C]F-TEST (value)[/C][C]124.857343998675[/C][/ROW]
[ROW][C]F-TEST (DF numerator)[/C][C]17[/C][/ROW]
[ROW][C]F-TEST (DF denominator)[/C][C]39[/C][/ROW]
[ROW][C]p-value[/C][C]0[/C][/ROW]
[ROW][C]Multiple Linear Regression - Residual Statistics[/C][/ROW]
[ROW][C]Residual Standard Deviation[/C][C]6734.34761480654[/C][/ROW]
[ROW][C]Sum Squared Residuals[/C][C]1768706074.08497[/C][/ROW]
[/TABLE]
Source: https://freestatistics.org/blog/index.php?pk=58276&T=3

Globally Unique Identifier (entire table): ba.freestatistics.org/blog/index.php?pk=58276&T=3

As an alternative you can also use a QR Code:  

The GUIDs for individual cells are displayed in the table below:

Multiple Linear Regression - Regression Statistics
Multiple R0.990937737242827
R-squared0.981957599091935
Adjusted R-squared0.974092962798675
F-TEST (value)124.857343998675
F-TEST (DF numerator)17
F-TEST (DF denominator)39
p-value0
Multiple Linear Regression - Residual Statistics
Residual Standard Deviation6734.34761480654
Sum Squared Residuals1768706074.08497


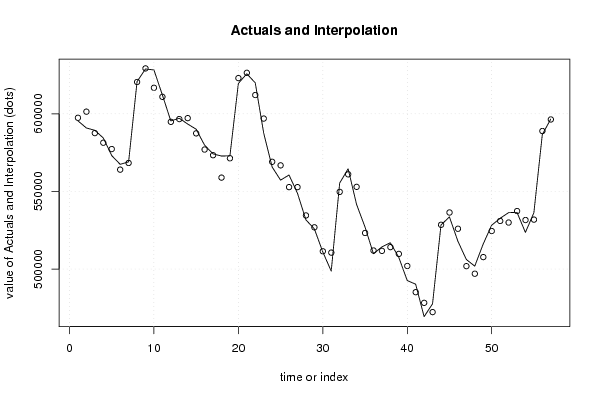
Multiple Linear Regression - Actuals, Interpolation, and Residuals
Time or IndexActualsInterpolationForecastResidualsPrediction Error
1595454597419.875994766-1965.87599476635
2590865601368.718165465-10503.7181654651
3589379587575.5811883411803.41881165846
4584428581361.9391680993066.06083190139
5573100577285.758000202-4185.75800020164
6567456564033.5751600323422.42483996780
7569028568332.710313161695.289686839065
8620735620477.591272211257.408727789035
9628884629254.524102224-370.524102223715
10628232616744.26087211211487.7391278883
11612117610930.9697093741186.0302906255
12595404594826.360223601577.639776398962
13597141596610.138730408530.861269592154
14593408597209.038761307-3801.03876130654
15590072587401.880015822670.11998418011
16579799576972.3641105272826.63588947326
17574205573341.141502384863.858497616324
18572775558898.490390213876.5096097998
19572942571357.6004428951584.39955710515
20619567622991.812585438-3424.81258543762
21625809626399.790911864-590.79091186413
22619916612095.767729327820.23227068054
23587625596932.371915395-9307.37191539508
24565742569081.311792408-3339.31179240771
25557274566795.571056221-9521.57105622053
26560576552787.7248014167788.27519858387
27548854552777.224828446-3923.22482844574
28531673534539.929866863-2866.92986686344
29525919526890.544414083-971.544414082744
30511038511458.956821315-420.956821314821
31498662510603.977599991-11941.9775999914
32555362549729.3738120675632.62618793326
33564591561027.7527420923563.24725790764
34541657552945.107008256-11288.1070082559
35527070523244.1618097763825.83819022427
36509846511950.723182472-2104.72318247165
37514258511730.1393753192527.86062468074
38516922514129.3927349192792.60726508106
39507561509763.489806872-2202.48980687243
40492622501999.687160432-9377.6871604319
41490243485114.08668755128.91331250016
42469357478249.14075206-8892.14075206053
43477580472280.6489538645299.35104613632
44528379528507.72484173-128.724841729892
45533590536430.044701778-2840.04470177786
46517945525964.864390313-8019.86439031294
47506174501878.4965654554295.5034345453
48501866496999.604801524866.3951984804
49516141507712.2748432868428.725156714
50528222524498.1255368933723.8744631067
51532638530985.824160521652.1758394796
52536322529970.0796940796351.9203059207
53536535537370.469395832-835.469395832101
54523597531582.836876392-7985.83687639227
55536214531851.0626900894362.93730991082
56586570588906.497488555-2336.49748855479
57596594596355.887542042238.112457958066

\begin{tabular}{lllllllll}
\hline
Multiple Linear Regression - Actuals, Interpolation, and Residuals \tabularnewline
Time or Index & Actuals & InterpolationForecast & ResidualsPrediction Error \tabularnewline
1 & 595454 & 597419.875994766 & -1965.87599476635 \tabularnewline
2 & 590865 & 601368.718165465 & -10503.7181654651 \tabularnewline
3 & 589379 & 587575.581188341 & 1803.41881165846 \tabularnewline
4 & 584428 & 581361.939168099 & 3066.06083190139 \tabularnewline
5 & 573100 & 577285.758000202 & -4185.75800020164 \tabularnewline
6 & 567456 & 564033.575160032 & 3422.42483996780 \tabularnewline
7 & 569028 & 568332.710313161 & 695.289686839065 \tabularnewline
8 & 620735 & 620477.591272211 & 257.408727789035 \tabularnewline
9 & 628884 & 629254.524102224 & -370.524102223715 \tabularnewline
10 & 628232 & 616744.260872112 & 11487.7391278883 \tabularnewline
11 & 612117 & 610930.969709374 & 1186.0302906255 \tabularnewline
12 & 595404 & 594826.360223601 & 577.639776398962 \tabularnewline
13 & 597141 & 596610.138730408 & 530.861269592154 \tabularnewline
14 & 593408 & 597209.038761307 & -3801.03876130654 \tabularnewline
15 & 590072 & 587401.88001582 & 2670.11998418011 \tabularnewline
16 & 579799 & 576972.364110527 & 2826.63588947326 \tabularnewline
17 & 574205 & 573341.141502384 & 863.858497616324 \tabularnewline
18 & 572775 & 558898.4903902 & 13876.5096097998 \tabularnewline
19 & 572942 & 571357.600442895 & 1584.39955710515 \tabularnewline
20 & 619567 & 622991.812585438 & -3424.81258543762 \tabularnewline
21 & 625809 & 626399.790911864 & -590.79091186413 \tabularnewline
22 & 619916 & 612095.76772932 & 7820.23227068054 \tabularnewline
23 & 587625 & 596932.371915395 & -9307.37191539508 \tabularnewline
24 & 565742 & 569081.311792408 & -3339.31179240771 \tabularnewline
25 & 557274 & 566795.571056221 & -9521.57105622053 \tabularnewline
26 & 560576 & 552787.724801416 & 7788.27519858387 \tabularnewline
27 & 548854 & 552777.224828446 & -3923.22482844574 \tabularnewline
28 & 531673 & 534539.929866863 & -2866.92986686344 \tabularnewline
29 & 525919 & 526890.544414083 & -971.544414082744 \tabularnewline
30 & 511038 & 511458.956821315 & -420.956821314821 \tabularnewline
31 & 498662 & 510603.977599991 & -11941.9775999914 \tabularnewline
32 & 555362 & 549729.373812067 & 5632.62618793326 \tabularnewline
33 & 564591 & 561027.752742092 & 3563.24725790764 \tabularnewline
34 & 541657 & 552945.107008256 & -11288.1070082559 \tabularnewline
35 & 527070 & 523244.161809776 & 3825.83819022427 \tabularnewline
36 & 509846 & 511950.723182472 & -2104.72318247165 \tabularnewline
37 & 514258 & 511730.139375319 & 2527.86062468074 \tabularnewline
38 & 516922 & 514129.392734919 & 2792.60726508106 \tabularnewline
39 & 507561 & 509763.489806872 & -2202.48980687243 \tabularnewline
40 & 492622 & 501999.687160432 & -9377.6871604319 \tabularnewline
41 & 490243 & 485114.0866875 & 5128.91331250016 \tabularnewline
42 & 469357 & 478249.14075206 & -8892.14075206053 \tabularnewline
43 & 477580 & 472280.648953864 & 5299.35104613632 \tabularnewline
44 & 528379 & 528507.72484173 & -128.724841729892 \tabularnewline
45 & 533590 & 536430.044701778 & -2840.04470177786 \tabularnewline
46 & 517945 & 525964.864390313 & -8019.86439031294 \tabularnewline
47 & 506174 & 501878.496565455 & 4295.5034345453 \tabularnewline
48 & 501866 & 496999.60480152 & 4866.3951984804 \tabularnewline
49 & 516141 & 507712.274843286 & 8428.725156714 \tabularnewline
50 & 528222 & 524498.125536893 & 3723.8744631067 \tabularnewline
51 & 532638 & 530985.82416052 & 1652.1758394796 \tabularnewline
52 & 536322 & 529970.079694079 & 6351.9203059207 \tabularnewline
53 & 536535 & 537370.469395832 & -835.469395832101 \tabularnewline
54 & 523597 & 531582.836876392 & -7985.83687639227 \tabularnewline
55 & 536214 & 531851.062690089 & 4362.93730991082 \tabularnewline
56 & 586570 & 588906.497488555 & -2336.49748855479 \tabularnewline
57 & 596594 & 596355.887542042 & 238.112457958066 \tabularnewline
\hline
\end{tabular}
%Source: https://freestatistics.org/blog/index.php?pk=58276&T=4

[TABLE]
[ROW][C]Multiple Linear Regression - Actuals, Interpolation, and Residuals[/C][/ROW]
[ROW][C]Time or Index[/C][C]Actuals[/C][C]InterpolationForecast[/C][C]ResidualsPrediction Error[/C][/ROW]
[ROW][C]1[/C][C]595454[/C][C]597419.875994766[/C][C]-1965.87599476635[/C][/ROW]
[ROW][C]2[/C][C]590865[/C][C]601368.718165465[/C][C]-10503.7181654651[/C][/ROW]
[ROW][C]3[/C][C]589379[/C][C]587575.581188341[/C][C]1803.41881165846[/C][/ROW]
[ROW][C]4[/C][C]584428[/C][C]581361.939168099[/C][C]3066.06083190139[/C][/ROW]
[ROW][C]5[/C][C]573100[/C][C]577285.758000202[/C][C]-4185.75800020164[/C][/ROW]
[ROW][C]6[/C][C]567456[/C][C]564033.575160032[/C][C]3422.42483996780[/C][/ROW]
[ROW][C]7[/C][C]569028[/C][C]568332.710313161[/C][C]695.289686839065[/C][/ROW]
[ROW][C]8[/C][C]620735[/C][C]620477.591272211[/C][C]257.408727789035[/C][/ROW]
[ROW][C]9[/C][C]628884[/C][C]629254.524102224[/C][C]-370.524102223715[/C][/ROW]
[ROW][C]10[/C][C]628232[/C][C]616744.260872112[/C][C]11487.7391278883[/C][/ROW]
[ROW][C]11[/C][C]612117[/C][C]610930.969709374[/C][C]1186.0302906255[/C][/ROW]
[ROW][C]12[/C][C]595404[/C][C]594826.360223601[/C][C]577.639776398962[/C][/ROW]
[ROW][C]13[/C][C]597141[/C][C]596610.138730408[/C][C]530.861269592154[/C][/ROW]
[ROW][C]14[/C][C]593408[/C][C]597209.038761307[/C][C]-3801.03876130654[/C][/ROW]
[ROW][C]15[/C][C]590072[/C][C]587401.88001582[/C][C]2670.11998418011[/C][/ROW]
[ROW][C]16[/C][C]579799[/C][C]576972.364110527[/C][C]2826.63588947326[/C][/ROW]
[ROW][C]17[/C][C]574205[/C][C]573341.141502384[/C][C]863.858497616324[/C][/ROW]
[ROW][C]18[/C][C]572775[/C][C]558898.4903902[/C][C]13876.5096097998[/C][/ROW]
[ROW][C]19[/C][C]572942[/C][C]571357.600442895[/C][C]1584.39955710515[/C][/ROW]
[ROW][C]20[/C][C]619567[/C][C]622991.812585438[/C][C]-3424.81258543762[/C][/ROW]
[ROW][C]21[/C][C]625809[/C][C]626399.790911864[/C][C]-590.79091186413[/C][/ROW]
[ROW][C]22[/C][C]619916[/C][C]612095.76772932[/C][C]7820.23227068054[/C][/ROW]
[ROW][C]23[/C][C]587625[/C][C]596932.371915395[/C][C]-9307.37191539508[/C][/ROW]
[ROW][C]24[/C][C]565742[/C][C]569081.311792408[/C][C]-3339.31179240771[/C][/ROW]
[ROW][C]25[/C][C]557274[/C][C]566795.571056221[/C][C]-9521.57105622053[/C][/ROW]
[ROW][C]26[/C][C]560576[/C][C]552787.724801416[/C][C]7788.27519858387[/C][/ROW]
[ROW][C]27[/C][C]548854[/C][C]552777.224828446[/C][C]-3923.22482844574[/C][/ROW]
[ROW][C]28[/C][C]531673[/C][C]534539.929866863[/C][C]-2866.92986686344[/C][/ROW]
[ROW][C]29[/C][C]525919[/C][C]526890.544414083[/C][C]-971.544414082744[/C][/ROW]
[ROW][C]30[/C][C]511038[/C][C]511458.956821315[/C][C]-420.956821314821[/C][/ROW]
[ROW][C]31[/C][C]498662[/C][C]510603.977599991[/C][C]-11941.9775999914[/C][/ROW]
[ROW][C]32[/C][C]555362[/C][C]549729.373812067[/C][C]5632.62618793326[/C][/ROW]
[ROW][C]33[/C][C]564591[/C][C]561027.752742092[/C][C]3563.24725790764[/C][/ROW]
[ROW][C]34[/C][C]541657[/C][C]552945.107008256[/C][C]-11288.1070082559[/C][/ROW]
[ROW][C]35[/C][C]527070[/C][C]523244.161809776[/C][C]3825.83819022427[/C][/ROW]
[ROW][C]36[/C][C]509846[/C][C]511950.723182472[/C][C]-2104.72318247165[/C][/ROW]
[ROW][C]37[/C][C]514258[/C][C]511730.139375319[/C][C]2527.86062468074[/C][/ROW]
[ROW][C]38[/C][C]516922[/C][C]514129.392734919[/C][C]2792.60726508106[/C][/ROW]
[ROW][C]39[/C][C]507561[/C][C]509763.489806872[/C][C]-2202.48980687243[/C][/ROW]
[ROW][C]40[/C][C]492622[/C][C]501999.687160432[/C][C]-9377.6871604319[/C][/ROW]
[ROW][C]41[/C][C]490243[/C][C]485114.0866875[/C][C]5128.91331250016[/C][/ROW]
[ROW][C]42[/C][C]469357[/C][C]478249.14075206[/C][C]-8892.14075206053[/C][/ROW]
[ROW][C]43[/C][C]477580[/C][C]472280.648953864[/C][C]5299.35104613632[/C][/ROW]
[ROW][C]44[/C][C]528379[/C][C]528507.72484173[/C][C]-128.724841729892[/C][/ROW]
[ROW][C]45[/C][C]533590[/C][C]536430.044701778[/C][C]-2840.04470177786[/C][/ROW]
[ROW][C]46[/C][C]517945[/C][C]525964.864390313[/C][C]-8019.86439031294[/C][/ROW]
[ROW][C]47[/C][C]506174[/C][C]501878.496565455[/C][C]4295.5034345453[/C][/ROW]
[ROW][C]48[/C][C]501866[/C][C]496999.60480152[/C][C]4866.3951984804[/C][/ROW]
[ROW][C]49[/C][C]516141[/C][C]507712.274843286[/C][C]8428.725156714[/C][/ROW]
[ROW][C]50[/C][C]528222[/C][C]524498.125536893[/C][C]3723.8744631067[/C][/ROW]
[ROW][C]51[/C][C]532638[/C][C]530985.82416052[/C][C]1652.1758394796[/C][/ROW]
[ROW][C]52[/C][C]536322[/C][C]529970.079694079[/C][C]6351.9203059207[/C][/ROW]
[ROW][C]53[/C][C]536535[/C][C]537370.469395832[/C][C]-835.469395832101[/C][/ROW]
[ROW][C]54[/C][C]523597[/C][C]531582.836876392[/C][C]-7985.83687639227[/C][/ROW]
[ROW][C]55[/C][C]536214[/C][C]531851.062690089[/C][C]4362.93730991082[/C][/ROW]
[ROW][C]56[/C][C]586570[/C][C]588906.497488555[/C][C]-2336.49748855479[/C][/ROW]
[ROW][C]57[/C][C]596594[/C][C]596355.887542042[/C][C]238.112457958066[/C][/ROW]
[/TABLE]
Source: https://freestatistics.org/blog/index.php?pk=58276&T=4

Globally Unique Identifier (entire table): ba.freestatistics.org/blog/index.php?pk=58276&T=4

As an alternative you can also use a QR Code:  

The GUIDs for individual cells are displayed in the table below:

Multiple Linear Regression - Actuals, Interpolation, and Residuals
Time or IndexActualsInterpolationForecastResidualsPrediction Error
1595454597419.875994766-1965.87599476635
2590865601368.718165465-10503.7181654651
3589379587575.5811883411803.41881165846
4584428581361.9391680993066.06083190139
5573100577285.758000202-4185.75800020164
6567456564033.5751600323422.42483996780
7569028568332.710313161695.289686839065
8620735620477.591272211257.408727789035
9628884629254.524102224-370.524102223715
10628232616744.26087211211487.7391278883
11612117610930.9697093741186.0302906255
12595404594826.360223601577.639776398962
13597141596610.138730408530.861269592154
14593408597209.038761307-3801.03876130654
15590072587401.880015822670.11998418011
16579799576972.3641105272826.63588947326
17574205573341.141502384863.858497616324
18572775558898.490390213876.5096097998
19572942571357.6004428951584.39955710515
20619567622991.812585438-3424.81258543762
21625809626399.790911864-590.79091186413
22619916612095.767729327820.23227068054
23587625596932.371915395-9307.37191539508
24565742569081.311792408-3339.31179240771
25557274566795.571056221-9521.57105622053
26560576552787.7248014167788.27519858387
27548854552777.224828446-3923.22482844574
28531673534539.929866863-2866.92986686344
29525919526890.544414083-971.544414082744
30511038511458.956821315-420.956821314821
31498662510603.977599991-11941.9775999914
32555362549729.3738120675632.62618793326
33564591561027.7527420923563.24725790764
34541657552945.107008256-11288.1070082559
35527070523244.1618097763825.83819022427
36509846511950.723182472-2104.72318247165
37514258511730.1393753192527.86062468074
38516922514129.3927349192792.60726508106
39507561509763.489806872-2202.48980687243
40492622501999.687160432-9377.6871604319
41490243485114.08668755128.91331250016
42469357478249.14075206-8892.14075206053
43477580472280.6489538645299.35104613632
44528379528507.72484173-128.724841729892
45533590536430.044701778-2840.04470177786
46517945525964.864390313-8019.86439031294
47506174501878.4965654554295.5034345453
48501866496999.604801524866.3951984804
49516141507712.2748432868428.725156714
50528222524498.1255368933723.8744631067
51532638530985.824160521652.1758394796
52536322529970.0796940796351.9203059207
53536535537370.469395832-835.469395832101
54523597531582.836876392-7985.83687639227
55536214531851.0626900894362.93730991082
56586570588906.497488555-2336.49748855479
57596594596355.887542042238.112457958066


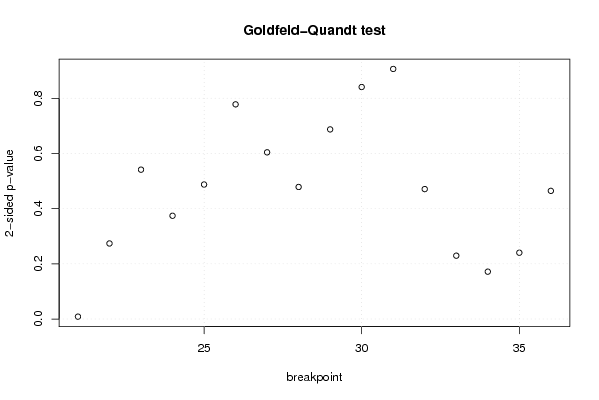
Goldfeld-Quandt test for Heteroskedasticity
p-valuesAlternative Hypothesis
breakpoint indexgreater2-sidedless
210.004328684122104980.008657368244209970.995671315877895
220.1369288824899330.2738577649798650.863071117510067
230.2706149693847680.5412299387695350.729385030615233
240.1871144061696650.3742288123393290.812885593830335
250.2437007944242930.4874015888485850.756299205575707
260.3889667221354730.7779334442709470.611033277864527
270.3020345872793040.6040691745586090.697965412720696
280.2392721772525400.4785443545050810.76072782274746
290.3435858233144650.687171646628930.656414176685535
300.420327385282740.840654770565480.57967261471726
310.5469244841126960.9061510317746080.453075515887304
320.76458077381510.47083845236980.2354192261849
330.8852269678370380.2295460643259230.114773032162962
340.9141835313781260.1716329372437490.0858164686218744
350.8798533137706790.2402933724586420.120146686229321
360.7677515013302140.4644969973395730.232248498669786

\begin{tabular}{lllllllll}
\hline
Goldfeld-Quandt test for Heteroskedasticity \tabularnewline
p-values & Alternative Hypothesis \tabularnewline
breakpoint index & greater & 2-sided & less \tabularnewline
21 & 0.00432868412210498 & 0.00865736824420997 & 0.995671315877895 \tabularnewline
22 & 0.136928882489933 & 0.273857764979865 & 0.863071117510067 \tabularnewline
23 & 0.270614969384768 & 0.541229938769535 & 0.729385030615233 \tabularnewline
24 & 0.187114406169665 & 0.374228812339329 & 0.812885593830335 \tabularnewline
25 & 0.243700794424293 & 0.487401588848585 & 0.756299205575707 \tabularnewline
26 & 0.388966722135473 & 0.777933444270947 & 0.611033277864527 \tabularnewline
27 & 0.302034587279304 & 0.604069174558609 & 0.697965412720696 \tabularnewline
28 & 0.239272177252540 & 0.478544354505081 & 0.76072782274746 \tabularnewline
29 & 0.343585823314465 & 0.68717164662893 & 0.656414176685535 \tabularnewline
30 & 0.42032738528274 & 0.84065477056548 & 0.57967261471726 \tabularnewline
31 & 0.546924484112696 & 0.906151031774608 & 0.453075515887304 \tabularnewline
32 & 0.7645807738151 & 0.4708384523698 & 0.2354192261849 \tabularnewline
33 & 0.885226967837038 & 0.229546064325923 & 0.114773032162962 \tabularnewline
34 & 0.914183531378126 & 0.171632937243749 & 0.0858164686218744 \tabularnewline
35 & 0.879853313770679 & 0.240293372458642 & 0.120146686229321 \tabularnewline
36 & 0.767751501330214 & 0.464496997339573 & 0.232248498669786 \tabularnewline
\hline
\end{tabular}
%Source: https://freestatistics.org/blog/index.php?pk=58276&T=5

[TABLE]
[ROW][C]Goldfeld-Quandt test for Heteroskedasticity[/C][/ROW]
[ROW][C]p-values[/C][C]Alternative Hypothesis[/C][/ROW]
[ROW][C]breakpoint index[/C][C]greater[/C][C]2-sided[/C][C]less[/C][/ROW]
[ROW][C]21[/C][C]0.00432868412210498[/C][C]0.00865736824420997[/C][C]0.995671315877895[/C][/ROW]
[ROW][C]22[/C][C]0.136928882489933[/C][C]0.273857764979865[/C][C]0.863071117510067[/C][/ROW]
[ROW][C]23[/C][C]0.270614969384768[/C][C]0.541229938769535[/C][C]0.729385030615233[/C][/ROW]
[ROW][C]24[/C][C]0.187114406169665[/C][C]0.374228812339329[/C][C]0.812885593830335[/C][/ROW]
[ROW][C]25[/C][C]0.243700794424293[/C][C]0.487401588848585[/C][C]0.756299205575707[/C][/ROW]
[ROW][C]26[/C][C]0.388966722135473[/C][C]0.777933444270947[/C][C]0.611033277864527[/C][/ROW]
[ROW][C]27[/C][C]0.302034587279304[/C][C]0.604069174558609[/C][C]0.697965412720696[/C][/ROW]
[ROW][C]28[/C][C]0.239272177252540[/C][C]0.478544354505081[/C][C]0.76072782274746[/C][/ROW]
[ROW][C]29[/C][C]0.343585823314465[/C][C]0.68717164662893[/C][C]0.656414176685535[/C][/ROW]
[ROW][C]30[/C][C]0.42032738528274[/C][C]0.84065477056548[/C][C]0.57967261471726[/C][/ROW]
[ROW][C]31[/C][C]0.546924484112696[/C][C]0.906151031774608[/C][C]0.453075515887304[/C][/ROW]
[ROW][C]32[/C][C]0.7645807738151[/C][C]0.4708384523698[/C][C]0.2354192261849[/C][/ROW]
[ROW][C]33[/C][C]0.885226967837038[/C][C]0.229546064325923[/C][C]0.114773032162962[/C][/ROW]
[ROW][C]34[/C][C]0.914183531378126[/C][C]0.171632937243749[/C][C]0.0858164686218744[/C][/ROW]
[ROW][C]35[/C][C]0.879853313770679[/C][C]0.240293372458642[/C][C]0.120146686229321[/C][/ROW]
[ROW][C]36[/C][C]0.767751501330214[/C][C]0.464496997339573[/C][C]0.232248498669786[/C][/ROW]
[/TABLE]
Source: https://freestatistics.org/blog/index.php?pk=58276&T=5

Globally Unique Identifier (entire table): ba.freestatistics.org/blog/index.php?pk=58276&T=5

As an alternative you can also use a QR Code:  

The GUIDs for individual cells are displayed in the table below:

Goldfeld-Quandt test for Heteroskedasticity
p-valuesAlternative Hypothesis
breakpoint indexgreater2-sidedless
210.004328684122104980.008657368244209970.995671315877895
220.1369288824899330.2738577649798650.863071117510067
230.2706149693847680.5412299387695350.729385030615233
240.1871144061696650.3742288123393290.812885593830335
250.2437007944242930.4874015888485850.756299205575707
260.3889667221354730.7779334442709470.611033277864527
270.3020345872793040.6040691745586090.697965412720696
280.2392721772525400.4785443545050810.76072782274746
290.3435858233144650.687171646628930.656414176685535
300.420327385282740.840654770565480.57967261471726
310.5469244841126960.9061510317746080.453075515887304
320.76458077381510.47083845236980.2354192261849
330.8852269678370380.2295460643259230.114773032162962
340.9141835313781260.1716329372437490.0858164686218744
350.8798533137706790.2402933724586420.120146686229321
360.7677515013302140.4644969973395730.232248498669786


Meta Analysis of Goldfeld-Quandt test for Heteroskedasticity
Description# significant tests% significant testsOK/NOK
1% type I error level10.0625NOK
5% type I error level10.0625NOK
10% type I error level10.0625OK

\begin{tabular}{lllllllll}
\hline
Meta Analysis of Goldfeld-Quandt test for Heteroskedasticity \tabularnewline
Description & # significant tests & % significant tests & OK/NOK \tabularnewline
1% type I error level & 1 & 0.0625 & NOK \tabularnewline
5% type I error level & 1 & 0.0625 & NOK \tabularnewline
10% type I error level & 1 & 0.0625 & OK \tabularnewline
\hline
\end{tabular}
%Source: https://freestatistics.org/blog/index.php?pk=58276&T=6

[TABLE]
[ROW][C]Meta Analysis of Goldfeld-Quandt test for Heteroskedasticity[/C][/ROW]
[ROW][C]Description[/C][C]# significant tests[/C][C]% significant tests[/C][C]OK/NOK[/C][/ROW]
[ROW][C]1% type I error level[/C][C]1[/C][C]0.0625[/C][C]NOK[/C][/ROW]
[ROW][C]5% type I error level[/C][C]1[/C][C]0.0625[/C][C]NOK[/C][/ROW]
[ROW][C]10% type I error level[/C][C]1[/C][C]0.0625[/C][C]OK[/C][/ROW]
[/TABLE]
Source: https://freestatistics.org/blog/index.php?pk=58276&T=6

Globally Unique Identifier (entire table): ba.freestatistics.org/blog/index.php?pk=58276&T=6

As an alternative you can also use a QR Code:  

The GUIDs for individual cells are displayed in the table below:

Meta Analysis of Goldfeld-Quandt test for Heteroskedasticity
Description# significant tests% significant testsOK/NOK
1% type I error level10.0625NOK
5% type I error level10.0625NOK
10% type I error level10.0625OK


Parameters (Session):
par1 = 2 ; par2 = Include Monthly Dummies ; par3 = Linear Trend ;
Parameters (R input):
par1 = 2 ; par2 = Include Monthly Dummies ; par3 = Linear Trend ;
R code (references can be found in the software module):
library(lattice)
library(lmtest)
n25 <- 25 #minimum number of obs. for Goldfeld-Quandt test
par1 <- as.numeric(par1)
x <- t(y)
k <- length(x[1,])
n <- length(x[,1])
x1 <- cbind(x[,par1], x[,1:k!=par1])
mycolnames <- c(colnames(x)[par1], colnames(x)[1:k!=par1])
colnames(x1) <- mycolnames #colnames(x)[par1]
x <- x1
if (par3 == 'First Differences'){
x2 <- array(0, dim=c(n-1,k), dimnames=list(1:(n-1), paste('(1-B)',colnames(x),sep='')))
for (i in 1:n-1) {
for (j in 1:k) {
x2[i,j] <- x[i+1,j] - x[i,j]
}
}
x <- x2
}
if (par2 == 'Include Monthly Dummies'){
x2 <- array(0, dim=c(n,11), dimnames=list(1:n, paste('M', seq(1:11), sep ='')))
for (i in 1:11){
x2[seq(i,n,12),i] <- 1
}
x <- cbind(x, x2)
}
if (par2 == 'Include Quarterly Dummies'){
x2 <- array(0, dim=c(n,3), dimnames=list(1:n, paste('Q', seq(1:3), sep ='')))
for (i in 1:3){
x2[seq(i,n,4),i] <- 1
}
x <- cbind(x, x2)
}
k <- length(x[1,])
if (par3 == 'Linear Trend'){
x <- cbind(x, c(1:n))
colnames(x)[k+1] <- 't'
}
x
k <- length(x[1,])
df <- as.data.frame(x)
(mylm <- lm(df))
(mysum <- summary(mylm))
if (n > n25) {
kp3 <- k + 3
nmkm3 <- n - k - 3
gqarr <- array(NA, dim=c(nmkm3-kp3+1,3))
numgqtests <- 0
numsignificant1 <- 0
numsignificant5 <- 0
numsignificant10 <- 0
for (mypoint in kp3:nmkm3) {
j <- 0
numgqtests <- numgqtests + 1
for (myalt in c('greater', 'two.sided', 'less')) {
j <- j + 1
gqarr[mypoint-kp3+1,j] <- gqtest(mylm, point=mypoint, alternative=myalt)$p.value
}
if (gqarr[mypoint-kp3+1,2] < 0.01) numsignificant1 <- numsignificant1 + 1
if (gqarr[mypoint-kp3+1,2] < 0.05) numsignificant5 <- numsignificant5 + 1
if (gqarr[mypoint-kp3+1,2] < 0.10) numsignificant10 <- numsignificant10 + 1
}
gqarr
}
bitmap(file='test0.png')
plot(x[,1], type='l', main='Actuals and Interpolation', ylab='value of Actuals and Interpolation (dots)', xlab='time or index')
points(x[,1]-mysum$resid)
grid()
dev.off()
bitmap(file='test1.png')
plot(mysum$resid, type='b', pch=19, main='Residuals', ylab='value of Residuals', xlab='time or index')
grid()
dev.off()
bitmap(file='test2.png')
hist(mysum$resid, main='Residual Histogram', xlab='values of Residuals')
grid()
dev.off()
bitmap(file='test3.png')
densityplot(~mysum$resid,col='black',main='Residual Density Plot', xlab='values of Residuals')
dev.off()
bitmap(file='test4.png')
qqnorm(mysum$resid, main='Residual Normal Q-Q Plot')
qqline(mysum$resid)
grid()
dev.off()
(myerror <- as.ts(mysum$resid))
bitmap(file='test5.png')
dum <- cbind(lag(myerror,k=1),myerror)
dum
dum1 <- dum[2:length(myerror),]
dum1
z <- as.data.frame(dum1)
z
plot(z,main=paste('Residual Lag plot, lowess, and regression line'), ylab='values of Residuals', xlab='lagged values of Residuals')
lines(lowess(z))
abline(lm(z))
grid()
dev.off()
bitmap(file='test6.png')
acf(mysum$resid, lag.max=length(mysum$resid)/2, main='Residual Autocorrelation Function')
grid()
dev.off()
bitmap(file='test7.png')
pacf(mysum$resid, lag.max=length(mysum$resid)/2, main='Residual Partial Autocorrelation Function')
grid()
dev.off()
bitmap(file='test8.png')
opar <- par(mfrow = c(2,2), oma = c(0, 0, 1.1, 0))
plot(mylm, las = 1, sub='Residual Diagnostics')
par(opar)
dev.off()
if (n > n25) {
bitmap(file='test9.png')
plot(kp3:nmkm3,gqarr[,2], main='Goldfeld-Quandt test',ylab='2-sided p-value',xlab='breakpoint')
grid()
dev.off()
}
load(file='createtable')
a<-table.start()
a<-table.row.start(a)
a<-table.element(a, 'Multiple Linear Regression - Estimated Regression Equation', 1, TRUE)
a<-table.row.end(a)
myeq <- colnames(x)[1]
myeq <- paste(myeq, '[t] = ', sep='')
for (i in 1:k){
if (mysum$coefficients[i,1] > 0) myeq <- paste(myeq, '+', '')
myeq <- paste(myeq, mysum$coefficients[i,1], sep=' ')
if (rownames(mysum$coefficients)[i] != '(Intercept)') {
myeq <- paste(myeq, rownames(mysum$coefficients)[i], sep='')
if (rownames(mysum$coefficients)[i] != 't') myeq <- paste(myeq, '[t]', sep='')
}
}
myeq <- paste(myeq, ' + e[t]')
a<-table.row.start(a)
a<-table.element(a, myeq)
a<-table.row.end(a)
a<-table.end(a)
table.save(a,file='mytable1.tab')
a<-table.start()
a<-table.row.start(a)
a<-table.element(a,hyperlink('ols1.htm','Multiple Linear Regression - Ordinary Least Squares',''), 6, TRUE)
a<-table.row.end(a)
a<-table.row.start(a)
a<-table.element(a,'Variable',header=TRUE)
a<-table.element(a,'Parameter',header=TRUE)
a<-table.element(a,'S.D.',header=TRUE)
a<-table.element(a,'T-STAT
H0: parameter = 0',header=TRUE)
a<-table.element(a,'2-tail p-value',header=TRUE)
a<-table.element(a,'1-tail p-value',header=TRUE)
a<-table.row.end(a)
for (i in 1:k){
a<-table.row.start(a)
a<-table.element(a,rownames(mysum$coefficients)[i],header=TRUE)
a<-table.element(a,mysum$coefficients[i,1])
a<-table.element(a, round(mysum$coefficients[i,2],6))
a<-table.element(a, round(mysum$coefficients[i,3],4))
a<-table.element(a, round(mysum$coefficients[i,4],6))
a<-table.element(a, round(mysum$coefficients[i,4]/2,6))
a<-table.row.end(a)
}
a<-table.end(a)
table.save(a,file='mytable2.tab')
a<-table.start()
a<-table.row.start(a)
a<-table.element(a, 'Multiple Linear Regression - Regression Statistics', 2, TRUE)
a<-table.row.end(a)
a<-table.row.start(a)
a<-table.element(a, 'Multiple R',1,TRUE)
a<-table.element(a, sqrt(mysum$r.squared))
a<-table.row.end(a)
a<-table.row.start(a)
a<-table.element(a, 'R-squared',1,TRUE)
a<-table.element(a, mysum$r.squared)
a<-table.row.end(a)
a<-table.row.start(a)
a<-table.element(a, 'Adjusted R-squared',1,TRUE)
a<-table.element(a, mysum$adj.r.squared)
a<-table.row.end(a)
a<-table.row.start(a)
a<-table.element(a, 'F-TEST (value)',1,TRUE)
a<-table.element(a, mysum$fstatistic[1])
a<-table.row.end(a)
a<-table.row.start(a)
a<-table.element(a, 'F-TEST (DF numerator)',1,TRUE)
a<-table.element(a, mysum$fstatistic[2])
a<-table.row.end(a)
a<-table.row.start(a)
a<-table.element(a, 'F-TEST (DF denominator)',1,TRUE)
a<-table.element(a, mysum$fstatistic[3])
a<-table.row.end(a)
a<-table.row.start(a)
a<-table.element(a, 'p-value',1,TRUE)
a<-table.element(a, 1-pf(mysum$fstatistic[1],mysum$fstatistic[2],mysum$fstatistic[3]))
a<-table.row.end(a)
a<-table.row.start(a)
a<-table.element(a, 'Multiple Linear Regression - Residual Statistics', 2, TRUE)
a<-table.row.end(a)
a<-table.row.start(a)
a<-table.element(a, 'Residual Standard Deviation',1,TRUE)
a<-table.element(a, mysum$sigma)
a<-table.row.end(a)
a<-table.row.start(a)
a<-table.element(a, 'Sum Squared Residuals',1,TRUE)
a<-table.element(a, sum(myerror*myerror))
a<-table.row.end(a)
a<-table.end(a)
table.save(a,file='mytable3.tab')
a<-table.start()
a<-table.row.start(a)
a<-table.element(a, 'Multiple Linear Regression - Actuals, Interpolation, and Residuals', 4, TRUE)
a<-table.row.end(a)
a<-table.row.start(a)
a<-table.element(a, 'Time or Index', 1, TRUE)
a<-table.element(a, 'Actuals', 1, TRUE)
a<-table.element(a, 'Interpolation
Forecast', 1, TRUE)
a<-table.element(a, 'Residuals
Prediction Error', 1, TRUE)
a<-table.row.end(a)
for (i in 1:n) {
a<-table.row.start(a)
a<-table.element(a,i, 1, TRUE)
a<-table.element(a,x[i])
a<-table.element(a,x[i]-mysum$resid[i])
a<-table.element(a,mysum$resid[i])
a<-table.row.end(a)
}
a<-table.end(a)
table.save(a,file='mytable4.tab')
if (n > n25) {
a<-table.start()
a<-table.row.start(a)
a<-table.element(a,'Goldfeld-Quandt test for Heteroskedasticity',4,TRUE)
a<-table.row.end(a)
a<-table.row.start(a)
a<-table.element(a,'p-values',header=TRUE)
a<-table.element(a,'Alternative Hypothesis',3,header=TRUE)
a<-table.row.end(a)
a<-table.row.start(a)
a<-table.element(a,'breakpoint index',header=TRUE)
a<-table.element(a,'greater',header=TRUE)
a<-table.element(a,'2-sided',header=TRUE)
a<-table.element(a,'less',header=TRUE)
a<-table.row.end(a)
for (mypoint in kp3:nmkm3) {
a<-table.row.start(a)
a<-table.element(a,mypoint,header=TRUE)
a<-table.element(a,gqarr[mypoint-kp3+1,1])
a<-table.element(a,gqarr[mypoint-kp3+1,2])
a<-table.element(a,gqarr[mypoint-kp3+1,3])
a<-table.row.end(a)
}
a<-table.end(a)
table.save(a,file='mytable5.tab')
a<-table.start()
a<-table.row.start(a)
a<-table.element(a,'Meta Analysis of Goldfeld-Quandt test for Heteroskedasticity',4,TRUE)
a<-table.row.end(a)
a<-table.row.start(a)
a<-table.element(a,'Description',header=TRUE)
a<-table.element(a,'# significant tests',header=TRUE)
a<-table.element(a,'% significant tests',header=TRUE)
a<-table.element(a,'OK/NOK',header=TRUE)
a<-table.row.end(a)
a<-table.row.start(a)
a<-table.element(a,'1% type I error level',header=TRUE)
a<-table.element(a,numsignificant1)
a<-table.element(a,numsignificant1/numgqtests)
if (numsignificant1/numgqtests < 0.01) dum <- 'OK' else dum <- 'NOK'
a<-table.element(a,dum)
a<-table.row.end(a)
a<-table.row.start(a)
a<-table.element(a,'5% type I error level',header=TRUE)
a<-table.element(a,numsignificant5)
a<-table.element(a,numsignificant5/numgqtests)
if (numsignificant5/numgqtests < 0.05) dum <- 'OK' else dum <- 'NOK'
a<-table.element(a,dum)
a<-table.row.end(a)
a<-table.row.start(a)
a<-table.element(a,'10% type I error level',header=TRUE)
a<-table.element(a,numsignificant10)
a<-table.element(a,numsignificant10/numgqtests)
if (numsignificant10/numgqtests < 0.1) dum <- 'OK' else dum <- 'NOK'
a<-table.element(a,dum)
a<-table.row.end(a)
a<-table.end(a)
table.save(a,file='mytable6.tab')
}