| Multiple Linear Regression - Estimated Regression Equation |
| Niet_werkende_werkzoekenden[t] = + 68970.6356205958 -418.292868757629X[t] + 0.930452455967116y1[t] + 0.0330128831486056y2[t] + 0.187881114683878y3[t] -0.219786393126637y4[t] + 17114.8877611796M1[t] + 18207.1937484543M2[t] + 12179.1884528439M3[t] + 7221.81459494864M4[t] + 8205.4763419188M5[t] + 3015.34139103115M6[t] + 20206.3648793463M7[t] + 58365.2100442902M8[t] + 23794.5572772682M9[t] + 7833.16211110014M10[t] -10011.4779756030M11[t] -53.8205884163031t + e[t] |
| Multiple Linear Regression - Ordinary Least Squares | |||||
| Variable | Parameter | S.D. | T-STAT H0: parameter = 0 | 2-tail p-value | 1-tail p-value |
| (Intercept) | 68970.6356205958 | 42530.599897 | 1.6217 | 0.112932 | 0.056466 |
| X | -418.292868757629 | 205.895392 | -2.0316 | 0.04905 | 0.024525 |
| y1 | 0.930452455967116 | 0.162167 | 5.7376 | 1e-06 | 1e-06 |
| y2 | 0.0330128831486056 | 0.211066 | 0.1564 | 0.876517 | 0.438258 |
| y3 | 0.187881114683878 | 0.220374 | 0.8526 | 0.399112 | 0.199556 |
| y4 | -0.219786393126637 | 0.143742 | -1.529 | 0.134328 | 0.067164 |
| M1 | 17114.8877611796 | 5565.002289 | 3.0755 | 0.00383 | 0.001915 |
| M2 | 18207.1937484543 | 6728.246588 | 2.7061 | 0.010046 | 0.005023 |
| M3 | 12179.1884528439 | 7006.031481 | 1.7384 | 0.090033 | 0.045017 |
| M4 | 7221.81459494864 | 5854.495009 | 1.2336 | 0.224753 | 0.112377 |
| M5 | 8205.4763419188 | 5106.233484 | 1.607 | 0.116132 | 0.058066 |
| M6 | 3015.34139103115 | 5469.509261 | 0.5513 | 0.584573 | 0.292286 |
| M7 | 20206.3648793463 | 5608.539099 | 3.6028 | 0.00088 | 0.00044 |
| M8 | 58365.2100442902 | 7108.172592 | 8.211 | 0 | 0 |
| M9 | 23794.5572772682 | 12273.106661 | 1.9388 | 0.059792 | 0.029896 |
| M10 | 7833.16211110014 | 12856.167414 | 0.6093 | 0.545864 | 0.272932 |
| M11 | -10011.4779756030 | 8789.739214 | -1.139 | 0.261653 | 0.130826 |
| t | -53.8205884163031 | 112.933153 | -0.4766 | 0.636328 | 0.318164 |
| Multiple Linear Regression - Regression Statistics | |
| Multiple R | 0.990937737242827 |
| R-squared | 0.981957599091935 |
| Adjusted R-squared | 0.974092962798675 |
| F-TEST (value) | 124.857343998675 |
| F-TEST (DF numerator) | 17 |
| F-TEST (DF denominator) | 39 |
| p-value | 0 |
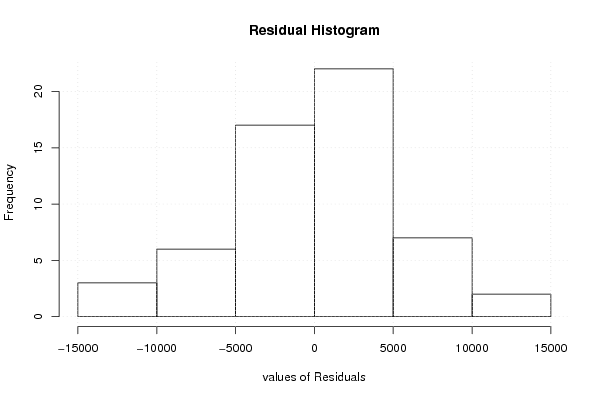
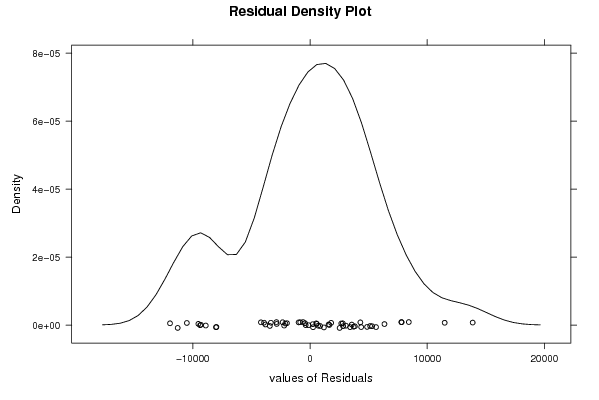
| Multiple Linear Regression - Residual Statistics | |
| Residual Standard Deviation | 6734.34761480654 |
| Sum Squared Residuals | 1768706074.08497 |
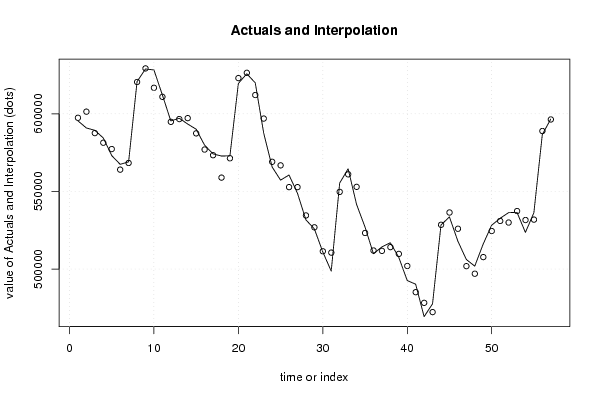
| Multiple Linear Regression - Actuals, Interpolation, and Residuals | |||
| Time or Index | Actuals | Interpolation Forecast | Residuals Prediction Error |
| 1 | 595454 | 597419.875994766 | -1965.87599476635 |
| 2 | 590865 | 601368.718165465 | -10503.7181654651 |
| 3 | 589379 | 587575.581188341 | 1803.41881165846 |
| 4 | 584428 | 581361.939168099 | 3066.06083190139 |
| 5 | 573100 | 577285.758000202 | -4185.75800020164 |
| 6 | 567456 | 564033.575160032 | 3422.42483996780 |
| 7 | 569028 | 568332.710313161 | 695.289686839065 |
| 8 | 620735 | 620477.591272211 | 257.408727789035 |
| 9 | 628884 | 629254.524102224 | -370.524102223715 |
| 10 | 628232 | 616744.260872112 | 11487.7391278883 |
| 11 | 612117 | 610930.969709374 | 1186.0302906255 |
| 12 | 595404 | 594826.360223601 | 577.639776398962 |
| 13 | 597141 | 596610.138730408 | 530.861269592154 |
| 14 | 593408 | 597209.038761307 | -3801.03876130654 |
| 15 | 590072 | 587401.88001582 | 2670.11998418011 |
| 16 | 579799 | 576972.364110527 | 2826.63588947326 |
| 17 | 574205 | 573341.141502384 | 863.858497616324 |
| 18 | 572775 | 558898.4903902 | 13876.5096097998 |
| 19 | 572942 | 571357.600442895 | 1584.39955710515 |
| 20 | 619567 | 622991.812585438 | -3424.81258543762 |
| 21 | 625809 | 626399.790911864 | -590.79091186413 |
| 22 | 619916 | 612095.76772932 | 7820.23227068054 |
| 23 | 587625 | 596932.371915395 | -9307.37191539508 |
| 24 | 565742 | 569081.311792408 | -3339.31179240771 |
| 25 | 557274 | 566795.571056221 | -9521.57105622053 |
| 26 | 560576 | 552787.724801416 | 7788.27519858387 |
| 27 | 548854 | 552777.224828446 | -3923.22482844574 |
| 28 | 531673 | 534539.929866863 | -2866.92986686344 |
| 29 | 525919 | 526890.544414083 | -971.544414082744 |
| 30 | 511038 | 511458.956821315 | -420.956821314821 |
| 31 | 498662 | 510603.977599991 | -11941.9775999914 |
| 32 | 555362 | 549729.373812067 | 5632.62618793326 |
| 33 | 564591 | 561027.752742092 | 3563.24725790764 |
| 34 | 541657 | 552945.107008256 | -11288.1070082559 |
| 35 | 527070 | 523244.161809776 | 3825.83819022427 |
| 36 | 509846 | 511950.723182472 | -2104.72318247165 |
| 37 | 514258 | 511730.139375319 | 2527.86062468074 |
| 38 | 516922 | 514129.392734919 | 2792.60726508106 |
| 39 | 507561 | 509763.489806872 | -2202.48980687243 |
| 40 | 492622 | 501999.687160432 | -9377.6871604319 |
| 41 | 490243 | 485114.0866875 | 5128.91331250016 |
| 42 | 469357 | 478249.14075206 | -8892.14075206053 |
| 43 | 477580 | 472280.648953864 | 5299.35104613632 |
| 44 | 528379 | 528507.72484173 | -128.724841729892 |
| 45 | 533590 | 536430.044701778 | -2840.04470177786 |
| 46 | 517945 | 525964.864390313 | -8019.86439031294 |
| 47 | 506174 | 501878.496565455 | 4295.5034345453 |
| 48 | 501866 | 496999.60480152 | 4866.3951984804 |
| 49 | 516141 | 507712.274843286 | 8428.725156714 |
| 50 | 528222 | 524498.125536893 | 3723.8744631067 |
| 51 | 532638 | 530985.82416052 | 1652.1758394796 |
| 52 | 536322 | 529970.079694079 | 6351.9203059207 |
| 53 | 536535 | 537370.469395832 | -835.469395832101 |
| 54 | 523597 | 531582.836876392 | -7985.83687639227 |
| 55 | 536214 | 531851.062690089 | 4362.93730991082 |
| 56 | 586570 | 588906.497488555 | -2336.49748855479 |
| 57 | 596594 | 596355.887542042 | 238.112457958066 |
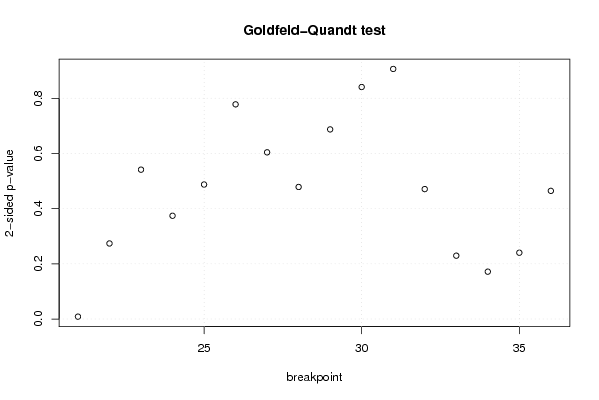
| Goldfeld-Quandt test for Heteroskedasticity | |||
| p-values | Alternative Hypothesis | ||
| breakpoint index | greater | 2-sided | less |
| 21 | 0.00432868412210498 | 0.00865736824420997 | 0.995671315877895 |
| 22 | 0.136928882489933 | 0.273857764979865 | 0.863071117510067 |
| 23 | 0.270614969384768 | 0.541229938769535 | 0.729385030615233 |
| 24 | 0.187114406169665 | 0.374228812339329 | 0.812885593830335 |
| 25 | 0.243700794424293 | 0.487401588848585 | 0.756299205575707 |
| 26 | 0.388966722135473 | 0.777933444270947 | 0.611033277864527 |
| 27 | 0.302034587279304 | 0.604069174558609 | 0.697965412720696 |
| 28 | 0.239272177252540 | 0.478544354505081 | 0.76072782274746 |
| 29 | 0.343585823314465 | 0.68717164662893 | 0.656414176685535 |
| 30 | 0.42032738528274 | 0.84065477056548 | 0.57967261471726 |
| 31 | 0.546924484112696 | 0.906151031774608 | 0.453075515887304 |
| 32 | 0.7645807738151 | 0.4708384523698 | 0.2354192261849 |
| 33 | 0.885226967837038 | 0.229546064325923 | 0.114773032162962 |
| 34 | 0.914183531378126 | 0.171632937243749 | 0.0858164686218744 |
| 35 | 0.879853313770679 | 0.240293372458642 | 0.120146686229321 |
| 36 | 0.767751501330214 | 0.464496997339573 | 0.232248498669786 |
| Meta Analysis of Goldfeld-Quandt test for Heteroskedasticity | |||
| Description | # significant tests | % significant tests | OK/NOK |
| 1% type I error level | 1 | 0.0625 | NOK |
| 5% type I error level | 1 | 0.0625 | NOK |
| 10% type I error level | 1 | 0.0625 | OK |