| Multiple Linear Regression - Estimated Regression Equation |
| WLMan[t] = + 2.15403889369058 + 0.566508210890234WLVrouw[t] + 0.276745894554881M1[t] + 0.270736387208297M2[t] + 0.198028522039758M3[t] + 0.161971477960242M4[t] + 0.0779334485738979M5[t] -0.178717372515126M6[t] -0.287885911840968M7[t] -0.415178046672429M8[t] -0.327885911840968M9[t] -0.278622299049265M10[t] -0.163349178910976M11[t] + e[t] |
| Multiple Linear Regression - Ordinary Least Squares | |||||
| Variable | Parameter | S.D. | T-STAT H0: parameter = 0 | 2-tail p-value | 1-tail p-value |
| (Intercept) | 2.15403889369058 | 0.530992 | 4.0566 | 0.000186 | 9.3e-05 |
| WLVrouw | 0.566508210890234 | 0.057849 | 9.7928 | 0 | 0 |
| M1 | 0.276745894554881 | 0.250575 | 1.1044 | 0.275024 | 0.137512 |
| M2 | 0.270736387208297 | 0.250198 | 1.0821 | 0.284735 | 0.142367 |
| M3 | 0.198028522039758 | 0.249118 | 0.7949 | 0.430657 | 0.215329 |
| M4 | 0.161971477960242 | 0.249118 | 0.6502 | 0.518742 | 0.259371 |
| M5 | 0.0779334485738979 | 0.250083 | 0.3116 | 0.7567 | 0.37835 |
| M6 | -0.178717372515126 | 0.249588 | -0.7161 | 0.477503 | 0.238752 |
| M7 | -0.287885911840968 | 0.252361 | -1.1408 | 0.259746 | 0.129873 |
| M8 | -0.415178046672429 | 0.255275 | -1.6264 | 0.110553 | 0.055276 |
| M9 | -0.327885911840968 | 0.252361 | -1.2993 | 0.200188 | 0.100094 |
| M10 | -0.278622299049265 | 0.249427 | -1.1171 | 0.269651 | 0.134825 |
| M11 | -0.163349178910976 | 0.248968 | -0.6561 | 0.514955 | 0.257478 |
| Multiple Linear Regression - Regression Statistics | |
| Multiple R | 0.851403378079036 |
| R-squared | 0.724887712204394 |
| Adjusted R-squared | 0.654646277022538 |
| F-TEST (value) | 10.3199444932701 |
| F-TEST (DF numerator) | 12 |
| F-TEST (DF denominator) | 47 |
| p-value | 1.57805424283453e-09 |
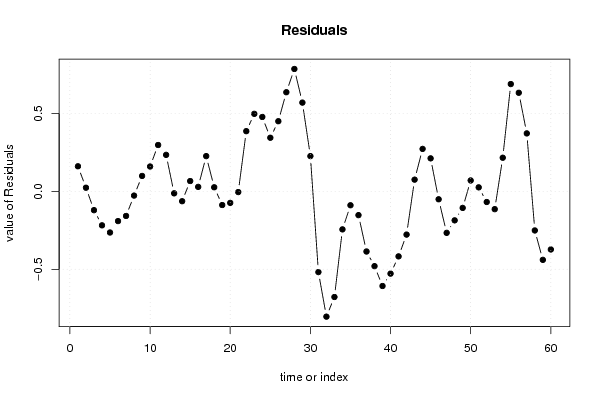
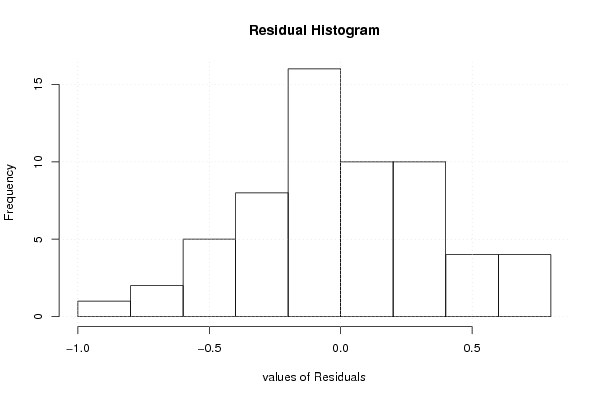
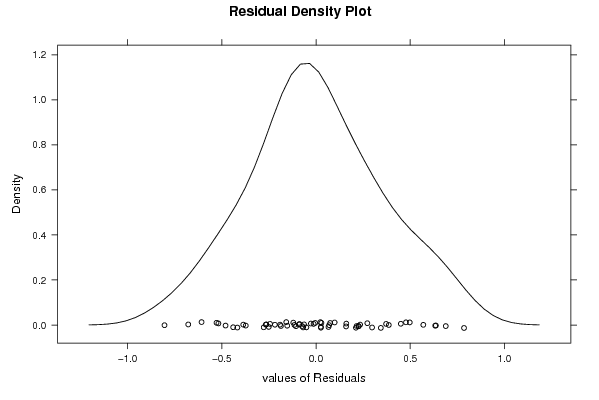
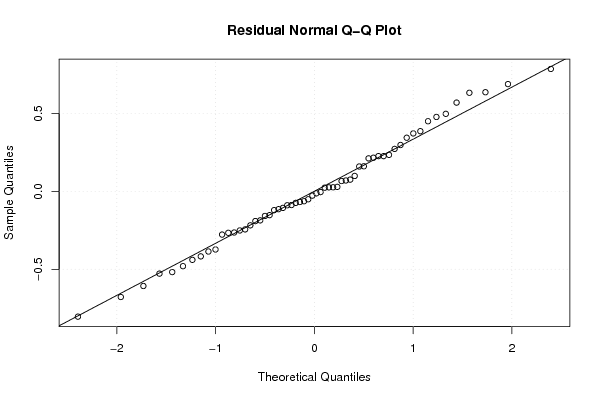
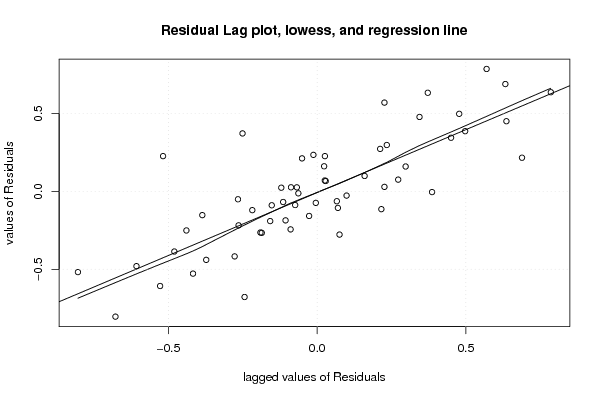
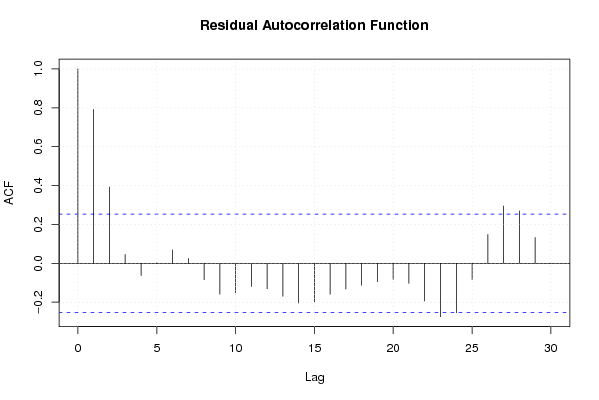
| Multiple Linear Regression - Residual Statistics | |
| Residual Standard Deviation | 0.393546010364785 |
| Sum Squared Residuals | 7.27928772687986 |
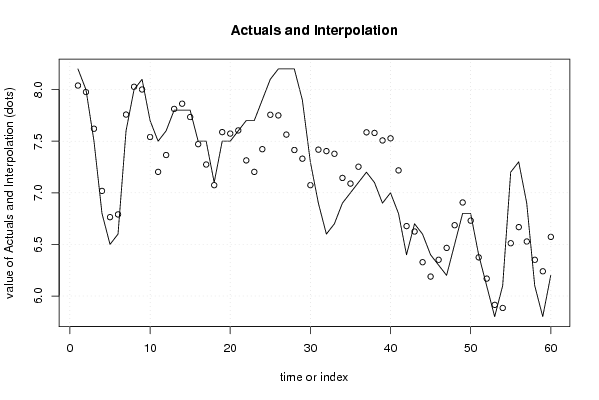
| Multiple Linear Regression - Actuals, Interpolation, and Residuals | |||
| Time or Index | Actuals | Interpolation Forecast | Residuals Prediction Error |
| 1 | 8.2 | 8.03921607605878 | 0.160783923941219 |
| 2 | 8 | 7.97655574762316 | 0.0234442523768374 |
| 3 | 7.5 | 7.6205937770095 | -0.120593777009507 |
| 4 | 6.8 | 7.01802852203976 | -0.218028522039758 |
| 5 | 6.5 | 6.76403802938634 | -0.264038029386344 |
| 6 | 6.6 | 6.79064131374244 | -0.190641313742438 |
| 7 | 7.6 | 7.75783837510804 | -0.157838375108038 |
| 8 | 8 | 8.02710198789974 | -0.0271019878997403 |
| 9 | 8.1 | 8.00109248055315 | 0.0989075194468448 |
| 10 | 7.7 | 7.54049870354365 | 0.159501296456353 |
| 11 | 7.5 | 7.20256525496975 | 0.297434745030251 |
| 12 | 7.6 | 7.36591443388073 | 0.234085566119274 |
| 13 | 7.8 | 7.81261279170268 | -0.0126127917026773 |
| 14 | 7.8 | 7.86325410544512 | -0.0632541054451166 |
| 15 | 7.8 | 7.73389541918755 | 0.0661045808124456 |
| 16 | 7.5 | 7.47123509075194 | 0.0287649092480558 |
| 17 | 7.5 | 7.27389541918755 | 0.226104580812446 |
| 18 | 7.1 | 7.07389541918755 | 0.0261045808124462 |
| 19 | 7.5 | 7.58788591184097 | -0.0878859118409678 |
| 20 | 7.5 | 7.57389541918755 | -0.0738954191875541 |
| 21 | 7.6 | 7.60453673292999 | -0.0045367329299909 |
| 22 | 7.7 | 7.31389541918755 | 0.386104580812446 |
| 23 | 7.7 | 7.20256525496975 | 0.497434745030251 |
| 24 | 7.9 | 7.42256525496975 | 0.477434745030251 |
| 25 | 8.1 | 7.75596197061365 | 0.344038029386346 |
| 26 | 8.2 | 7.74995246326707 | 0.450047536732929 |
| 27 | 8.2 | 7.56394295592048 | 0.636057044079515 |
| 28 | 8.2 | 7.41458426966292 | 0.785415730337078 |
| 29 | 7.9 | 7.33054624027658 | 0.569453759723423 |
| 30 | 7.3 | 7.07389541918755 | 0.226104580812446 |
| 31 | 6.9 | 7.4179334485739 | -0.517933448573898 |
| 32 | 6.6 | 7.40394295592048 | -0.803942955920484 |
| 33 | 6.7 | 7.3779334485739 | -0.677933448573898 |
| 34 | 6.9 | 7.14394295592048 | -0.243942955920484 |
| 35 | 7 | 7.0892636127917 | -0.0892636127917028 |
| 36 | 7.1 | 7.25261279170268 | -0.152612791702680 |
| 37 | 7.2 | 7.58600950734658 | -0.386009507346583 |
| 38 | 7.1 | 7.58 | -0.48 |
| 39 | 6.9 | 7.50729213483146 | -0.60729213483146 |
| 40 | 7 | 7.52788591184097 | -0.527885911840967 |
| 41 | 6.8 | 7.21724459809853 | -0.417244598098531 |
| 42 | 6.4 | 6.67733967156439 | -0.27733967156439 |
| 43 | 6.7 | 6.62482195332757 | 0.0751780466724284 |
| 44 | 6.6 | 6.32757735522904 | 0.272422644770959 |
| 45 | 6.4 | 6.18826620570441 | 0.211733794295592 |
| 46 | 6.3 | 6.35083146067416 | -0.0508314606741578 |
| 47 | 6.2 | 6.46610458081245 | -0.266104580812446 |
| 48 | 6.5 | 6.68610458081245 | -0.186104580812446 |
| 49 | 6.8 | 6.9061996542783 | -0.106199654278304 |
| 50 | 6.8 | 6.73023768366465 | 0.0697623163353499 |
| 51 | 6.4 | 6.374275713051 | 0.0257242869490061 |
| 52 | 6.1 | 6.16826620570441 | -0.0682662057044082 |
| 53 | 5.8 | 5.914275713051 | -0.114275713050994 |
| 54 | 6.1 | 5.88422817631806 | 0.215771823681936 |
| 55 | 7.2 | 6.51152031114952 | 0.688479688850476 |
| 56 | 7.3 | 6.66748228176318 | 0.63251771823682 |
| 57 | 6.9 | 6.52817113223855 | 0.371828867761452 |
| 58 | 6.1 | 6.35083146067416 | -0.250831460674158 |
| 59 | 5.8 | 6.23950129645635 | -0.439501296456353 |
| 60 | 6.2 | 6.5728029386344 | -0.372802938634399 |
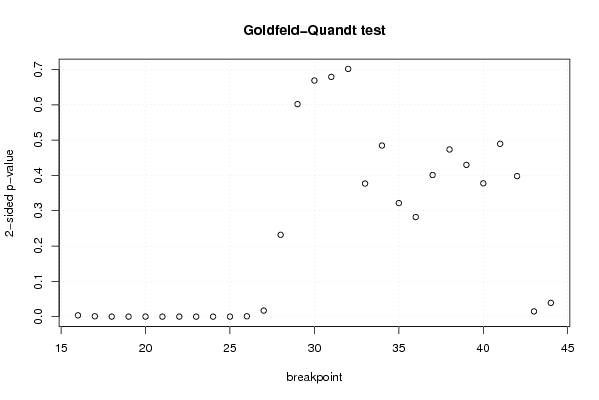
| Goldfeld-Quandt test for Heteroskedasticity | |||
| p-values | Alternative Hypothesis | ||
| breakpoint index | greater | 2-sided | less |
| 16 | 0.00187586020558655 | 0.0037517204111731 | 0.998124139794413 |
| 17 | 0.000563260511974061 | 0.00112652102394812 | 0.999436739488026 |
| 18 | 6.01737096379554e-05 | 0.000120347419275911 | 0.999939826290362 |
| 19 | 7.32543213507227e-05 | 0.000146508642701445 | 0.99992674567865 |
| 20 | 8.93490641080047e-05 | 0.000178698128216009 | 0.999910650935892 |
| 21 | 2.26811025999546e-05 | 4.53622051999093e-05 | 0.9999773188974 |
| 22 | 5.48391946675518e-05 | 0.000109678389335104 | 0.999945160805332 |
| 23 | 3.32855017055639e-05 | 6.65710034111278e-05 | 0.999966714498294 |
| 24 | 2.37411159133906e-05 | 4.74822318267813e-05 | 0.999976258884087 |
| 25 | 5.81339288396695e-05 | 0.000116267857679339 | 0.99994186607116 |
| 26 | 0.000537372741676685 | 0.00107474548335337 | 0.999462627258323 |
| 27 | 0.00858893888799281 | 0.0171778777759856 | 0.991411061112007 |
| 28 | 0.115942089158868 | 0.231884178317736 | 0.884057910841132 |
| 29 | 0.30097340721868 | 0.60194681443736 | 0.69902659278132 |
| 30 | 0.33433626223128 | 0.66867252446256 | 0.66566373776872 |
| 31 | 0.339498897973555 | 0.678997795947111 | 0.660501102026445 |
| 32 | 0.649236495490894 | 0.701527009018212 | 0.350763504509106 |
| 33 | 0.81150565836872 | 0.376988683262558 | 0.188494341631279 |
| 34 | 0.757690476058959 | 0.484619047882082 | 0.242309523941041 |
| 35 | 0.839142937410947 | 0.321714125178106 | 0.160857062589053 |
| 36 | 0.858959802823169 | 0.282080394353663 | 0.141040197176831 |
| 37 | 0.799410958430767 | 0.401178083138467 | 0.200589041569233 |
| 38 | 0.763259102087239 | 0.473481795825522 | 0.236740897912761 |
| 39 | 0.785089536297089 | 0.429820927405823 | 0.214910463702911 |
| 40 | 0.811192129889531 | 0.377615740220937 | 0.188807870110469 |
| 41 | 0.755243315826568 | 0.489513368346865 | 0.244756684173432 |
| 42 | 0.800983703888846 | 0.398032592222307 | 0.199016296111154 |
| 43 | 0.992546772687967 | 0.0149064546240667 | 0.00745322731203336 |
| 44 | 0.98042765327301 | 0.0391446934539782 | 0.0195723467269891 |
| Meta Analysis of Goldfeld-Quandt test for Heteroskedasticity | |||
| Description | # significant tests | % significant tests | OK/NOK |
| 1% type I error level | 11 | 0.379310344827586 | NOK |
| 5% type I error level | 14 | 0.482758620689655 | NOK |
| 10% type I error level | 14 | 0.482758620689655 | NOK |