| Multiple Linear Regression - Estimated Regression Equation |
| IndGez[t] = + 4.025 + 0.545833333333333InvlMex[t] + 0.234999999999995M1[t] + 0.174999999999997M2[t] -0.0141666666666696M3[t] + 0.0658333333333294M4[t] -0.134166666666670M5[t] -0.35416666666667M6[t] -0.514166666666669M7[t] -0.474166666666669M8[t] -0.325000000000003M9[t] -0.375000000000003M10[t] -0.100000000000003M11[t] + e[t] |
| Multiple Linear Regression - Ordinary Least Squares | |||||
| Variable | Parameter | S.D. | T-STAT H0: parameter = 0 | 2-tail p-value | 1-tail p-value |
| (Intercept) | 4.025 | 0.585796 | 6.871 | 0 | 0 |
| InvlMex | 0.545833333333333 | 0.534756 | 1.0207 | 0.313098 | 0.156549 |
| M1 | 0.234999999999995 | 0.785927 | 0.299 | 0.766373 | 0.383186 |
| M2 | 0.174999999999997 | 0.785927 | 0.2227 | 0.824849 | 0.412425 |
| M3 | -0.0141666666666696 | 0.793171 | -0.0179 | 0.985833 | 0.492916 |
| M4 | 0.0658333333333294 | 0.793171 | 0.083 | 0.934237 | 0.467118 |
| M5 | -0.134166666666670 | 0.793171 | -0.1692 | 0.86647 | 0.433235 |
| M6 | -0.35416666666667 | 0.793171 | -0.4465 | 0.657462 | 0.328731 |
| M7 | -0.514166666666669 | 0.793171 | -0.6482 | 0.520275 | 0.260138 |
| M8 | -0.474166666666669 | 0.793171 | -0.5978 | 0.553101 | 0.276551 |
| M9 | -0.325000000000003 | 0.82844 | -0.3923 | 0.696772 | 0.348386 |
| M10 | -0.375000000000003 | 0.82844 | -0.4527 | 0.653071 | 0.326535 |
| M11 | -0.100000000000003 | 0.82844 | -0.1207 | 0.904484 | 0.452242 |
| Multiple Linear Regression - Regression Statistics | |
| Multiple R | 0.264105741157061 |
| R-squared | 0.0697518425121207 |
| Adjusted R-squared | -0.189852294461241 |
| F-TEST (value) | 0.268685404344223 |
| F-TEST (DF numerator) | 12 |
| F-TEST (DF denominator) | 43 |
| p-value | 0.99133768026759 |
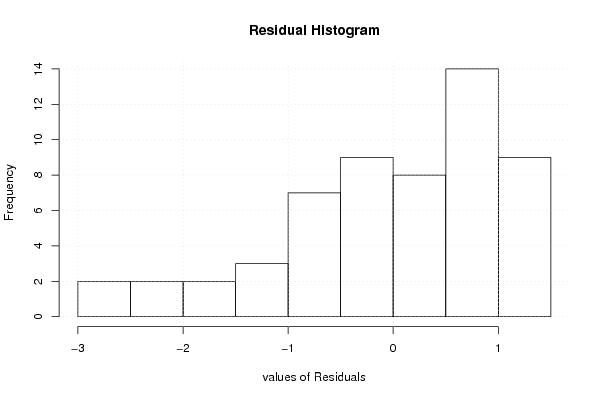
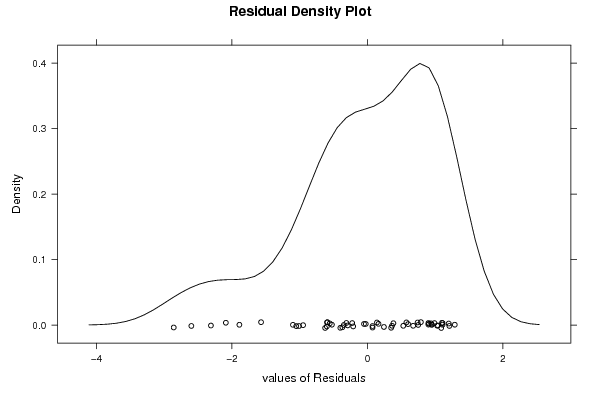
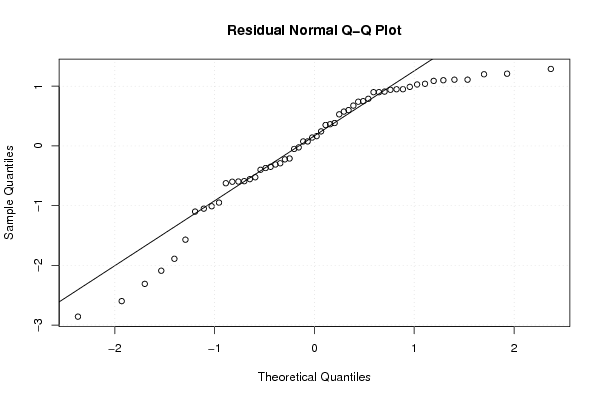
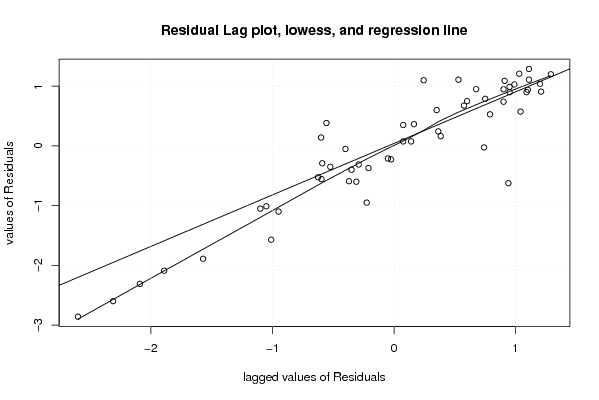
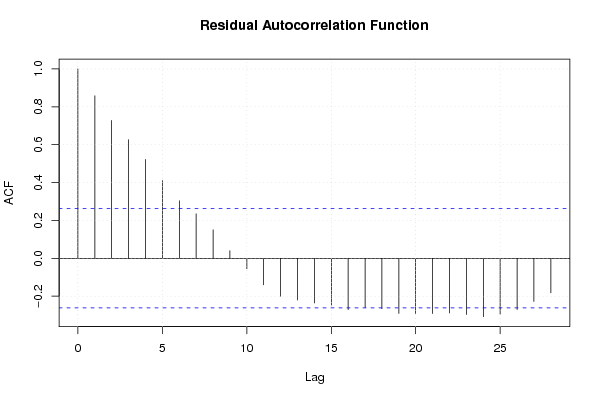
| Multiple Linear Regression - Residual Statistics | |
| Residual Standard Deviation | 1.17159121240826 |
| Sum Squared Residuals | 59.0229166666667 |
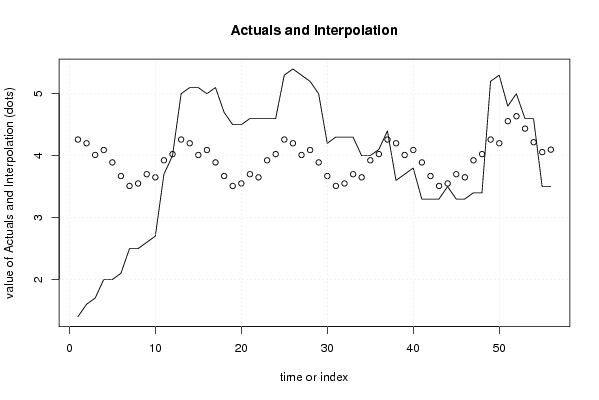
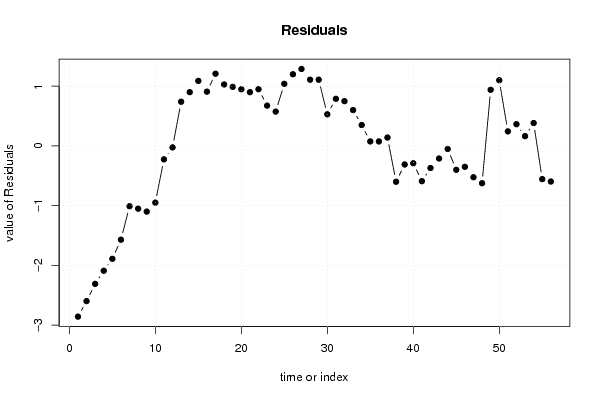
| Multiple Linear Regression - Actuals, Interpolation, and Residuals | |||
| Time or Index | Actuals | Interpolation Forecast | Residuals Prediction Error |
| 1 | 1.4 | 4.26000000000001 | -2.86000000000001 |
| 2 | 1.6 | 4.2 | -2.6 |
| 3 | 1.7 | 4.01083333333333 | -2.31083333333333 |
| 4 | 2 | 4.09083333333333 | -2.09083333333333 |
| 5 | 2 | 3.89083333333333 | -1.89083333333333 |
| 6 | 2.1 | 3.67083333333333 | -1.57083333333333 |
| 7 | 2.5 | 3.51083333333333 | -1.01083333333333 |
| 8 | 2.5 | 3.55083333333333 | -1.05083333333333 |
| 9 | 2.6 | 3.7 | -1.1 |
| 10 | 2.7 | 3.65 | -0.95 |
| 11 | 3.7 | 3.925 | -0.224999999999999 |
| 12 | 4 | 4.02500000000000 | -0.0250000000000037 |
| 13 | 5 | 4.26 | 0.740000000000002 |
| 14 | 5.1 | 4.2 | 0.900000000000001 |
| 15 | 5.1 | 4.01083333333333 | 1.08916666666667 |
| 16 | 5 | 4.09083333333333 | 0.909166666666668 |
| 17 | 5.1 | 3.89083333333333 | 1.20916666666667 |
| 18 | 4.7 | 3.67083333333333 | 1.02916666666667 |
| 19 | 4.5 | 3.51083333333333 | 0.989166666666667 |
| 20 | 4.5 | 3.55083333333333 | 0.949166666666666 |
| 21 | 4.6 | 3.7 | 0.9 |
| 22 | 4.6 | 3.65 | 0.95 |
| 23 | 4.6 | 3.925 | 0.675 |
| 24 | 4.6 | 4.025 | 0.574999999999996 |
| 25 | 5.3 | 4.26 | 1.04000000000000 |
| 26 | 5.4 | 4.2 | 1.20000000000000 |
| 27 | 5.3 | 4.01083333333333 | 1.28916666666667 |
| 28 | 5.2 | 4.09083333333333 | 1.10916666666667 |
| 29 | 5 | 3.89083333333333 | 1.10916666666667 |
| 30 | 4.2 | 3.67083333333333 | 0.529166666666667 |
| 31 | 4.3 | 3.51083333333333 | 0.789166666666666 |
| 32 | 4.3 | 3.55083333333333 | 0.749166666666666 |
| 33 | 4.3 | 3.7 | 0.6 |
| 34 | 4 | 3.65 | 0.350 |
| 35 | 4 | 3.925 | 0.0749999999999997 |
| 36 | 4.1 | 4.025 | 0.0749999999999963 |
| 37 | 4.4 | 4.26 | 0.140000000000003 |
| 38 | 3.6 | 4.2 | -0.599999999999999 |
| 39 | 3.7 | 4.01083333333333 | -0.310833333333333 |
| 40 | 3.8 | 4.09083333333333 | -0.290833333333333 |
| 41 | 3.3 | 3.89083333333333 | -0.590833333333333 |
| 42 | 3.3 | 3.67083333333333 | -0.370833333333333 |
| 43 | 3.3 | 3.51083333333333 | -0.210833333333334 |
| 44 | 3.5 | 3.55083333333333 | -0.050833333333333 |
| 45 | 3.3 | 3.7 | -0.4 |
| 46 | 3.3 | 3.65 | -0.35 |
| 47 | 3.4 | 3.925 | -0.525 |
| 48 | 3.4 | 4.025 | -0.625000000000003 |
| 49 | 5.2 | 4.26 | 0.940000000000003 |
| 50 | 5.3 | 4.2 | 1.10000000000000 |
| 51 | 4.8 | 4.55666666666667 | 0.243333333333333 |
| 52 | 5 | 4.63666666666667 | 0.363333333333334 |
| 53 | 4.6 | 4.43666666666667 | 0.163333333333333 |
| 54 | 4.6 | 4.21666666666667 | 0.383333333333333 |
| 55 | 3.5 | 4.05666666666667 | -0.556666666666666 |
| 56 | 3.5 | 4.09666666666667 | -0.596666666666666 |
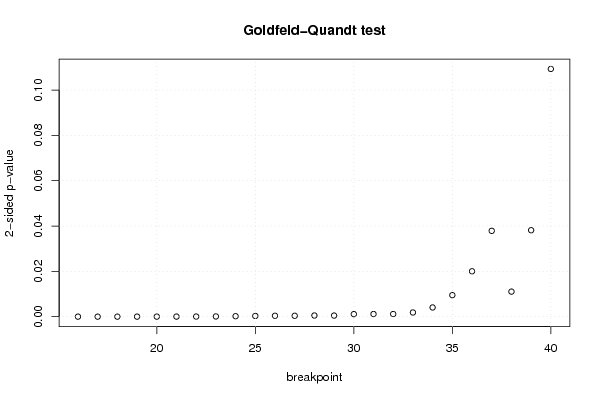
| Goldfeld-Quandt test for Heteroskedasticity | |||
| p-values | Alternative Hypothesis | ||
| breakpoint index | greater | 2-sided | less |
| 16 | 0.999995072526627 | 9.8549467468071e-06 | 4.92747337340355e-06 |
| 17 | 0.999996723901776 | 6.55219644846661e-06 | 3.27609822423331e-06 |
| 18 | 0.99999596957289 | 8.0608542196696e-06 | 4.0304271098348e-06 |
| 19 | 0.999993610987688 | 1.27780246243001e-05 | 6.38901231215003e-06 |
| 20 | 0.999989753851412 | 2.04922971755997e-05 | 1.02461485877998e-05 |
| 21 | 0.999983216767918 | 3.35664641643961e-05 | 1.67832320821981e-05 |
| 22 | 0.999975114082627 | 4.97718347454680e-05 | 2.48859173727340e-05 |
| 23 | 0.999950886407595 | 9.8227184809636e-05 | 4.9113592404818e-05 |
| 24 | 0.999899375793317 | 0.000201248413365049 | 0.000100624206682525 |
| 25 | 0.999840827518325 | 0.000318344963349031 | 0.000159172481674516 |
| 26 | 0.999806150249446 | 0.000387699501107513 | 0.000193849750553756 |
| 27 | 0.999805824558714 | 0.000388350882572959 | 0.000194175441286480 |
| 28 | 0.999741102848046 | 0.000517794303908039 | 0.000258897151954019 |
| 29 | 0.999759820079014 | 0.000480359841972518 | 0.000240179920986259 |
| 30 | 0.999441338943706 | 0.00111732211258706 | 0.000558661056293529 |
| 31 | 0.99941706907964 | 0.00116586184071736 | 0.000582930920358679 |
| 32 | 0.999421869514958 | 0.00115626097008484 | 0.000578130485042419 |
| 33 | 0.999078645353996 | 0.00184270929200814 | 0.00092135464600407 |
| 34 | 0.997970729509036 | 0.00405854098192767 | 0.00202927049096384 |
| 35 | 0.995253002618432 | 0.00949399476313532 | 0.00474699738156766 |
| 36 | 0.989984599948056 | 0.020030800103888 | 0.010015400051944 |
| 37 | 0.98105795107948 | 0.0378840978410415 | 0.0189420489205208 |
| 38 | 0.994471660095292 | 0.0110566798094169 | 0.00552833990470844 |
| 39 | 0.980923252243788 | 0.0381534955124238 | 0.0190767477562119 |
| 40 | 0.945326351371421 | 0.109347297257157 | 0.0546736486285786 |
| Meta Analysis of Goldfeld-Quandt test for Heteroskedasticity | |||
| Description | # significant tests | % significant tests | OK/NOK |
| 1% type I error level | 20 | 0.8 | NOK |
| 5% type I error level | 24 | 0.96 | NOK |
| 10% type I error level | 24 | 0.96 | NOK |