| Multiple Linear Regression - Estimated Regression Equation |
| Totind[t] = -24.0516684867312 + 0.670388000769807Bouw[t] + 0.253998840317328`Yt-1`[t] + 0.269978457642583`Yt-2`[t] + 0.160638800436104`Yt-3`[t] -6.37661479692486M1[t] -1.88110503246155M2[t] -1.19156849898619M3[t] -2.50634377705874M4[t] + 1.38913552902864M5[t] -6.26009234136988M6[t] -6.86826776767659M7[t] -4.52699001781147M8[t] + 6.45481886381635M9[t] -7.94932174721686M10[t] + 0.517101623635753M11[t] -0.0448299433002486t + e[t] |
| Multiple Linear Regression - Ordinary Least Squares | |||||
| Variable | Parameter | S.D. | T-STAT H0: parameter = 0 | 2-tail p-value | 1-tail p-value |
| (Intercept) | -24.0516684867312 | 6.175792 | -3.8945 | 0.000365 | 0.000182 |
| Bouw | 0.670388000769807 | 0.048239 | 13.8973 | 0 | 0 |
| `Yt-1` | 0.253998840317328 | 0.056669 | 4.4821 | 6.1e-05 | 3e-05 |
| `Yt-2` | 0.269978457642583 | 0.051346 | 5.2581 | 5e-06 | 3e-06 |
| `Yt-3` | 0.160638800436104 | 0.066553 | 2.4137 | 0.020462 | 0.010231 |
| M1 | -6.37661479692486 | 1.715957 | -3.7161 | 0.000619 | 0.000309 |
| M2 | -1.88110503246155 | 3.210205 | -0.586 | 0.561183 | 0.280592 |
| M3 | -1.19156849898619 | 3.243081 | -0.3674 | 0.715244 | 0.357622 |
| M4 | -2.50634377705874 | 2.561296 | -0.9785 | 0.333686 | 0.166843 |
| M5 | 1.38913552902864 | 1.891241 | 0.7345 | 0.466922 | 0.233461 |
| M6 | -6.26009234136988 | 1.661245 | -3.7683 | 0.000531 | 0.000265 |
| M7 | -6.86826776767659 | 2.043213 | -3.3615 | 0.001716 | 0.000858 |
| M8 | -4.52699001781147 | 2.173725 | -2.0826 | 0.043727 | 0.021863 |
| M9 | 6.45481886381635 | 3.533982 | 1.8265 | 0.075245 | 0.037622 |
| M10 | -7.94932174721686 | 3.093976 | -2.5693 | 0.014025 | 0.007012 |
| M11 | 0.517101623635753 | 2.663718 | 0.1941 | 0.847058 | 0.423529 |
| t | -0.0448299433002486 | 0.014545 | -3.0821 | 0.003713 | 0.001856 |
| Multiple Linear Regression - Regression Statistics | |
| Multiple R | 0.987973486143355 |
| R-squared | 0.976091609322253 |
| Adjusted R-squared | 0.966528253051154 |
| F-TEST (value) | 102.065800086533 |
| F-TEST (DF numerator) | 16 |
| F-TEST (DF denominator) | 40 |
| p-value | 0 |
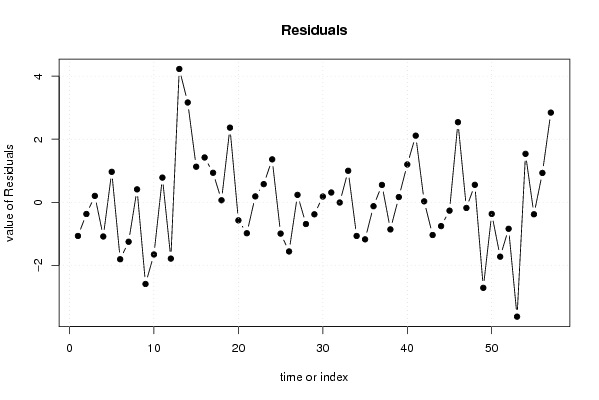
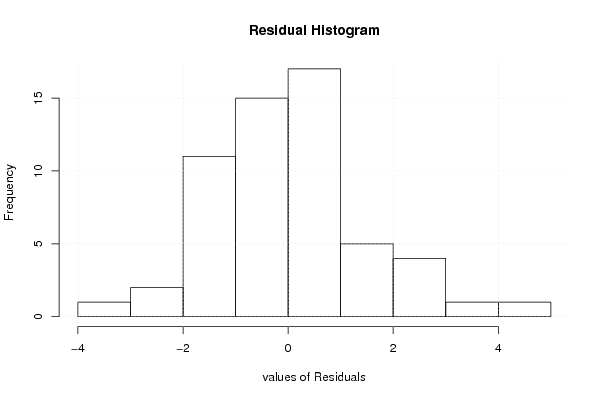
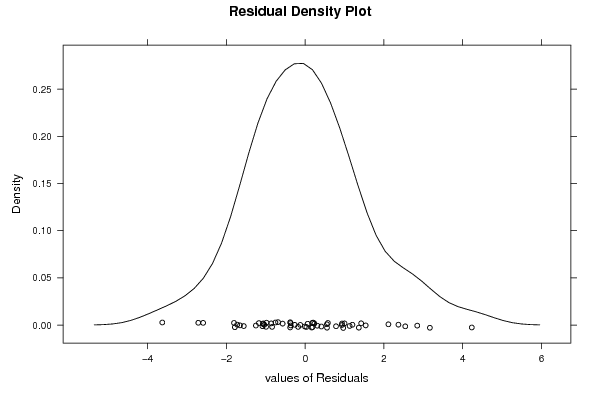
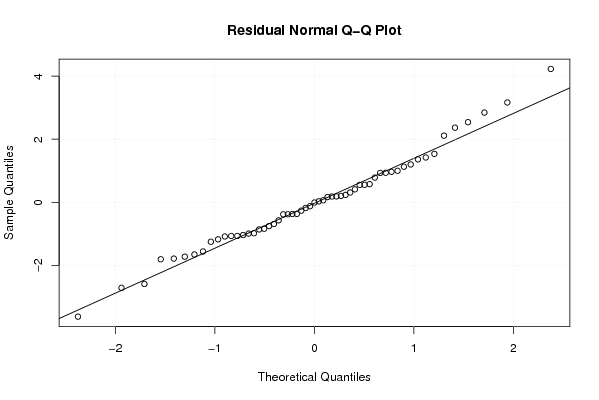
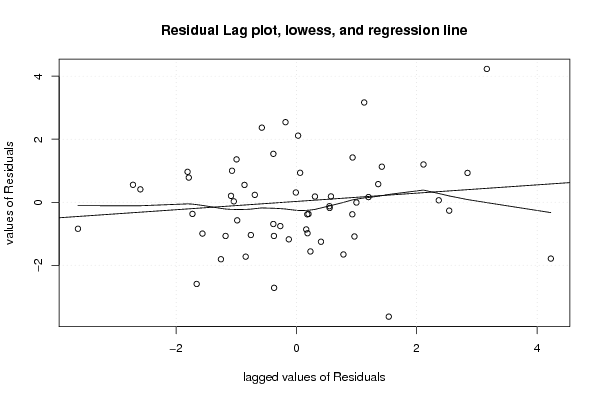
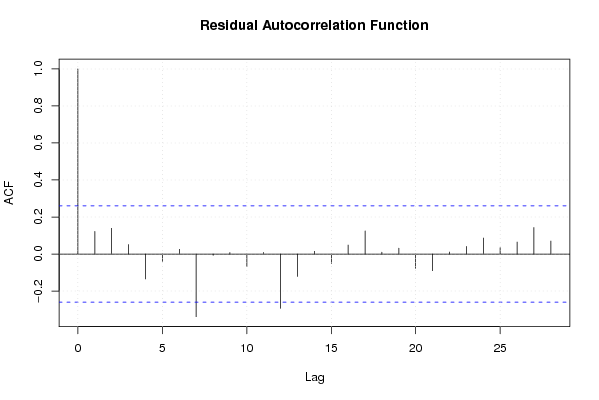
| Multiple Linear Regression - Residual Statistics | |
| Residual Standard Deviation | 1.74653764901953 |
| Sum Squared Residuals | 122.015750377706 |
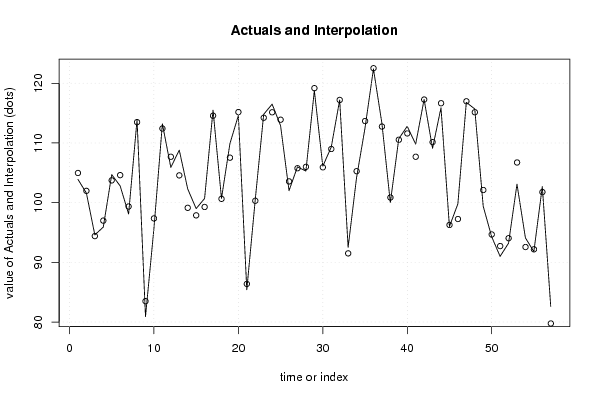
| Multiple Linear Regression - Actuals, Interpolation, and Residuals | |||
| Time or Index | Actuals | Interpolation Forecast | Residuals Prediction Error |
| 1 | 103.9 | 104.969683629408 | -1.06968362940815 |
| 2 | 101.6 | 101.972519572344 | -0.372519572344110 |
| 3 | 94.6 | 94.3986740531382 | 0.201325946861819 |
| 4 | 95.9 | 96.986306182643 | -1.08630618264294 |
| 5 | 104.7 | 103.734629198884 | 0.965370801115925 |
| 6 | 102.8 | 104.608374380020 | -1.80837438002040 |
| 7 | 98.1 | 99.353532073934 | -1.25353207393411 |
| 8 | 113.9 | 113.490870519258 | 0.40912948074217 |
| 9 | 80.9 | 83.492815013044 | -2.59281501304397 |
| 10 | 95.7 | 97.3567460350472 | -1.65674603504723 |
| 11 | 113.2 | 112.417680654605 | 0.78231934539542 |
| 12 | 105.9 | 107.688100343550 | -1.78810034354973 |
| 13 | 108.8 | 104.570416121975 | 4.22958387802476 |
| 14 | 102.3 | 99.1343940337358 | 3.16560596626418 |
| 15 | 99 | 97.8724600459822 | 1.12753995401782 |
| 16 | 100.7 | 99.2794836037697 | 1.4205163962303 |
| 17 | 115.5 | 114.565338296898 | 0.934661703101635 |
| 18 | 100.7 | 100.637576245056 | 0.062423754943834 |
| 19 | 109.9 | 107.533229180687 | 2.36677081931268 |
| 20 | 114.6 | 115.173916596827 | -0.573916596827391 |
| 21 | 85.4 | 86.3832920013917 | -0.983292001391662 |
| 22 | 100.5 | 100.314459462676 | 0.185540537324012 |
| 23 | 114.8 | 114.225149587991 | 0.574850412009274 |
| 24 | 116.5 | 115.139530773491 | 1.36046922650927 |
| 25 | 112.9 | 113.894329490909 | -0.994329490908626 |
| 26 | 102 | 103.561089292067 | -1.56108929206679 |
| 27 | 106 | 105.766282041785 | 0.233717958215348 |
| 28 | 105.3 | 105.990974116503 | -0.690974116502855 |
| 29 | 118.8 | 119.182672808586 | -0.38267280858572 |
| 30 | 106.1 | 105.918698809711 | 0.181301190288773 |
| 31 | 109.3 | 108.991148989870 | 0.308851010130198 |
| 32 | 117.2 | 117.20897648659 | -0.00897648658987273 |
| 33 | 92.5 | 91.50167531931 | 0.99832468069009 |
| 34 | 104.2 | 105.269237422476 | -1.06923742247619 |
| 35 | 112.5 | 113.676592704186 | -1.17659270418602 |
| 36 | 122.4 | 122.525515904845 | -0.125515904844945 |
| 37 | 113.3 | 112.750173635827 | 0.549826364172864 |
| 38 | 100 | 100.862115563676 | -0.862115563675945 |
| 39 | 110.7 | 110.535840152643 | 0.164159847357327 |
| 40 | 112.8 | 111.601250757516 | 1.19874924248398 |
| 41 | 109.8 | 107.687333125553 | 2.11266687444738 |
| 42 | 117.3 | 117.271186734708 | 0.0288132652919417 |
| 43 | 109.1 | 110.140000366385 | -1.04000036638540 |
| 44 | 115.9 | 116.656334518825 | -0.756334518824865 |
| 45 | 96 | 96.2669267851151 | -0.26692678511512 |
| 46 | 99.8 | 97.2595570798006 | 2.54044292019941 |
| 47 | 116.8 | 116.980577053219 | -0.180577053218678 |
| 48 | 115.7 | 115.146852978115 | 0.553147021885413 |
| 49 | 99.4 | 102.115397121881 | -2.71539712188085 |
| 50 | 94.3 | 94.6698815381773 | -0.369881538177339 |
| 51 | 91 | 92.7267437064523 | -1.72674370645231 |
| 52 | 93.2 | 94.0419853395685 | -0.841985339568484 |
| 53 | 103.1 | 106.730026570079 | -3.63002657007922 |
| 54 | 94.1 | 92.5641638305041 | 1.53583616949585 |
| 55 | 91.8 | 92.1820893891234 | -0.382089389123366 |
| 56 | 102.7 | 101.7699018785 | 0.930098121499961 |
| 57 | 82.6 | 79.7552908811393 | 2.84470911886066 |
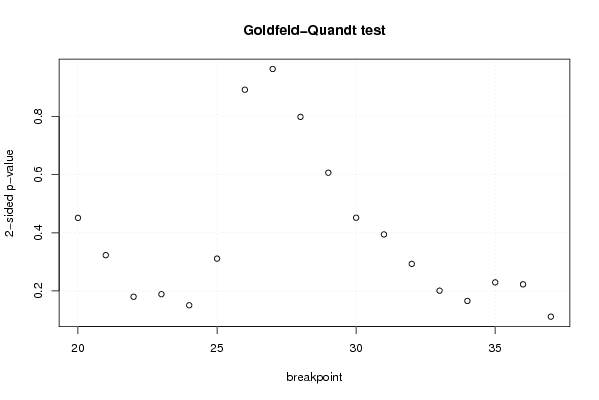
| Goldfeld-Quandt test for Heteroskedasticity | |||
| p-values | Alternative Hypothesis | ||
| breakpoint index | greater | 2-sided | less |
| 20 | 0.225732003534464 | 0.451464007068928 | 0.774267996465536 |
| 21 | 0.16156478242614 | 0.32312956485228 | 0.83843521757386 |
| 22 | 0.0900387423119481 | 0.180077484623896 | 0.909961257688052 |
| 23 | 0.0944393695090182 | 0.188878739018036 | 0.905560630490982 |
| 24 | 0.075368432000861 | 0.150736864001722 | 0.924631567999139 |
| 25 | 0.155656093567007 | 0.311312187134015 | 0.844343906432993 |
| 26 | 0.446153673789121 | 0.892307347578243 | 0.553846326210879 |
| 27 | 0.518101584485397 | 0.963796831029206 | 0.481898415514603 |
| 28 | 0.399447180629779 | 0.798894361259558 | 0.600552819370221 |
| 29 | 0.303414385124131 | 0.606828770248263 | 0.696585614875868 |
| 30 | 0.225974704429022 | 0.451949408858043 | 0.774025295570978 |
| 31 | 0.197237740853324 | 0.394475481706648 | 0.802762259146676 |
| 32 | 0.146591868117160 | 0.293183736234320 | 0.85340813188284 |
| 33 | 0.100506742259601 | 0.201013484519202 | 0.8994932577404 |
| 34 | 0.0828119743171122 | 0.165623948634224 | 0.917188025682888 |
| 35 | 0.114784655396428 | 0.229569310792856 | 0.885215344603572 |
| 36 | 0.111391143474654 | 0.222782286949308 | 0.888608856525346 |
| 37 | 0.0558066614142812 | 0.111613322828562 | 0.94419333858572 |
| Meta Analysis of Goldfeld-Quandt test for Heteroskedasticity | |||
| Description | # significant tests | % significant tests | OK/NOK |
| 1% type I error level | 0 | 0 | OK |
| 5% type I error level | 0 | 0 | OK |
| 10% type I error level | 0 | 0 | OK |