| Multiple Linear Regression - Estimated Regression Equation |
| IndGez[t] = + 0.680001490026424 -0.109916882560442InvlMex[t] + 0.829083916174935`Yt-1`[t] + 0.0406279848806237`Yt-2`[t] + 0.102037061011512`Yt-3`[t] -0.109824058538842`Yt-4`[t] -0.199444656948999M1[t] -0.252551856372627M2[t] -0.2362239526388M3[t] -0.0226862977284185M4[t] -0.0745510928749468M5[t] -0.161684153029778M6[t] + 0.160657728882051M7[t] + 0.0429349888681616M8[t] + 0.906708489222317M9[t] -0.040782689573798M10[t] -0.0505139202881374M11[t] -0.00275273476324471t + e[t] |
| Multiple Linear Regression - Ordinary Least Squares | |||||
| Variable | Parameter | S.D. | T-STAT H0: parameter = 0 | 2-tail p-value | 1-tail p-value |
| (Intercept) | 0.680001490026424 | 0.419206 | 1.6221 | 0.114016 | 0.057008 |
| InvlMex | -0.109916882560442 | 0.225445 | -0.4876 | 0.628994 | 0.314497 |
| `Yt-1` | 0.829083916174935 | 0.169489 | 4.8917 | 2.4e-05 | 1.2e-05 |
| `Yt-2` | 0.0406279848806237 | 0.247835 | 0.1639 | 0.870756 | 0.435378 |
| `Yt-3` | 0.102037061011512 | 0.258943 | 0.3941 | 0.696003 | 0.348001 |
| `Yt-4` | -0.109824058538842 | 0.189244 | -0.5803 | 0.565519 | 0.28276 |
| M1 | -0.199444656948999 | 0.307899 | -0.6478 | 0.521491 | 0.260745 |
| M2 | -0.252551856372627 | 0.310744 | -0.8127 | 0.422026 | 0.211013 |
| M3 | -0.2362239526388 | 0.295468 | -0.7995 | 0.429557 | 0.214778 |
| M4 | -0.0226862977284185 | 0.330934 | -0.0686 | 0.945747 | 0.472874 |
| M5 | -0.0745510928749468 | 0.344289 | -0.2165 | 0.829864 | 0.414932 |
| M6 | -0.161684153029778 | 0.302225 | -0.535 | 0.596146 | 0.298073 |
| M7 | 0.160657728882051 | 0.303948 | 0.5286 | 0.600537 | 0.300269 |
| M8 | 0.0429349888681616 | 0.309732 | 0.1386 | 0.890568 | 0.445284 |
| M9 | 0.906708489222317 | 0.318013 | 2.8512 | 0.007354 | 0.003677 |
| M10 | -0.040782689573798 | 0.32261 | -0.1264 | 0.900148 | 0.450074 |
| M11 | -0.0505139202881374 | 0.349013 | -0.1447 | 0.885776 | 0.442888 |
| t | -0.00275273476324471 | 0.004832 | -0.5697 | 0.572634 | 0.286317 |
| Multiple Linear Regression - Regression Statistics | |
| Multiple R | 0.950462850624025 |
| R-squared | 0.903379630416347 |
| Adjusted R-squared | 0.85506944562452 |
| F-TEST (value) | 18.6995689275274 |
| F-TEST (DF numerator) | 17 |
| F-TEST (DF denominator) | 34 |
| p-value | 1.68287606072681e-12 |
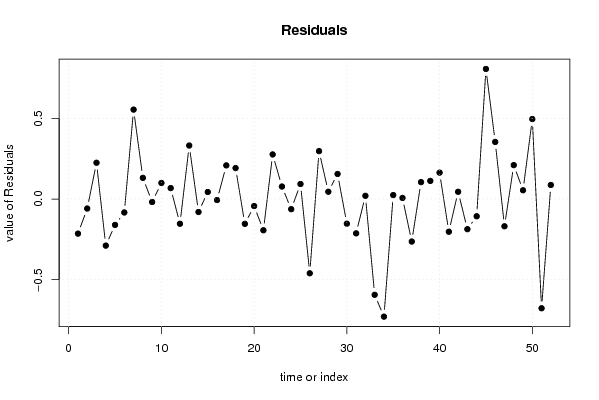
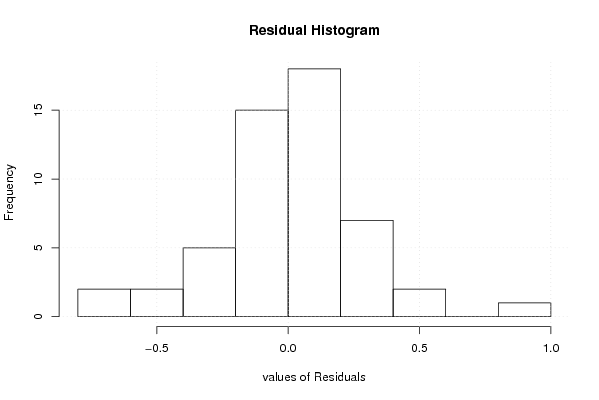
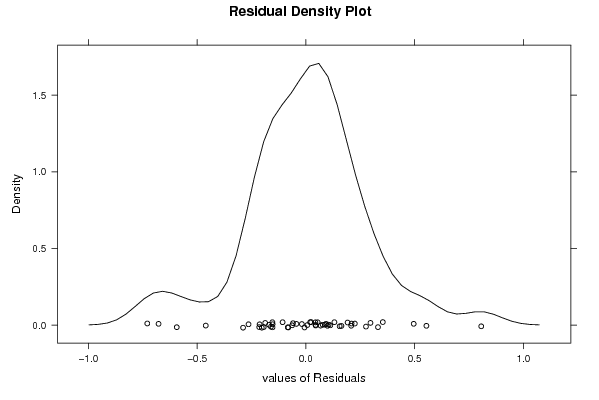
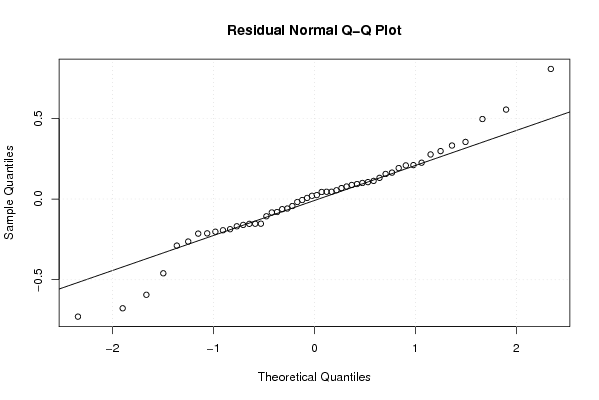
| Multiple Linear Regression - Residual Statistics | |
| Residual Standard Deviation | 0.342358847011439 |
| Sum Squared Residuals | 3.98512572431807 |
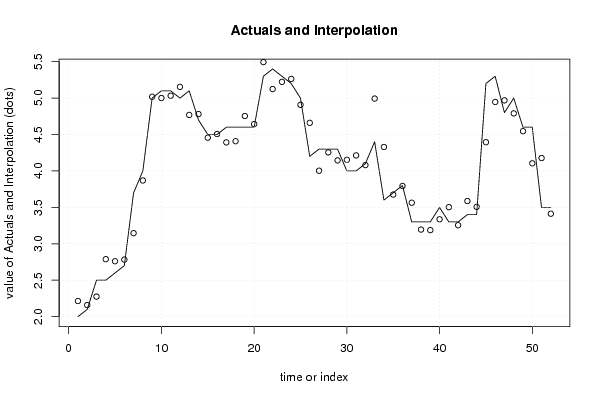
| Multiple Linear Regression - Actuals, Interpolation, and Residuals | |||
| Time or Index | Actuals | Interpolation Forecast | Residuals Prediction Error |
| 1 | 2 | 2.21454512062515 | -0.214545120625151 |
| 2 | 2.1 | 2.15911247629585 | -0.0591124762958488 |
| 3 | 2.5 | 2.27522474933349 | 0.224775250666508 |
| 4 | 2.5 | 2.78875881687701 | -0.288758816877015 |
| 5 | 2.6 | 2.76059618702064 | -0.160596187020643 |
| 6 | 2.7 | 2.78345120227078 | -0.0834512022707805 |
| 7 | 3.7 | 3.14608191610938 | 0.553918083890616 |
| 8 | 4 | 3.8689568620964 | 0.131043137903601 |
| 9 | 5 | 5.01855208766768 | -0.0185520876676811 |
| 10 | 5.1 | 5.00063514090507 | 0.0993648590949268 |
| 11 | 5.1 | 5.03247461169022 | 0.0675253883097832 |
| 12 | 5 | 5.15338843915303 | -0.153388439153031 |
| 13 | 5.1 | 4.7686623033856 | 0.331337696614397 |
| 14 | 4.7 | 4.78066555647428 | -0.0806655564742768 |
| 15 | 4.5 | 4.4564662513618 | 0.043533748638203 |
| 16 | 4.5 | 4.50636930627673 | -0.00636930627673205 |
| 17 | 4.6 | 4.39182894913235 | 0.208171050867654 |
| 18 | 4.6 | 4.408373757045 | 0.191626242955003 |
| 19 | 4.6 | 4.75399051438941 | -0.153990514389412 |
| 20 | 4.6 | 4.64371874571343 | -0.0437187457134295 |
| 21 | 5.3 | 5.49375710545046 | -0.193757105450456 |
| 22 | 5.4 | 5.12387193321355 | 0.276128066786449 |
| 23 | 5.3 | 5.2227359487699 | 0.0772640512301022 |
| 24 | 5.2 | 5.26307748387342 | -0.0630774838734171 |
| 25 | 5 | 4.90723576717958 | 0.0927642328204208 |
| 26 | 4.2 | 4.66031013931462 | -0.460310139314622 |
| 27 | 4.3 | 4.00327127812186 | 0.296728721878136 |
| 28 | 4.3 | 4.25503719563358 | 0.0449628043664231 |
| 29 | 4.3 | 4.14481762711042 | 0.155182372889575 |
| 30 | 4 | 4.15299478512457 | -0.152994785124574 |
| 31 | 4 | 4.21287635156679 | -0.212876351566793 |
| 32 | 4.1 | 4.08021248132547 | 0.0197875186745276 |
| 33 | 4.4 | 4.99353052023042 | -0.593530520230422 |
| 34 | 3.6 | 4.32902179757326 | -0.729021797573259 |
| 35 | 3.7 | 3.67566280072106 | 0.0243371992789359 |
| 36 | 3.8 | 3.79345870240852 | 0.00654129759147848 |
| 37 | 3.3 | 3.56365563443097 | -0.26365563443097 |
| 38 | 3.3 | 3.19537949357692 | 0.104620506423082 |
| 39 | 3.3 | 3.18786197035446 | 0.112138029645545 |
| 40 | 3.5 | 3.33664595414195 | 0.163354045858049 |
| 41 | 3.3 | 3.50275723673659 | -0.202757236736587 |
| 42 | 3.3 | 3.25518025555965 | 0.0448197444403515 |
| 43 | 3.4 | 3.58705121793441 | -0.187051217934410 |
| 44 | 3.4 | 3.5071119108647 | -0.107111910864699 |
| 45 | 5.2 | 4.39416028665144 | 0.80583971334856 |
| 46 | 5.3 | 4.94647112830812 | 0.353528871691883 |
| 47 | 4.8 | 4.96912663881882 | -0.169126638818821 |
| 48 | 5 | 4.79007537456503 | 0.209924625434969 |
| 49 | 4.6 | 4.5459011743787 | 0.0540988256213028 |
| 50 | 4.6 | 4.10453233433833 | 0.495467665661665 |
| 51 | 3.5 | 4.17717575082839 | -0.677175750828391 |
| 52 | 3.5 | 3.41318872707073 | 0.0868112729292748 |
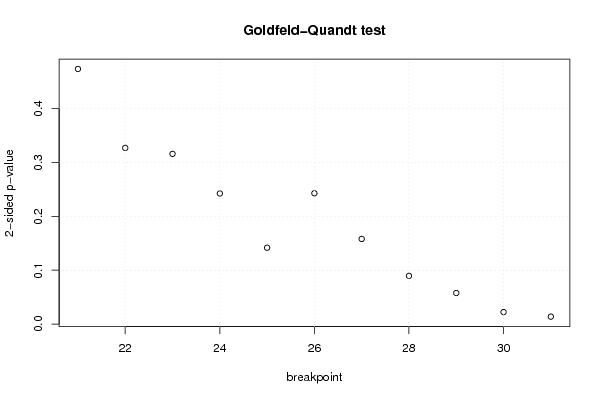
| Goldfeld-Quandt test for Heteroskedasticity | |||
| p-values | Alternative Hypothesis | ||
| breakpoint index | greater | 2-sided | less |
| 21 | 0.236818770499909 | 0.473637540999817 | 0.763181229500091 |
| 22 | 0.163536221849435 | 0.327072443698869 | 0.836463778150565 |
| 23 | 0.157996964564609 | 0.315993929129218 | 0.842003035435391 |
| 24 | 0.121213100806550 | 0.242426201613101 | 0.87878689919345 |
| 25 | 0.0708861248699219 | 0.141772249739844 | 0.929113875130078 |
| 26 | 0.121426373278215 | 0.242852746556430 | 0.878573626721785 |
| 27 | 0.0790698322225995 | 0.158139664445199 | 0.9209301677774 |
| 28 | 0.0447772214172969 | 0.0895544428345939 | 0.955222778582703 |
| 29 | 0.0288425855002310 | 0.0576851710004621 | 0.97115741449977 |
| 30 | 0.0111513803558030 | 0.0223027607116060 | 0.988848619644197 |
| 31 | 0.00691101143046316 | 0.0138220228609263 | 0.993088988569537 |
| Meta Analysis of Goldfeld-Quandt test for Heteroskedasticity | |||
| Description | # significant tests | % significant tests | OK/NOK |
| 1% type I error level | 0 | 0 | OK |
| 5% type I error level | 2 | 0.181818181818182 | NOK |
| 10% type I error level | 4 | 0.363636363636364 | NOK |