| Multiple Linear Regression - Estimated Regression Equation |
| britse_pond[t] = + 0.145412170967563 -0.0985427050412497Zwitserse_frank[t] + 1.00268878936414`Britse_pond_-1`[t] -0.00341265297691773M1[t] + 0.00148026239263723M2[t] -0.00395853837575197M3[t] + 0.006952974351011M4[t] -0.00493876877735603M5[t] + 0.00214802675416841M6[t] + 0.00271409312945089M7[t] -0.00235740195402955M8[t] + 0.0018233559982335M9[t] -0.00140612307178253M10[t] + 0.00100553451485034M11[t] + 0.000104797369572300t + e[t] |
| Multiple Linear Regression - Ordinary Least Squares | |||||
| Variable | Parameter | S.D. | T-STAT H0: parameter = 0 | 2-tail p-value | 1-tail p-value |
| (Intercept) | 0.145412170967563 | 0.05834 | 2.4925 | 0.016524 | 0.008262 |
| Zwitserse_frank | -0.0985427050412497 | 0.045061 | -2.1869 | 0.034112 | 0.017056 |
| `Britse_pond_-1` | 1.00268878936414 | 0.065673 | 15.2679 | 0 | 0 |
| M1 | -0.00341265297691773 | 0.0057 | -0.5987 | 0.552463 | 0.276232 |
| M2 | 0.00148026239263723 | 0.005693 | 0.26 | 0.796077 | 0.398039 |
| M3 | -0.00395853837575197 | 0.005687 | -0.6961 | 0.490028 | 0.245014 |
| M4 | 0.006952974351011 | 0.005707 | 1.2183 | 0.2296 | 0.1148 |
| M5 | -0.00493876877735603 | 0.005671 | -0.8709 | 0.388561 | 0.194281 |
| M6 | 0.00214802675416841 | 0.005709 | 0.3763 | 0.708524 | 0.354262 |
| M7 | 0.00271409312945089 | 0.005696 | 0.4765 | 0.636095 | 0.318048 |
| M8 | -0.00235740195402955 | 0.005674 | -0.4155 | 0.679792 | 0.339896 |
| M9 | 0.0018233559982335 | 0.005682 | 0.3209 | 0.749804 | 0.374902 |
| M10 | -0.00140612307178253 | 0.005673 | -0.2479 | 0.8054 | 0.4027 |
| M11 | 0.00100553451485034 | 0.005681 | 0.177 | 0.860326 | 0.430163 |
| t | 0.000104797369572300 | 0.000108 | 0.9693 | 0.33771 | 0.168855 |
| Multiple Linear Regression - Regression Statistics | |
| Multiple R | 0.9731156931693 |
| R-squared | 0.946954152292366 |
| Adjusted R-squared | 0.930075928021755 |
| F-TEST (value) | 56.1050817378485 |
| F-TEST (DF numerator) | 14 |
| F-TEST (DF denominator) | 44 |
| p-value | 0 |
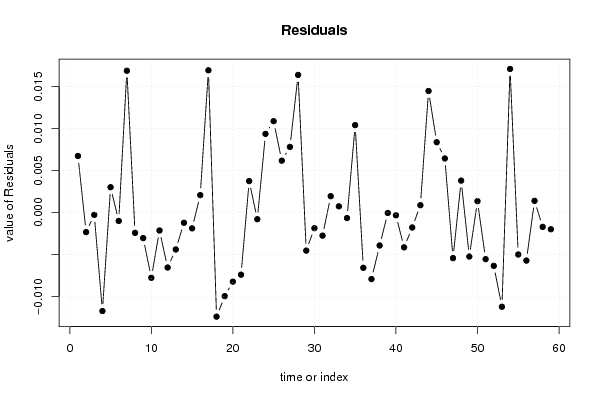
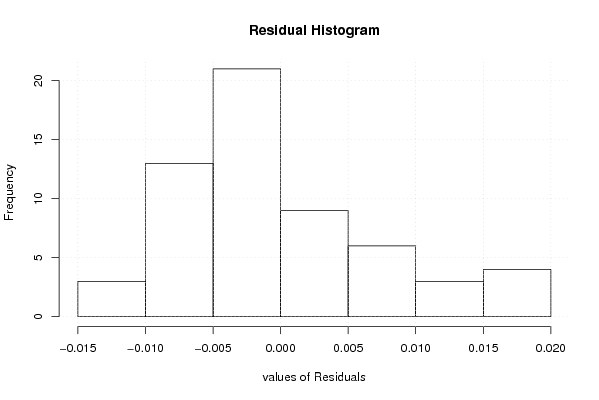
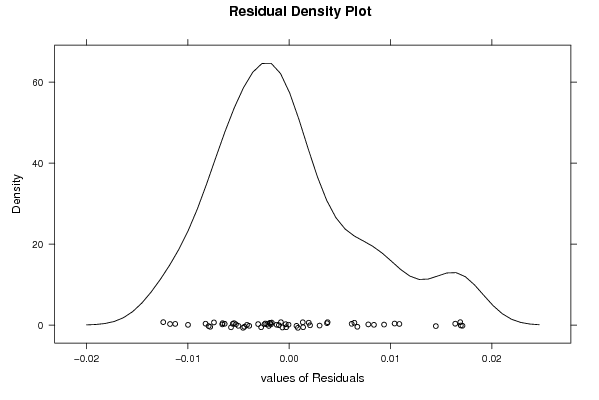
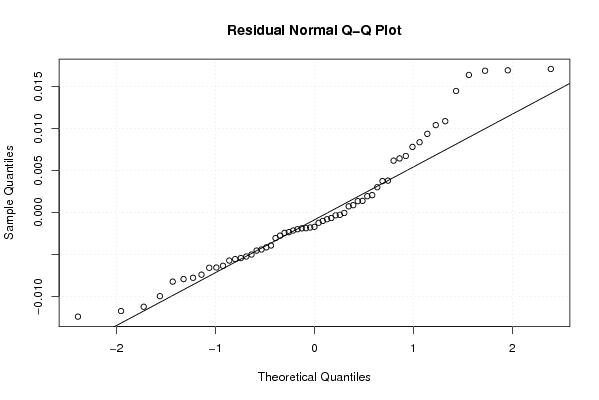
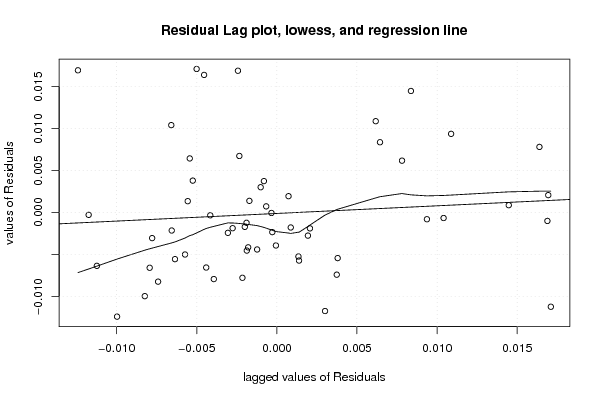
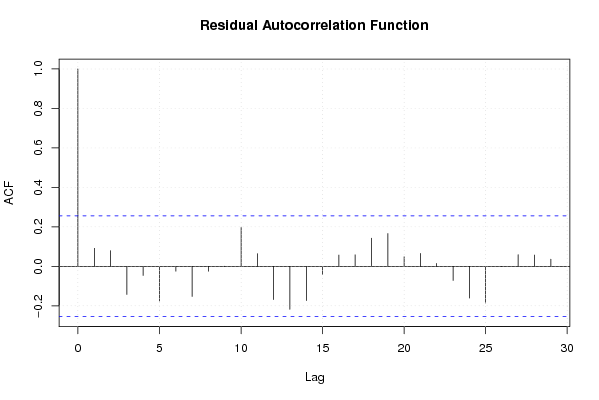
| Multiple Linear Regression - Residual Statistics | |
| Residual Standard Deviation | 0.00843233357505844 |
| Sum Squared Residuals | 0.00312858697892655 |
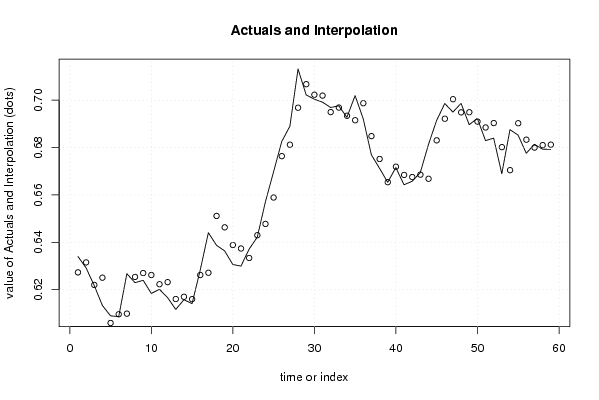
| Multiple Linear Regression - Actuals, Interpolation, and Residuals | |||
| Time or Index | Actuals | Interpolation Forecast | Residuals Prediction Error |
| 1 | 0.634 | 0.627269272446225 | 0.00673072755377538 |
| 2 | 0.62915 | 0.631494396965373 | -0.00234439696537318 |
| 3 | 0.62168 | 0.621967443332421 | -0.000287443332420607 |
| 4 | 0.61328 | 0.625030517458512 | -0.0117505174585119 |
| 5 | 0.6089 | 0.605895101354008 | 0.00300489864599194 |
| 6 | 0.60857 | 0.609581801703061 | -0.00101180170306099 |
| 7 | 0.62672 | 0.609833089712889 | 0.0168869102871114 |
| 8 | 0.62291 | 0.625341530012393 | -0.00243153001239255 |
| 9 | 0.62393 | 0.626989353507245 | -0.0030593535072454 |
| 10 | 0.61838 | 0.62616846953749 | -0.00778846953748932 |
| 11 | 0.62012 | 0.622272534449369 | -0.00215253444936882 |
| 12 | 0.61659 | 0.623155892879601 | -0.00656589287960091 |
| 13 | 0.6116 | 0.616012917730676 | -0.00441291773067619 |
| 14 | 0.61573 | 0.616963077649777 | -0.00123307764977660 |
| 15 | 0.61407 | 0.615967264361116 | -0.00189726436111608 |
| 16 | 0.62823 | 0.626166578330462 | 0.00206342166953835 |
| 17 | 0.64405 | 0.627109419523948 | 0.0169405804760515 |
| 18 | 0.6387 | 0.651119413311686 | -0.0124194133116861 |
| 19 | 0.63633 | 0.646307640787393 | -0.00997764078739335 |
| 20 | 0.63059 | 0.638836465126138 | -0.00824646512613843 |
| 21 | 0.62994 | 0.63735673252652 | -0.00741673252651944 |
| 22 | 0.63709 | 0.633353654891394 | 0.00373634510860577 |
| 23 | 0.64217 | 0.642980209068528 | -0.000810209068528287 |
| 24 | 0.65711 | 0.64774467866246 | 0.00936532133754063 |
| 25 | 0.66977 | 0.658894717231496 | 0.0108752827685044 |
| 26 | 0.68255 | 0.676379530363386 | 0.00617046963661376 |
| 27 | 0.68902 | 0.681209090927034 | 0.00781090907296648 |
| 28 | 0.71322 | 0.696830631824267 | 0.0163893681757331 |
| 29 | 0.70224 | 0.706786061519028 | -0.00454606151902844 |
| 30 | 0.70045 | 0.702327603930139 | -0.00187760393013871 |
| 31 | 0.69919 | 0.701952579300345 | -0.00276257930034526 |
| 32 | 0.69693 | 0.694993277694533 | 0.00193672230546707 |
| 33 | 0.69763 | 0.69690435937686 | 0.000725640623139897 |
| 34 | 0.69278 | 0.693446861426038 | -0.000666861426038097 |
| 35 | 0.70196 | 0.691553572197017 | 0.0104064278029832 |
| 36 | 0.69215 | 0.698743985571136 | -0.00659398557113554 |
| 37 | 0.6769 | 0.68484097411131 | -0.00794097411131038 |
| 38 | 0.67124 | 0.675178356124898 | -0.00393835612489835 |
| 39 | 0.66532 | 0.665381209450288 | -6.12094502876953e-05 |
| 40 | 0.67157 | 0.671910179677694 | -0.000340179677693688 |
| 41 | 0.66428 | 0.668439727117283 | -0.00415972711728284 |
| 42 | 0.66576 | 0.667553085644593 | -0.0017930856445932 |
| 43 | 0.66942 | 0.668554979148724 | 0.000865020851275675 |
| 44 | 0.6813 | 0.666824534501707 | 0.0144754654982926 |
| 45 | 0.69144 | 0.683071303993709 | 0.0083686960062906 |
| 46 | 0.69862 | 0.692183283423284 | 0.00643671657671561 |
| 47 | 0.695 | 0.700440611852514 | -0.00544061185251366 |
| 48 | 0.69867 | 0.694875442886804 | 0.00379455711319583 |
| 49 | 0.68968 | 0.694932118480293 | -0.00525211848029325 |
| 50 | 0.69233 | 0.690984638896566 | 0.00134536110343437 |
| 51 | 0.68293 | 0.688494991929142 | -0.0055649919291421 |
| 52 | 0.68399 | 0.690352092709066 | -0.00636209270906589 |
| 53 | 0.66895 | 0.680189690485732 | -0.0112396904857322 |
| 54 | 0.68756 | 0.670458095410521 | 0.0171019045894790 |
| 55 | 0.68527 | 0.690281711050649 | -0.00501171105064852 |
| 56 | 0.6776 | 0.683334192665229 | -0.00573419266522864 |
| 57 | 0.68137 | 0.679988250595666 | 0.00138174940433434 |
| 58 | 0.67933 | 0.681047730721794 | -0.00171773072179397 |
| 59 | 0.67922 | 0.681223072432573 | -0.00200307243257242 |
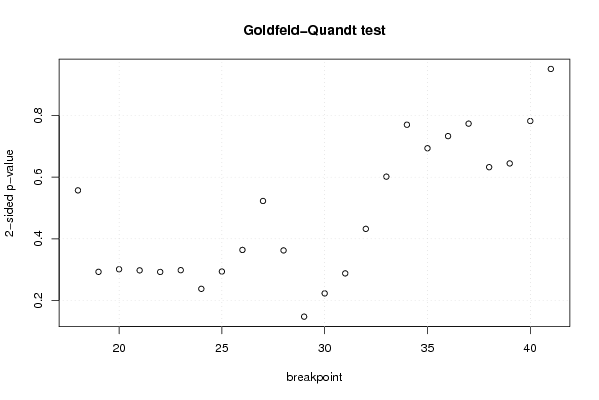
| Goldfeld-Quandt test for Heteroskedasticity | |||
| p-values | Alternative Hypothesis | ||
| breakpoint index | greater | 2-sided | less |
| 18 | 0.721427980163072 | 0.557144039673856 | 0.278572019836928 |
| 19 | 0.85371131748415 | 0.2925773650317 | 0.14628868251585 |
| 20 | 0.84951658871089 | 0.300966822578221 | 0.150483411289110 |
| 21 | 0.851319014682401 | 0.297361970635197 | 0.148680985317599 |
| 22 | 0.853890768858869 | 0.292218462282263 | 0.146109231141131 |
| 23 | 0.851022658957065 | 0.29795468208587 | 0.148977341042935 |
| 24 | 0.88131245196 | 0.237375096079998 | 0.118687548039999 |
| 25 | 0.853192463733842 | 0.293615072532317 | 0.146807536266158 |
| 26 | 0.818154601794346 | 0.363690796411308 | 0.181845398205654 |
| 27 | 0.738685229677218 | 0.522629540645563 | 0.261314770322782 |
| 28 | 0.818907348488565 | 0.362185303022869 | 0.181092651511435 |
| 29 | 0.926469088136997 | 0.147061823726006 | 0.0735309118630028 |
| 30 | 0.888681490891468 | 0.222637018217063 | 0.111318509108532 |
| 31 | 0.856192465365592 | 0.287615069268816 | 0.143807534634408 |
| 32 | 0.783921103250234 | 0.432157793499532 | 0.216078896749766 |
| 33 | 0.69918745880513 | 0.601625082389739 | 0.300812541194870 |
| 34 | 0.61489790547897 | 0.77020418904206 | 0.38510209452103 |
| 35 | 0.653064213201914 | 0.693871573596173 | 0.346935786798087 |
| 36 | 0.633315759348669 | 0.733368481302662 | 0.366684240651331 |
| 37 | 0.613104101521205 | 0.773791796957591 | 0.386895898478795 |
| 38 | 0.683805779535638 | 0.632388440928724 | 0.316194220464362 |
| 39 | 0.67771627543586 | 0.64456744912828 | 0.32228372456414 |
| 40 | 0.608879685141083 | 0.782240629717834 | 0.391120314858917 |
| 41 | 0.475684106538862 | 0.951368213077723 | 0.524315893461138 |
| Meta Analysis of Goldfeld-Quandt test for Heteroskedasticity | |||
| Description | # significant tests | % significant tests | OK/NOK |
| 1% type I error level | 0 | 0 | OK |
| 5% type I error level | 0 | 0 | OK |
| 10% type I error level | 0 | 0 | OK |