| Multiple Linear Regression - Estimated Regression Equation |
| Zichtrekeningen[t] = + 3463.58138507922 + 0.0139554412607161`Bel20 `[t] + e[t] |
| Multiple Linear Regression - Ordinary Least Squares | |||||
| Variable | Parameter | S.D. | T-STAT H0: parameter = 0 | 2-tail p-value | 1-tail p-value |
| (Intercept) | 3463.58138507922 | 125.525559 | 27.5926 | 0 | 0 |
| `Bel20 ` | 0.0139554412607161 | 0.035976 | 0.3879 | 0.699525 | 0.349762 |
| Multiple Linear Regression - Regression Statistics | |
| Multiple R | 0.0513127948145063 |
| R-squared | 0.00263300291167562 |
| Adjusted R-squared | -0.0148646637039089 |
| F-TEST (value) | 0.150477373327623 |
| F-TEST (DF numerator) | 1 |
| F-TEST (DF denominator) | 57 |
| p-value | 0.69952451079962 |
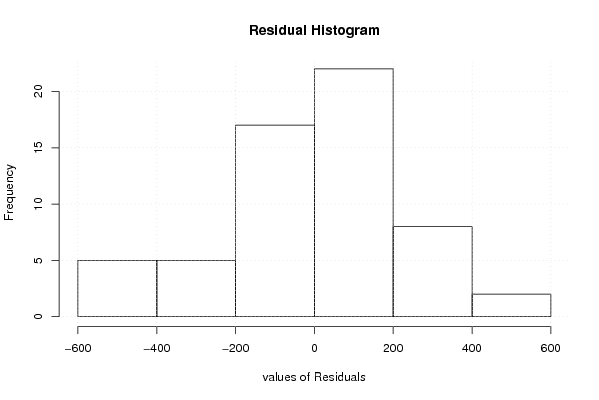
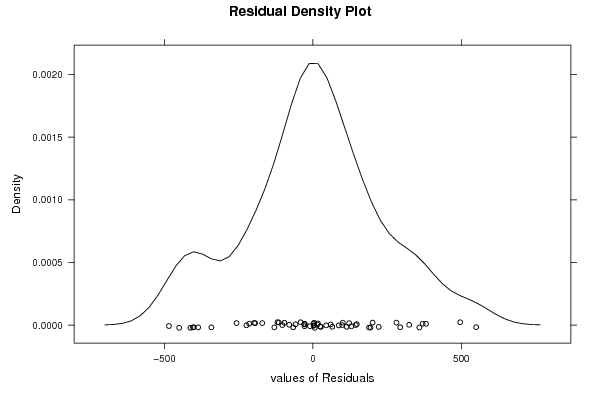
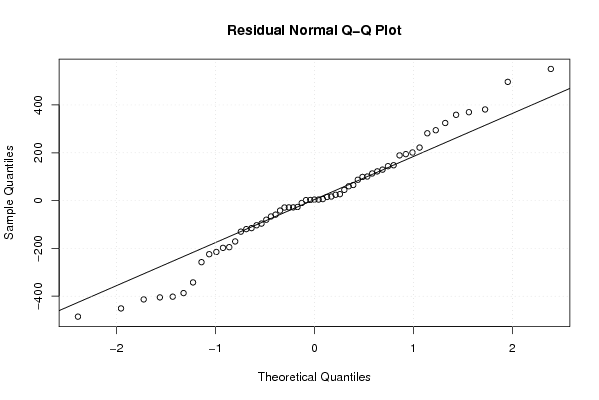
| Multiple Linear Regression - Residual Statistics | |
| Residual Standard Deviation | 232.257386984912 |
| Sum Squared Residuals | 3074779.14711637 |
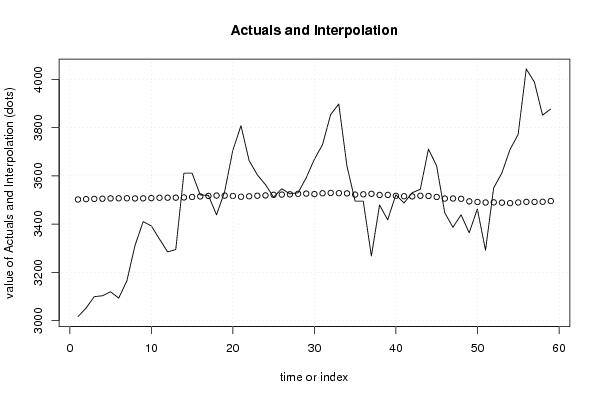
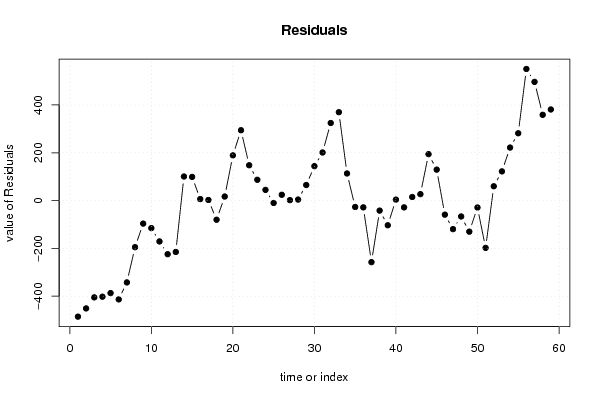
| Multiple Linear Regression - Actuals, Interpolation, and Residuals | |||
| Time or Index | Actuals | Interpolation Forecast | Residuals Prediction Error |
| 1 | 3016.7 | 3502.0531873291 | -485.353187329097 |
| 2 | 3052.4 | 3503.34420520013 | -450.944205200134 |
| 3 | 3099.6 | 3504.35136939592 | -404.751369395921 |
| 4 | 3103.3 | 3505.19441760248 | -401.89441760248 |
| 5 | 3119.8 | 3506.57223831815 | -386.772238318151 |
| 6 | 3093.7 | 3506.93005583208 | -413.230055832076 |
| 7 | 3164.9 | 3507.11273255818 | -342.212732558178 |
| 8 | 3311.5 | 3506.30261919299 | -194.802619192994 |
| 9 | 3410.6 | 3506.80571285044 | -96.2057128504428 |
| 10 | 3392.6 | 3507.70416415881 | -115.104164158808 |
| 11 | 3338.2 | 3509.03649013597 | -170.836490135968 |
| 12 | 3285.1 | 3509.31350564499 | -224.213505644993 |
| 13 | 3294.8 | 3509.56902977448 | -214.769029774477 |
| 14 | 3611.2 | 3510.52734992585 | 100.672650074149 |
| 15 | 3611.3 | 3512.34406926917 | 98.9559307308297 |
| 16 | 3521 | 3514.7564068455 | 6.24359315450208 |
| 17 | 3519.3 | 3516.7943199328 | 2.50568006719989 |
| 18 | 3438.3 | 3518.25824572105 | -79.9582457210493 |
| 19 | 3534.9 | 3517.94494606475 | 16.9550539352537 |
| 20 | 3705.8 | 3516.62685463767 | 189.173145362328 |
| 21 | 3807.6 | 3513.40398503292 | 294.196014967078 |
| 22 | 3663 | 3515.23898600429 | 147.761013995707 |
| 23 | 3604.5 | 3517.48106719724 | 87.0189328027598 |
| 24 | 3563.8 | 3518.98588242838 | 44.814117571617 |
| 25 | 3511.4 | 3521.33625784551 | -9.9362578455129 |
| 26 | 3546.5 | 3522.19074951391 | 24.3092504860934 |
| 27 | 3525.4 | 3523.46264843041 | 1.93735156959178 |
| 28 | 3529.9 | 3525.59811005212 | 4.301889947877 |
| 29 | 3591.6 | 3526.41771311737 | 65.182286882635 |
| 30 | 3668.3 | 3524.38496354333 | 143.915036456671 |
| 31 | 3728.8 | 3527.6545838763 | 201.145416123698 |
| 32 | 3853.6 | 3529.12953446315 | 324.470465536853 |
| 33 | 3897.7 | 3528.07506132149 | 369.624938678512 |
| 34 | 3640.7 | 3527.25783068126 | 113.442169318740 |
| 35 | 3495.5 | 3522.2294060862 | -26.7294060861988 |
| 36 | 3495.1 | 3523.54079890147 | -28.4407989014684 |
| 37 | 3268 | 3525.47697682198 | -257.47697682198 |
| 38 | 3479.1 | 3520.87098343388 | -41.7709834338808 |
| 39 | 3417.8 | 3521.03147100838 | -103.231471008379 |
| 40 | 3521.3 | 3517.23293945162 | 4.06706054837558 |
| 41 | 3487.1 | 3515.50930290151 | -28.4093029015136 |
| 42 | 3529.9 | 3514.85925844759 | 15.0407415524107 |
| 43 | 3544.3 | 3517.41617439538 | 26.8838256046224 |
| 44 | 3710.8 | 3516.62685463767 | 194.173145362328 |
| 45 | 3641.9 | 3512.48641477003 | 129.413585229970 |
| 46 | 3447.1 | 3505.90265624646 | -58.8026562464619 |
| 47 | 3386.8 | 3506.10403326385 | -119.304033263854 |
| 48 | 3438.5 | 3504.92214694348 | -66.4221469434839 |
| 49 | 3364.3 | 3494.25293299084 | -129.952932990841 |
| 50 | 3462.7 | 3491.69392372686 | -28.9939237268638 |
| 51 | 3291.9 | 3489.57799972291 | -197.677999722914 |
| 52 | 3550 | 3490.17222241180 | 59.8277775882049 |
| 53 | 3611 | 3488.85454964796 | 122.145450352042 |
| 54 | 3708.6 | 3486.8879488655 | 221.712051134502 |
| 55 | 3771.1 | 3489.60046798334 | 281.499532016656 |
| 56 | 4042.7 | 3492.21822965503 | 550.481770344971 |
| 57 | 3988.4 | 3491.90534866196 | 496.494651338037 |
| 58 | 3851.2 | 3492.48073150514 | 358.719268494857 |
| 59 | 3876.7 | 3495.58693362095 | 381.113066379047 |
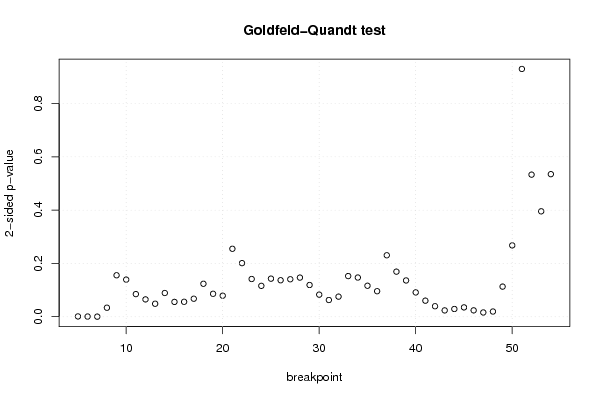
| Goldfeld-Quandt test for Heteroskedasticity | |||
| p-values | Alternative Hypothesis | ||
| breakpoint index | greater | 2-sided | less |
| 5 | 0.000570093347498656 | 0.00114018669499731 | 0.999429906652501 |
| 6 | 0.000345826608979264 | 0.000691653217958528 | 0.99965417339102 |
| 7 | 0.000139386525312424 | 0.000278773050624848 | 0.999860613474688 |
| 8 | 0.0168838463376311 | 0.0337676926752622 | 0.983116153662369 |
| 9 | 0.0778007625766571 | 0.155601525153314 | 0.922199237423343 |
| 10 | 0.0696561321669759 | 0.139312264333952 | 0.930343867833024 |
| 11 | 0.0424692629274156 | 0.0849385258548313 | 0.957530737072584 |
| 12 | 0.0325549833484845 | 0.0651099666969691 | 0.967445016651515 |
| 13 | 0.0243456829596272 | 0.0486913659192544 | 0.975654317040373 |
| 14 | 0.0445176681084051 | 0.0890353362168102 | 0.955482331891595 |
| 15 | 0.0278087891753847 | 0.0556175783507693 | 0.972191210824615 |
| 16 | 0.0280143590594912 | 0.0560287181189824 | 0.97198564094051 |
| 17 | 0.0338041716800477 | 0.0676083433600954 | 0.966195828319952 |
| 18 | 0.06184654774001 | 0.12369309548002 | 0.93815345225999 |
| 19 | 0.0430446850857256 | 0.0860893701714511 | 0.956955314914274 |
| 20 | 0.0394579792469901 | 0.0789159584939802 | 0.96054202075301 |
| 21 | 0.127531128201865 | 0.25506225640373 | 0.872468871798135 |
| 22 | 0.100617825340446 | 0.201235650680892 | 0.899382174659554 |
| 23 | 0.0707986585750734 | 0.141597317150147 | 0.929201341424927 |
| 24 | 0.0579406567843821 | 0.115881313568764 | 0.942059343215618 |
| 25 | 0.0714359779286133 | 0.142871955857227 | 0.928564022071387 |
| 26 | 0.0684546761543602 | 0.136909352308720 | 0.93154532384564 |
| 27 | 0.0703179451090773 | 0.140635890218155 | 0.929682054890923 |
| 28 | 0.073439138661559 | 0.146878277323118 | 0.926560861338441 |
| 29 | 0.0595633383256227 | 0.119126676651245 | 0.940436661674377 |
| 30 | 0.0414357935382785 | 0.082871587076557 | 0.958564206461721 |
| 31 | 0.0313673744288466 | 0.0627347488576933 | 0.968632625571153 |
| 32 | 0.0376660822855208 | 0.0753321645710415 | 0.96233391771448 |
| 33 | 0.0763176100122152 | 0.152635220024430 | 0.923682389987785 |
| 34 | 0.0735491981341154 | 0.147098396268231 | 0.926450801865885 |
| 35 | 0.058123384477809 | 0.116246768955618 | 0.94187661552219 |
| 36 | 0.0479016533513463 | 0.0958033067026926 | 0.952098346648654 |
| 37 | 0.115333025887190 | 0.230666051774381 | 0.88466697411281 |
| 38 | 0.0845893414536008 | 0.169178682907202 | 0.915410658546399 |
| 39 | 0.0680498165315993 | 0.136099633063199 | 0.9319501834684 |
| 40 | 0.0456509850538975 | 0.0913019701077951 | 0.954349014946102 |
| 41 | 0.0301288511456433 | 0.0602577022912867 | 0.969871148854357 |
| 42 | 0.0197088253014893 | 0.0394176506029785 | 0.98029117469851 |
| 43 | 0.0118803605615817 | 0.0237607211231633 | 0.988119639438418 |
| 44 | 0.0145184599228852 | 0.0290369198457704 | 0.985481540077115 |
| 45 | 0.0175125112083173 | 0.0350250224166347 | 0.982487488791683 |
| 46 | 0.0119562906638478 | 0.0239125813276957 | 0.988043709336152 |
| 47 | 0.00799701543603963 | 0.0159940308720793 | 0.99200298456396 |
| 48 | 0.00976640655553283 | 0.0195328131110657 | 0.990233593444467 |
| 49 | 0.0564973428258527 | 0.112994685651705 | 0.943502657174147 |
| 50 | 0.133884739310644 | 0.267769478621288 | 0.866115260689356 |
| 51 | 0.535016336631806 | 0.929967326736388 | 0.464983663368194 |
| 52 | 0.733378333413874 | 0.533243333172252 | 0.266621666586126 |
| 53 | 0.802167257748281 | 0.395665484503438 | 0.197832742251719 |
| 54 | 0.732482378568662 | 0.535035242862675 | 0.267517621431338 |
| Meta Analysis of Goldfeld-Quandt test for Heteroskedasticity | |||
| Description | # significant tests | % significant tests | OK/NOK |
| 1% type I error level | 3 | 0.06 | NOK |
| 5% type I error level | 12 | 0.24 | NOK |
| 10% type I error level | 26 | 0.52 | NOK |