| Multiple Linear Regression - Estimated Regression Equation |
| WK>25j[t] = + 109.356227758007 + 20.1391918264263ExpBE[t] + 1.69465044197025M1[t] -2.74432326942943M2[t] -49.8616806336816M3[t] -21.2417575479279M4[t] -23.852892894042M5[t] -39.9753817012972M6[t] + 6.41948685569967M7[t] + 51.9229250373091M8[t] -28.2227069222822M9[t] -32.6366261049248M10[t] -28.9670301917116M11[t] + e[t] |
| Multiple Linear Regression - Ordinary Least Squares | |||||
| Variable | Parameter | S.D. | T-STAT H0: parameter = 0 | 2-tail p-value | 1-tail p-value |
| (Intercept) | 109.356227758007 | 32.210234 | 3.3951 | 0.001403 | 0.000702 |
| ExpBE | 20.1391918264263 | 1.898898 | 10.6057 | 0 | 0 |
| M1 | 1.69465044197025 | 14.237024 | 0.119 | 0.905758 | 0.452879 |
| M2 | -2.74432326942943 | 14.198678 | -0.1933 | 0.847572 | 0.423786 |
| M3 | -49.8616806336816 | 14.620873 | -3.4103 | 0.001342 | 0.000671 |
| M4 | -21.2417575479279 | 14.189787 | -1.497 | 0.141086 | 0.070543 |
| M5 | -23.852892894042 | 14.196697 | -1.6802 | 0.09956 | 0.04978 |
| M6 | -39.9753817012972 | 14.378808 | -2.7802 | 0.00779 | 0.003895 |
| M7 | 6.41948685569967 | 14.180839 | 0.4527 | 0.652857 | 0.326428 |
| M8 | 51.9229250373091 | 14.847002 | 3.4972 | 0.001038 | 0.000519 |
| M9 | -28.2227069222822 | 14.500221 | -1.9464 | 0.057603 | 0.028801 |
| M10 | -32.6366261049248 | 14.541194 | -2.2444 | 0.029552 | 0.014776 |
| M11 | -28.9670301917116 | 14.360289 | -2.0172 | 0.04941 | 0.024705 |
| Multiple Linear Regression - Regression Statistics | |
| Multiple R | 0.847826266166205 |
| R-squared | 0.718809377601329 |
| Adjusted R-squared | 0.647016027201668 |
| F-TEST (value) | 10.0121999265927 |
| F-TEST (DF numerator) | 12 |
| F-TEST (DF denominator) | 47 |
| p-value | 2.5348314558471e-09 |
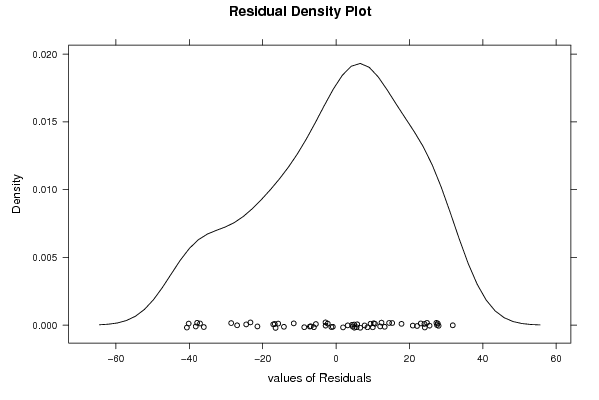
| Multiple Linear Regression - Residual Statistics | |
| Residual Standard Deviation | 22.4179352962809 |
| Sum Squared Residuals | 23620.4996785672 |
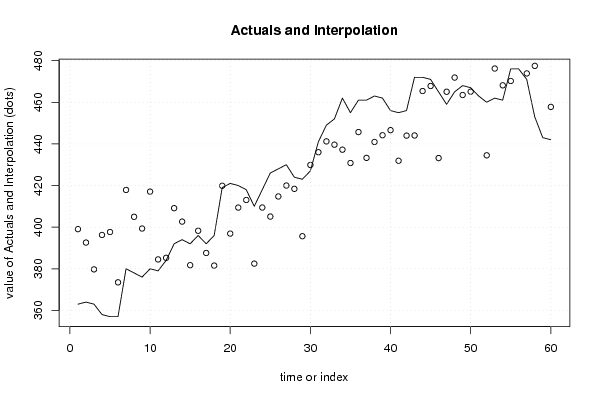
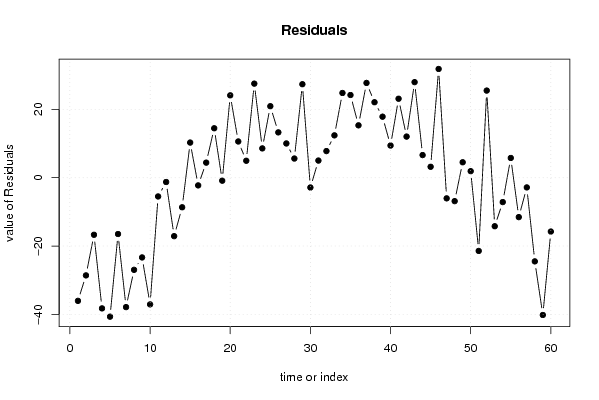
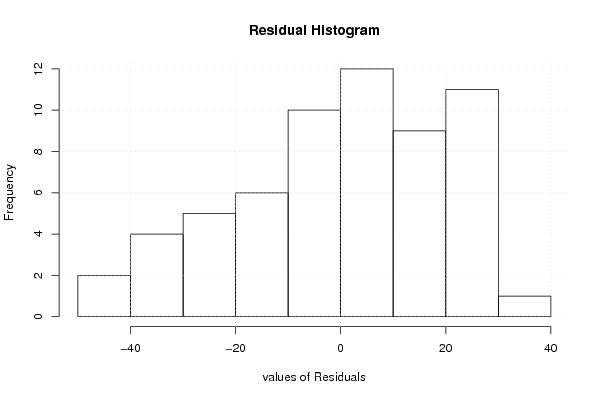
| Multiple Linear Regression - Actuals, Interpolation, and Residuals | |||
| Time or Index | Actuals | Interpolation Forecast | Residuals Prediction Error |
| 1 | 363 | 399.041321317873 | -36.0413213178727 |
| 2 | 364 | 392.588428423832 | -28.5884284238318 |
| 3 | 363 | 379.707697164505 | -16.7076971645047 |
| 4 | 358 | 396.244105154403 | -38.2441051544025 |
| 5 | 357 | 397.660808173574 | -40.6608081735736 |
| 6 | 357 | 373.482642635748 | -16.4826426357479 |
| 7 | 380 | 417.863592010102 | -37.8635920101022 |
| 8 | 378 | 404.963373895075 | -26.9633738950752 |
| 9 | 376 | 399.332751693261 | -23.3327516932614 |
| 10 | 380 | 417.071943519688 | -37.0719435196877 |
| 11 | 379 | 384.490994145334 | -5.49099414533349 |
| 12 | 384 | 385.263155780048 | -1.26315578004820 |
| 13 | 392 | 409.110917231087 | -17.1109172310875 |
| 14 | 394 | 402.658024337045 | -8.65802433704512 |
| 15 | 392 | 381.721616347147 | 10.2783836528527 |
| 16 | 396 | 398.258024337045 | -2.25802433704512 |
| 17 | 392 | 387.591212260360 | 4.40878773963953 |
| 18 | 396 | 381.538319366318 | 14.4616806336815 |
| 19 | 419 | 419.877511192745 | -0.877511192744778 |
| 20 | 421 | 396.907697164505 | 24.0923028354953 |
| 21 | 420 | 409.402347606475 | 10.5976523935254 |
| 22 | 418 | 413.044105154402 | 4.95589484559751 |
| 23 | 410 | 382.477074962691 | 27.5229250373092 |
| 24 | 418 | 409.43018597176 | 8.56981402824016 |
| 25 | 426 | 405.083078865802 | 20.9169211341978 |
| 26 | 428 | 414.741539432901 | 13.2584605670990 |
| 27 | 430 | 419.986080817357 | 10.0139191826427 |
| 28 | 424 | 418.397216163471 | 5.60278383652856 |
| 29 | 423 | 395.646888990931 | 27.353111009069 |
| 30 | 427 | 429.872379749742 | -2.87237974974167 |
| 31 | 441 | 435.988864653886 | 5.01113534611412 |
| 32 | 449 | 441.213919182643 | 7.78608081735736 |
| 33 | 452 | 439.611135346114 | 12.3888646538859 |
| 34 | 462 | 437.211135346114 | 24.7888646538859 |
| 35 | 455 | 430.811135346114 | 24.1888646538859 |
| 36 | 461 | 445.680731259327 | 15.3192687406727 |
| 37 | 461 | 433.277947422799 | 27.7220525772009 |
| 38 | 463 | 440.922488807255 | 22.0775111927448 |
| 39 | 462 | 444.153111009069 | 17.8468889909310 |
| 40 | 456 | 446.592084720468 | 9.40791527953162 |
| 41 | 455 | 431.897434278498 | 23.1025657215015 |
| 42 | 456 | 443.96981402824 | 12.0301859717598 |
| 43 | 472 | 444.044541384456 | 27.9554586155436 |
| 44 | 472 | 465.380949374354 | 6.61905062564574 |
| 45 | 471 | 467.806003903111 | 3.19399609688900 |
| 46 | 465 | 433.183296980829 | 31.8167030191712 |
| 47 | 459 | 465.047761451039 | -6.04776145103894 |
| 48 | 465 | 471.861680633682 | -6.86168063368154 |
| 49 | 468 | 463.486735162439 | 4.51326483756139 |
| 50 | 467 | 465.089518998967 | 1.91048100103314 |
| 51 | 463 | 484.431494661922 | -21.4314946619217 |
| 52 | 460 | 434.508569624613 | 25.4914303753875 |
| 53 | 462 | 476.203656296636 | -14.2036562966364 |
| 54 | 461 | 468.136844219952 | -7.13684421995179 |
| 55 | 476 | 470.225490758811 | 5.7745092411893 |
| 56 | 476 | 487.534060383423 | -11.5340603834232 |
| 57 | 471 | 473.847761451039 | -2.84776145103891 |
| 58 | 453 | 477.489518998967 | -24.4895189989668 |
| 59 | 443 | 483.173034094823 | -40.1730340948226 |
| 60 | 442 | 457.764246355183 | -15.7642463551831 |
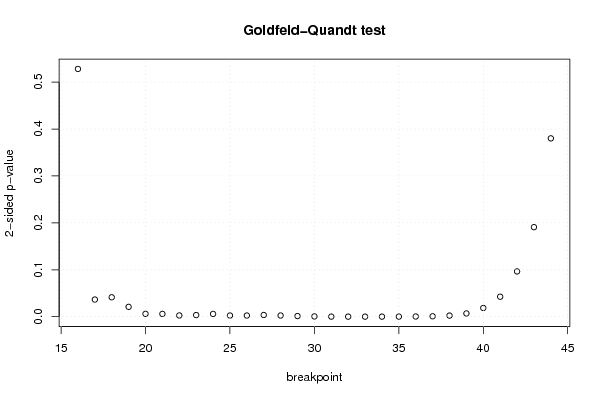
| Goldfeld-Quandt test for Heteroskedasticity | |||
| p-values | Alternative Hypothesis | ||
| breakpoint index | greater | 2-sided | less |
| 16 | 0.735972928818482 | 0.528054142363035 | 0.264027071181518 |
| 17 | 0.981754365411545 | 0.0364912691769099 | 0.0182456345884550 |
| 18 | 0.97935232053374 | 0.0412953589325189 | 0.0206476794662594 |
| 19 | 0.98954424177301 | 0.0209115164539771 | 0.0104557582269886 |
| 20 | 0.996997157678044 | 0.00600568464391195 | 0.00300284232195598 |
| 21 | 0.997059686598547 | 0.0058806268029056 | 0.0029403134014528 |
| 22 | 0.998706619077193 | 0.00258676184561459 | 0.00129338092280729 |
| 23 | 0.99829217012879 | 0.00341565974242024 | 0.00170782987121012 |
| 24 | 0.997086629643525 | 0.00582674071295021 | 0.00291337035647511 |
| 25 | 0.998774549219954 | 0.00245090156009149 | 0.00122545078004574 |
| 26 | 0.998814871565743 | 0.00237025686851346 | 0.00118512843425673 |
| 27 | 0.99822896729288 | 0.00354206541424046 | 0.00177103270712023 |
| 28 | 0.998771255665196 | 0.00245748866960761 | 0.00122874433480381 |
| 29 | 0.999368774214136 | 0.00126245157172747 | 0.000631225785863735 |
| 30 | 0.999721977160076 | 0.000556045679848304 | 0.000278022839924152 |
| 31 | 0.99995307931428 | 9.38413714405145e-05 | 4.69206857202573e-05 |
| 32 | 0.999981862053227 | 3.62758935469469e-05 | 1.81379467734735e-05 |
| 33 | 0.999990947865985 | 1.81042680293711e-05 | 9.05213401468556e-06 |
| 34 | 0.999977709525403 | 4.45809491942825e-05 | 2.22904745971412e-05 |
| 35 | 0.999930367566821 | 0.000139264866357063 | 6.96324331785316e-05 |
| 36 | 0.999839742177451 | 0.000320515645097844 | 0.000160257822548922 |
| 37 | 0.999618958666454 | 0.000762082667091595 | 0.000381041333545797 |
| 38 | 0.998866512507234 | 0.00226697498553168 | 0.00113348749276584 |
| 39 | 0.996575113579644 | 0.00684977284071161 | 0.00342488642035580 |
| 40 | 0.99073548113313 | 0.0185290377337405 | 0.00926451886687027 |
| 41 | 0.978731480712336 | 0.0425370385753285 | 0.0212685192876642 |
| 42 | 0.951764120138474 | 0.096471759723052 | 0.048235879861526 |
| 43 | 0.904600093561522 | 0.190799812876955 | 0.0953999064384775 |
| 44 | 0.80993492385613 | 0.380130152287739 | 0.190065076143869 |
| Meta Analysis of Goldfeld-Quandt test for Heteroskedasticity | |||
| Description | # significant tests | % significant tests | OK/NOK |
| 1% type I error level | 20 | 0.689655172413793 | NOK |
| 5% type I error level | 25 | 0.862068965517241 | NOK |
| 10% type I error level | 26 | 0.896551724137931 | NOK |