| Multiple Linear Regression - Estimated Regression Equation |
| Y[t] = + 105.300995850622 -8.30497925311204X[t] + 8.69983402489626M1[t] -16.8609958506224M2[t] -5.9009958506224M3[t] + 10.64M4[t] + 10.52M5[t] + 4.02M6[t] -3.59999999999999M7[t] -3.38M8[t] -2.06000000000000M9[t] + 6.74M10[t] + 0.560000000000001M11[t] + e[t] |
| Multiple Linear Regression - Ordinary Least Squares | |||||
| Variable | Parameter | S.D. | T-STAT H0: parameter = 0 | 2-tail p-value | 1-tail p-value |
| (Intercept) | 105.300995850622 | 2.424293 | 43.4357 | 0 | 0 |
| X | -8.30497925311204 | 1.889219 | -4.396 | 6.1e-05 | 3e-05 |
| M1 | 8.69983402489626 | 3.243007 | 2.6826 | 0.009989 | 0.004994 |
| M2 | -16.8609958506224 | 3.407584 | -4.9481 | 1e-05 | 5e-06 |
| M3 | -5.9009958506224 | 3.407584 | -1.7317 | 0.089746 | 0.044873 |
| M4 | 10.64 | 3.386571 | 3.1418 | 0.002875 | 0.001437 |
| M5 | 10.52 | 3.386571 | 3.1064 | 0.003177 | 0.001588 |
| M6 | 4.02 | 3.386571 | 1.187 | 0.241053 | 0.120526 |
| M7 | -3.59999999999999 | 3.386571 | -1.063 | 0.293091 | 0.146545 |
| M8 | -3.38 | 3.386571 | -0.9981 | 0.323255 | 0.161628 |
| M9 | -2.06000000000000 | 3.386571 | -0.6083 | 0.545866 | 0.272933 |
| M10 | 6.74 | 3.386571 | 1.9902 | 0.052279 | 0.02614 |
| M11 | 0.560000000000001 | 3.386571 | 0.1654 | 0.869356 | 0.434678 |
| Multiple Linear Regression - Regression Statistics | |
| Multiple R | 0.855759430330213 |
| R-squared | 0.73232420259909 |
| Adjusted R-squared | 0.665405253248862 |
| F-TEST (value) | 10.9434503934961 |
| F-TEST (DF numerator) | 12 |
| F-TEST (DF denominator) | 48 |
| p-value | 4.93353691233267e-10 |
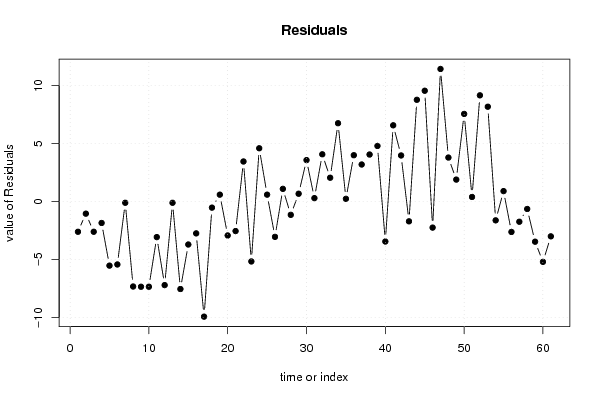
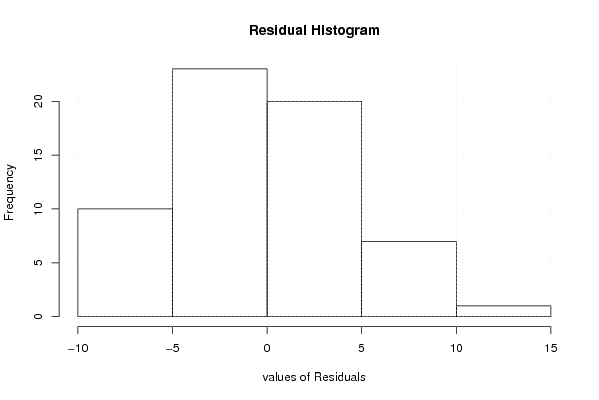
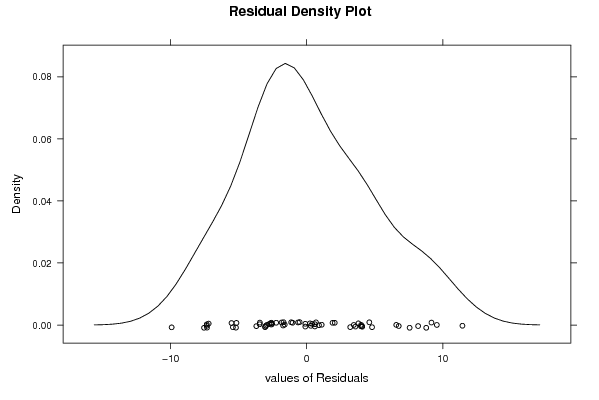
| Multiple Linear Regression - Residual Statistics | |
| Residual Standard Deviation | 5.35463934521169 |
| Sum Squared Residuals | 1376.26380082988 |
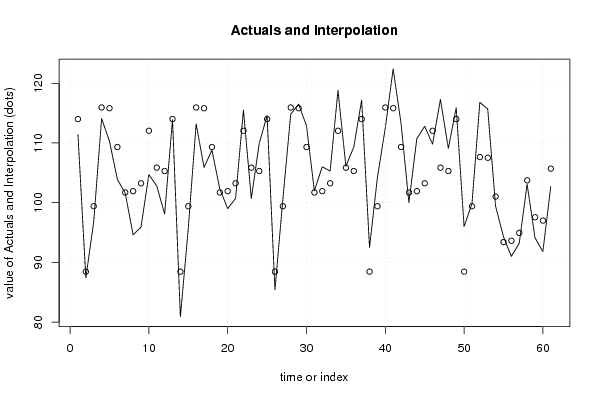
| Multiple Linear Regression - Actuals, Interpolation, and Residuals | |||
| Time or Index | Actuals | Interpolation Forecast | Residuals Prediction Error |
| 1 | 111.4 | 114.000829875519 | -2.60082987551872 |
| 2 | 87.4 | 88.44 | -1.03999999999997 |
| 3 | 96.8 | 99.4 | -2.60000000000000 |
| 4 | 114.1 | 115.940995850622 | -1.84099585062243 |
| 5 | 110.3 | 115.820995850622 | -5.52099585062241 |
| 6 | 103.9 | 109.320995850622 | -5.4209958506224 |
| 7 | 101.6 | 101.700995850622 | -0.100995850622399 |
| 8 | 94.6 | 101.920995850622 | -7.32099585062241 |
| 9 | 95.9 | 103.240995850622 | -7.3409958506224 |
| 10 | 104.7 | 112.040995850622 | -7.3409958506224 |
| 11 | 102.8 | 105.860995850622 | -3.06099585062241 |
| 12 | 98.1 | 105.300995850622 | -7.20099585062241 |
| 13 | 113.9 | 114.000829875519 | -0.100829875518659 |
| 14 | 80.9 | 88.44 | -7.54 |
| 15 | 95.7 | 99.4 | -3.7 |
| 16 | 113.2 | 115.940995850622 | -2.74099585062240 |
| 17 | 105.9 | 115.820995850622 | -9.9209958506224 |
| 18 | 108.8 | 109.320995850622 | -0.52099585062241 |
| 19 | 102.3 | 101.700995850622 | 0.599004149377588 |
| 20 | 99 | 101.920995850622 | -2.9209958506224 |
| 21 | 100.7 | 103.240995850622 | -2.54099585062241 |
| 22 | 115.5 | 112.040995850622 | 3.45900414937759 |
| 23 | 100.7 | 105.860995850622 | -5.1609958506224 |
| 24 | 109.9 | 105.300995850622 | 4.59900414937760 |
| 25 | 114.6 | 114.000829875519 | 0.59917012448133 |
| 26 | 85.4 | 88.44 | -3.04000000000001 |
| 27 | 100.5 | 99.4 | 1.1 |
| 28 | 114.8 | 115.940995850622 | -1.14099585062240 |
| 29 | 116.5 | 115.820995850622 | 0.679004149377588 |
| 30 | 112.9 | 109.320995850622 | 3.5790041493776 |
| 31 | 102 | 101.700995850622 | 0.299004149377590 |
| 32 | 106 | 101.920995850622 | 4.0790041493776 |
| 33 | 105.3 | 103.240995850622 | 2.05900414937759 |
| 34 | 118.8 | 112.040995850622 | 6.75900414937759 |
| 35 | 106.1 | 105.860995850622 | 0.239004149377590 |
| 36 | 109.3 | 105.300995850622 | 3.9990041493776 |
| 37 | 117.2 | 114.000829875519 | 3.19917012448134 |
| 38 | 92.5 | 88.44 | 4.05999999999999 |
| 39 | 104.2 | 99.4 | 4.8 |
| 40 | 112.5 | 115.940995850622 | -3.4409958506224 |
| 41 | 122.4 | 115.820995850622 | 6.5790041493776 |
| 42 | 113.3 | 109.320995850622 | 3.97900414937759 |
| 43 | 100 | 101.700995850622 | -1.70099585062241 |
| 44 | 110.7 | 101.920995850622 | 8.7790041493776 |
| 45 | 112.8 | 103.240995850622 | 9.55900414937759 |
| 46 | 109.8 | 112.040995850622 | -2.24099585062241 |
| 47 | 117.3 | 105.860995850622 | 11.4390041493776 |
| 48 | 109.1 | 105.300995850622 | 3.79900414937759 |
| 49 | 115.9 | 114.000829875519 | 1.89917012448134 |
| 50 | 96 | 88.44 | 7.55999999999999 |
| 51 | 99.8 | 99.4 | 0.399999999999997 |
| 52 | 116.8 | 107.636016597510 | 9.16398340248963 |
| 53 | 115.7 | 107.516016597510 | 8.18398340248962 |
| 54 | 99.4 | 101.016016597510 | -1.61601659751037 |
| 55 | 94.3 | 93.3960165975104 | 0.903983402489621 |
| 56 | 91 | 93.6160165975104 | -2.61601659751037 |
| 57 | 93.2 | 94.9360165975104 | -1.73601659751037 |
| 58 | 103.1 | 103.736016597510 | -0.636016597510378 |
| 59 | 94.1 | 97.5560165975104 | -3.45601659751038 |
| 60 | 91.8 | 96.9960165975104 | -5.19601659751037 |
| 61 | 102.7 | 105.695850622407 | -2.99585062240663 |
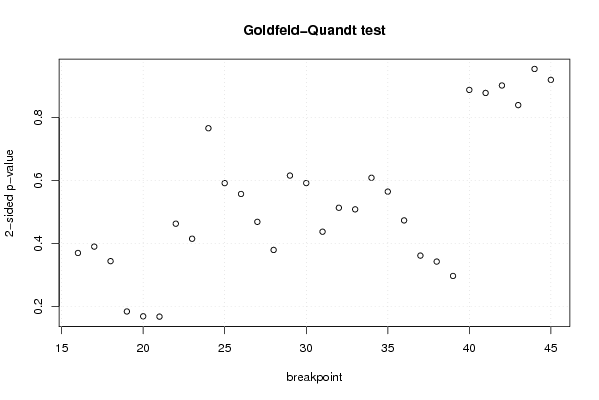
| Goldfeld-Quandt test for Heteroskedasticity | |||
| p-values | Alternative Hypothesis | ||
| breakpoint index | greater | 2-sided | less |
| 16 | 0.185006406914785 | 0.370012813829569 | 0.814993593085215 |
| 17 | 0.195092461390920 | 0.390184922781841 | 0.80490753860908 |
| 18 | 0.172038157508224 | 0.344076315016449 | 0.827961842491776 |
| 19 | 0.0922168555423761 | 0.184433711084752 | 0.907783144457624 |
| 20 | 0.0845475898051151 | 0.169095179610230 | 0.915452410194885 |
| 21 | 0.0840093897414679 | 0.168018779482936 | 0.915990610258532 |
| 22 | 0.231446609764244 | 0.462893219528488 | 0.768553390235756 |
| 23 | 0.207575829645887 | 0.415151659291774 | 0.792424170354113 |
| 24 | 0.382868876120226 | 0.765737752240453 | 0.617131123879774 |
| 25 | 0.295788774151401 | 0.591577548302802 | 0.704211225848599 |
| 26 | 0.27859935830253 | 0.55719871660506 | 0.72140064169747 |
| 27 | 0.234392451351187 | 0.468784902702375 | 0.765607548648813 |
| 28 | 0.189838047377991 | 0.379676094755983 | 0.810161952622009 |
| 29 | 0.307794331185789 | 0.615588662371577 | 0.692205668814211 |
| 30 | 0.295893244258341 | 0.591786488516683 | 0.704106755741658 |
| 31 | 0.218748027074013 | 0.437496054148025 | 0.781251972925987 |
| 32 | 0.256718444661232 | 0.513436889322464 | 0.743281555338768 |
| 33 | 0.254211539882628 | 0.508423079765256 | 0.745788460117372 |
| 34 | 0.304272039301198 | 0.608544078602395 | 0.695727960698802 |
| 35 | 0.282298201899428 | 0.564596403798857 | 0.717701798100572 |
| 36 | 0.236660263574739 | 0.473320527149478 | 0.763339736425261 |
| 37 | 0.180848858742064 | 0.361697717484128 | 0.819151141257936 |
| 38 | 0.171370419750368 | 0.342740839500737 | 0.828629580249632 |
| 39 | 0.148557895746487 | 0.297115791492975 | 0.851442104253513 |
| 40 | 0.443662012219723 | 0.887324024439446 | 0.556337987780277 |
| 41 | 0.561135272118202 | 0.877729455763596 | 0.438864727881798 |
| 42 | 0.450676668884733 | 0.901353337769465 | 0.549323331115267 |
| 43 | 0.580445284284846 | 0.839109431430307 | 0.419554715715154 |
| 44 | 0.523090438492251 | 0.953819123015497 | 0.476909561507749 |
| 45 | 0.459603421268021 | 0.919206842536042 | 0.540396578731979 |
| Meta Analysis of Goldfeld-Quandt test for Heteroskedasticity | |||
| Description | # significant tests | % significant tests | OK/NOK |
| 1% type I error level | 0 | 0 | OK |
| 5% type I error level | 0 | 0 | OK |
| 10% type I error level | 0 | 0 | OK |