| Multiple Linear Regression - Estimated Regression Equation |
| WLMan[t] = + 4.74589368190231 + 0.252977925543289WLVrouw[t] + 0.286731211867211`Yt-1`[t] -0.140281941699051`Yt-2`[t] + 0.0307676256758232`Yt-3`[t] -0.0942370090570313`Yt-4`[t] -0.211902844334609M1[t] -0.403473617050317M2[t] -0.249269058051509M3[t] -0.592689012093239M4[t] -0.528197626041862M5[t] -0.515370882802887M6[t] -0.326476270103165M7[t] -0.038971385595141M8[t] + 0.131030026188113M9[t] + 0.104218769786131M10[t] + 0.00936951584773028M11[t] -0.0130676658698532t + e[t] |
| Multiple Linear Regression - Ordinary Least Squares | |||||
| Variable | Parameter | S.D. | T-STAT H0: parameter = 0 | 2-tail p-value | 1-tail p-value |
| (Intercept) | 4.74589368190231 | 1.484975 | 3.1959 | 0.002804 | 0.001402 |
| WLVrouw | 0.252977925543289 | 0.358825 | 0.705 | 0.485099 | 0.242549 |
| `Yt-1` | 0.286731211867211 | 0.576107 | 0.4977 | 0.62156 | 0.31078 |
| `Yt-2` | -0.140281941699051 | 0.572234 | -0.2451 | 0.807661 | 0.403831 |
| `Yt-3` | 0.0307676256758232 | 0.555972 | 0.0553 | 0.956157 | 0.478079 |
| `Yt-4` | -0.0942370090570313 | 0.316676 | -0.2976 | 0.767643 | 0.383821 |
| M1 | -0.211902844334609 | 0.286808 | -0.7388 | 0.464549 | 0.232275 |
| M2 | -0.403473617050317 | 0.291209 | -1.3855 | 0.173975 | 0.086988 |
| M3 | -0.249269058051509 | 0.414358 | -0.6016 | 0.551027 | 0.275513 |
| M4 | -0.592689012093239 | 0.40213 | -1.4739 | 0.148752 | 0.074376 |
| M5 | -0.528197626041862 | 0.394484 | -1.339 | 0.188539 | 0.09427 |
| M6 | -0.515370882802887 | 0.35084 | -1.469 | 0.150074 | 0.075037 |
| M7 | -0.326476270103165 | 0.292308 | -1.1169 | 0.271054 | 0.135527 |
| M8 | -0.038971385595141 | 0.308159 | -0.1265 | 0.900031 | 0.450015 |
| M9 | 0.131030026188113 | 0.325835 | 0.4021 | 0.689837 | 0.344918 |
| M10 | 0.104218769786131 | 0.328711 | 0.3171 | 0.752939 | 0.376469 |
| M11 | 0.00936951584773028 | 0.298661 | 0.0314 | 0.975137 | 0.487569 |
| t | -0.0130676658698532 | 0.007412 | -1.763 | 0.085946 | 0.042973 |
| Multiple Linear Regression - Regression Statistics | |
| Multiple R | 0.85370008363738 |
| R-squared | 0.728803832802469 |
| Adjusted R-squared | 0.607479231687784 |
| F-TEST (value) | 6.00705731654168 |
| F-TEST (DF numerator) | 17 |
| F-TEST (DF denominator) | 38 |
| p-value | 2.25105635887068e-06 |
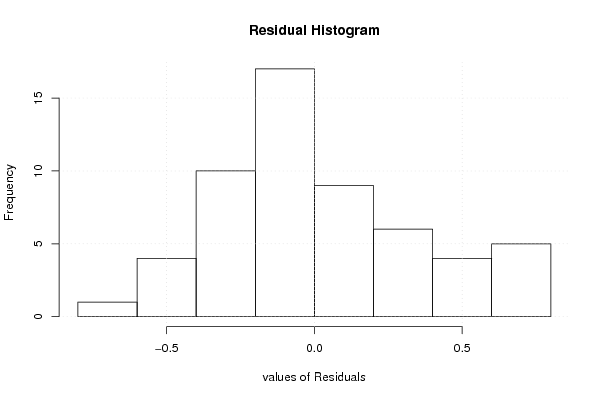
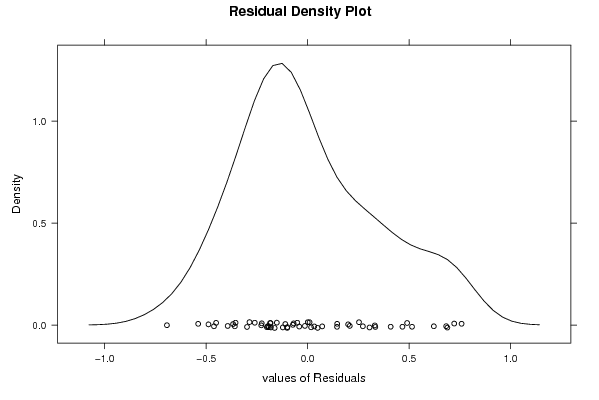
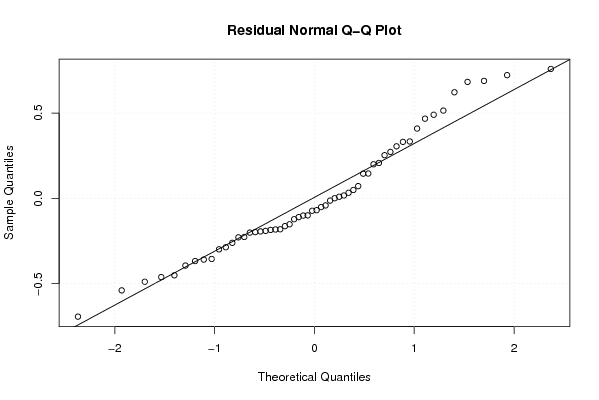
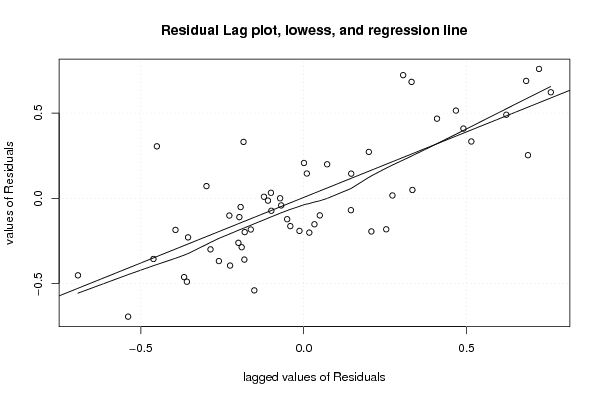
| Multiple Linear Regression - Residual Statistics | |
| Residual Standard Deviation | 0.416181974052504 |
| Sum Squared Residuals | 6.58188254999708 |
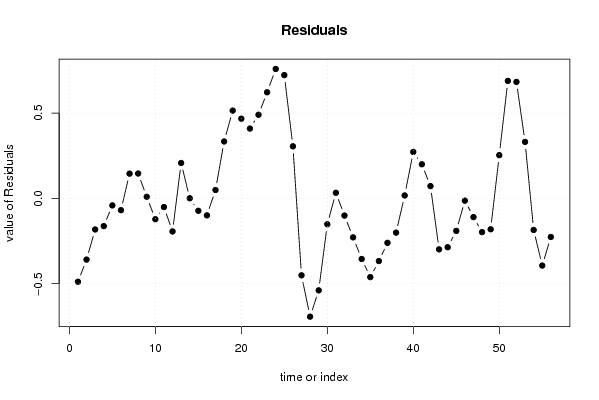
| Multiple Linear Regression - Actuals, Interpolation, and Residuals | |||
| Time or Index | Actuals | Interpolation Forecast | Residuals Prediction Error |
| 1 | 6.5 | 6.98856991869931 | -0.488569918699314 |
| 2 | 6.6 | 6.95872290909206 | -0.358722909092058 |
| 3 | 7.6 | 7.78231892804928 | -0.182318928049276 |
| 4 | 8 | 8.16257090907046 | -0.162570909070454 |
| 5 | 8.1 | 8.14123011877719 | -0.0412301187771918 |
| 6 | 7.7 | 7.76910544585012 | -0.0691054458501248 |
| 7 | 7.5 | 7.3550353706694 | 0.144964629330602 |
| 8 | 7.6 | 7.45422193586786 | 0.145778064132140 |
| 9 | 7.8 | 7.79043115150665 | 0.00956884849334667 |
| 10 | 7.8 | 7.92206859295998 | -0.122068592959981 |
| 11 | 7.8 | 7.85083202652003 | -0.0508320265200283 |
| 12 | 7.5 | 7.69373264693125 | -0.19373264693125 |
| 13 | 7.5 | 7.29230792089162 | 0.207692079108376 |
| 14 | 7.1 | 7.09923334569328 | 0.000766654306715076 |
| 15 | 7.5 | 7.57249211708176 | -0.0724921170817615 |
| 16 | 7.5 | 7.59951749965051 | -0.0995174996505113 |
| 17 | 7.6 | 7.55060369816118 | 0.049396301838819 |
| 18 | 7.7 | 7.3662671980155 | 0.3337328019845 |
| 19 | 7.7 | 7.18538525685006 | 0.514614743149939 |
| 20 | 7.9 | 7.43267278393612 | 0.467327216063881 |
| 21 | 8.1 | 7.6906533457704 | 0.4093466542296 |
| 22 | 8.2 | 7.70965450567927 | 0.490345494320729 |
| 23 | 8.2 | 7.57788537278285 | 0.622114627217151 |
| 24 | 8.2 | 7.44115942524504 | 0.758840574754956 |
| 25 | 7.9 | 7.17747536010125 | 0.722524639898754 |
| 26 | 7.3 | 6.99473978472033 | 0.305260215279669 |
| 27 | 6.9 | 7.35095289496016 | -0.450952894960158 |
| 28 | 6.6 | 7.29329323146241 | -0.693293231462409 |
| 29 | 6.7 | 7.23924205554948 | -0.539242055549475 |
| 30 | 6.9 | 7.05172363997436 | -0.151723639974359 |
| 31 | 7 | 6.96711190943698 | 0.0328880905630153 |
| 32 | 7.1 | 7.20066980841795 | -0.100669808417948 |
| 33 | 7.2 | 7.42844951836889 | -0.228449518368886 |
| 34 | 7.1 | 7.45513193410954 | -0.355131934109542 |
| 35 | 6.9 | 7.36145792284849 | -0.461457922848491 |
| 36 | 7 | 7.36739529625282 | -0.367395296252819 |
| 37 | 6.8 | 7.06048303611206 | -0.260483036112060 |
| 38 | 6.4 | 6.60063495583807 | -0.200634955838065 |
| 39 | 6.7 | 6.68289357483495 | 0.0171064251650543 |
| 40 | 6.6 | 6.32759591812059 | 0.27240408187941 |
| 41 | 6.4 | 6.20009190113963 | 0.199908098860370 |
| 42 | 6.3 | 6.22803392847634 | 0.0719660715236602 |
| 43 | 6.2 | 6.49866590575082 | -0.298665905750820 |
| 44 | 6.5 | 6.78630858105029 | -0.28630858105029 |
| 45 | 6.8 | 6.99046598435406 | -0.19046598435406 |
| 46 | 6.8 | 6.8131449672512 | -0.0131449672512064 |
| 47 | 6.4 | 6.50982467784863 | -0.109824677848631 |
| 48 | 6.1 | 6.29771263157089 | -0.197712631570886 |
| 49 | 5.8 | 5.98116376419576 | -0.181163764195756 |
| 50 | 6.1 | 5.84666900465626 | 0.253330995343740 |
| 51 | 7.2 | 6.51134248507386 | 0.688657514926141 |
| 52 | 7.3 | 6.61702244169604 | 0.682977558303964 |
| 53 | 6.9 | 6.56883222637252 | 0.331167773627478 |
| 54 | 6.1 | 6.28486978768368 | -0.184869787683677 |
| 55 | 5.8 | 6.19380155729274 | -0.393801557292736 |
| 56 | 6.2 | 6.42612689072778 | -0.226126890727784 |
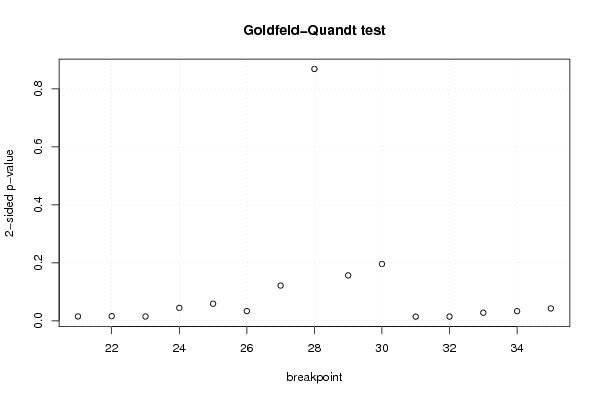
| Goldfeld-Quandt test for Heteroskedasticity | |||
| p-values | Alternative Hypothesis | ||
| breakpoint index | greater | 2-sided | less |
| 21 | 0.00750110273949797 | 0.0150022054789959 | 0.992498897260502 |
| 22 | 0.00798305414028374 | 0.0159661082805675 | 0.992016945859716 |
| 23 | 0.00740345469345923 | 0.0148069093869185 | 0.99259654530654 |
| 24 | 0.0222575613231755 | 0.0445151226463509 | 0.977742438676825 |
| 25 | 0.0294047426895619 | 0.0588094853791237 | 0.970595257310438 |
| 26 | 0.0166854491952308 | 0.0333708983904616 | 0.98331455080477 |
| 27 | 0.0607729768606942 | 0.121545953721388 | 0.939227023139306 |
| 28 | 0.56548563579269 | 0.869028728414619 | 0.434514364207309 |
| 29 | 0.921740491745673 | 0.156519016508654 | 0.078259508254327 |
| 30 | 0.90200668725924 | 0.195986625481521 | 0.0979933127407606 |
| 31 | 0.992898209780781 | 0.0142035804384374 | 0.00710179021921872 |
| 32 | 0.992791368309498 | 0.0144172633810042 | 0.00720863169050208 |
| 33 | 0.986118559304374 | 0.0277628813912513 | 0.0138814406956256 |
| 34 | 0.983446379776874 | 0.0331072404462522 | 0.0165536202231261 |
| 35 | 0.978707988944746 | 0.0425840221105079 | 0.0212920110552540 |
| Meta Analysis of Goldfeld-Quandt test for Heteroskedasticity | |||
| Description | # significant tests | % significant tests | OK/NOK |
| 1% type I error level | 0 | 0 | OK |
| 5% type I error level | 10 | 0.666666666666667 | NOK |
| 10% type I error level | 11 | 0.733333333333333 | NOK |